| Param | Original file | Final file |
|---|---|---|
| Filename | modeM0/AS1A10_071T46_9000004460_30866cztM0_level2.evt | modeM0/AS1A10_071T46_9000004460_30866cztM0_level2_quad_clean.evt |
| Size (bytes) | 817,390,080 | 92,977,920 |
| Size | 779.5 MB | 88.7 MB |
| Events in quadrant A | 3,827,357 | 604,994 |
| Events in quadrant B | 11,849,936 | 558,256 |
| Events in quadrant C | 4,245,145 | 576,654 |
| Events in quadrant D | 4,348,256 | 575,833 |
| Mode M0 | |||
|---|---|---|---|
| Quadrant | BADHDUFLAG | Total packets | Discarded packets |
| A | 0 | 15767 | 1 |
| B | 0 | 40196 | 1 |
| C | 0 | 17059 | 1 |
| D | 0 | 17229 | 1 |
| Mode SS | |||
|---|---|---|---|
| Quadrant | BADHDUFLAG | Total packets | Discarded packets |
| A | 0 | 146 | 0 |
| B | 0 | 146 | 0 |
| C | 0 | 146 | 0 |
| D | 0 | 146 | 0 |
| Mode M9 | |||
|---|---|---|---|
| Quadrant | BADHDUFLAG | Total packets | Discarded packets |
| A | 0 | 2 | 0 |
| B | 0 | 2 | 0 |
| C | 0 | 2 | 0 |
| D | 0 | 2 | 0 |
| Quadrant | Total seconds | Saturated seconds | Saturation percentage |
|---|---|---|---|
| A | 7169 | 240 | 3.347747% |
| B | 7170 | 2570 | 35.843794% |
| C | 7170 | 328 | 4.574616% |
| D | 7170 | 206 | 2.873082% |
Noise dominated data is calculated using 1-second bins in cleaned event files. If a bin has >2000 counts, and if more than 50% of those come from <1% of pixels, then it is considered to be noise-dominated and hence unusable.
| Quadrant | # 1 sec bins | Bins with >0 counts | Bins with >2000 counts | High rate bins dominated by noise | Noise dominated (total time) | Noise dominated (detector-on time) | Marked lightcurve |
|---|---|---|---|---|---|---|---|
| A | 7374 | 7170 | 75 | 75 | 1.02% | 1.05% | 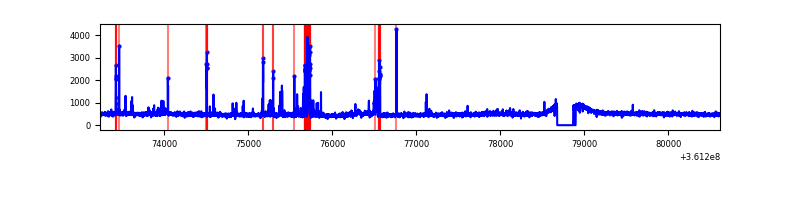 |
| B | 7375 | 7170 | 1104 | 1104 | 14.97% | 15.40% | 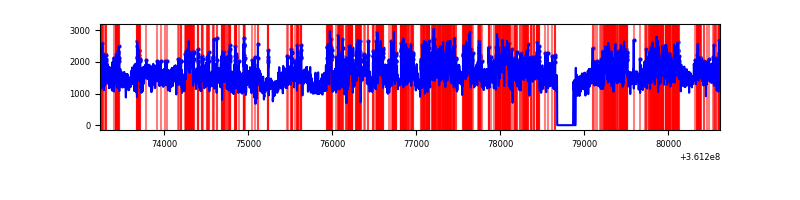 |
| C | 7375 | 7170 | 69 | 69 | 0.94% | 0.96% | 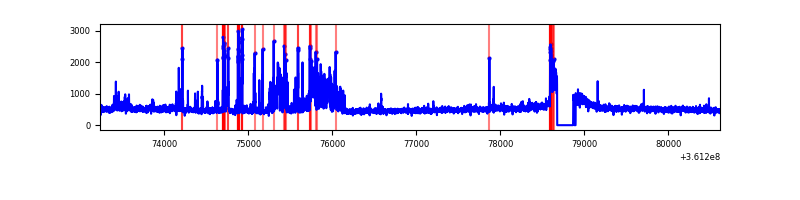 |
| D | 7375 | 7170 | 76 | 76 | 1.03% | 1.06% | 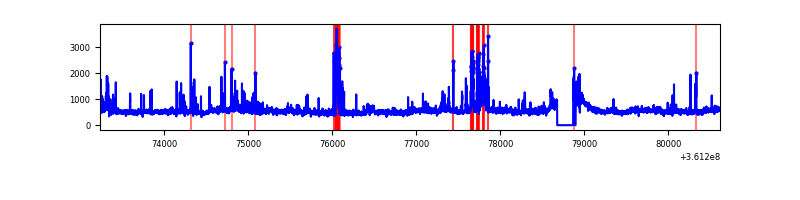 |
Top three noisy pixels from each quadrant. If the there are fewer than three noisy pixels in the level2.evt file, extra rows are filled as -1
| Pixel properties | Quadrant properties | ||||||
|---|---|---|---|---|---|---|---|
| Quadrant | DetID | PixID | Counts | Sigma | Mean | Median | Sigma |
| A | 0 | 13 | 366611 | 2023.94 | 893 | 873 | 180.7 |
| A | 5 | 168 | 13798 | 71.52 | 893 | 873 | 180.7 |
| A | 13 | 254 | 13107 | 67.7 | 893 | 873 | 180.7 |
| B | 6 | 36 | 6656554 | 41544.63 | 817 | 793 | 160.2 |
| B | 6 | 159 | 1879984 | 11729.73 | 817 | 793 | 160.2 |
| B | 0 | 190 | 37591 | 229.69 | 817 | 793 | 160.2 |
| C | 2 | 16 | 759871 | 3805.39 | 845 | 852 | 199.5 |
| C | 14 | 238 | 136266 | 678.91 | 845 | 852 | 199.5 |
| C | 3 | 233 | 32750 | 159.92 | 845 | 852 | 199.5 |
| D | 8 | 195 | 576704 | 2815.39 | 860 | 842 | 204.5 |
| D | 12 | 233 | 415399 | 2026.77 | 860 | 842 | 204.5 |
| D | 2 | 250 | 34909 | 166.55 | 860 | 842 | 204.5 |
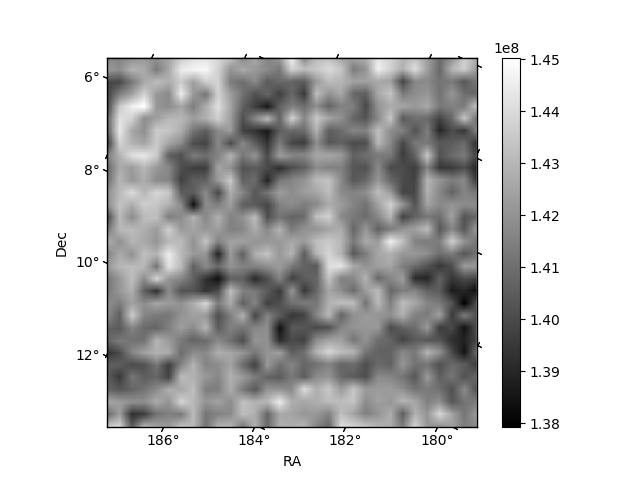
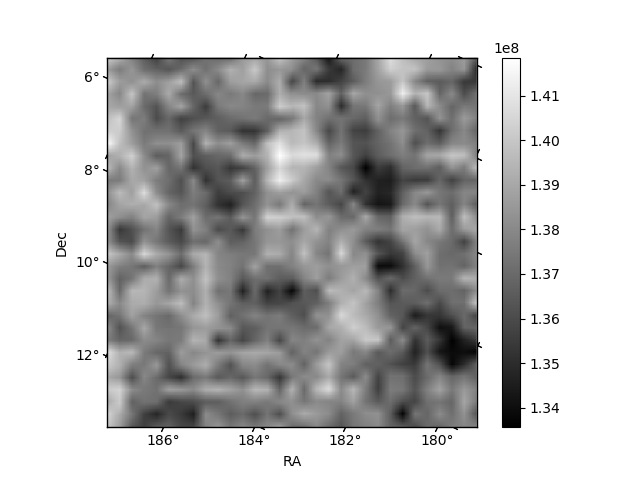
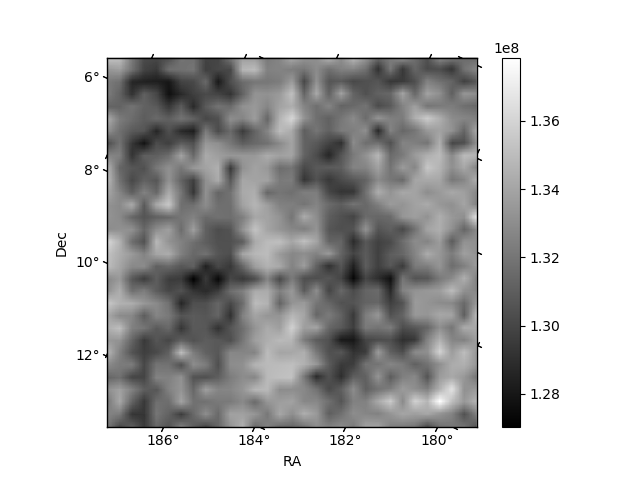
Histogram calculated using DETX and DETY for each event in the final _common_clean file
| Quadrant A | 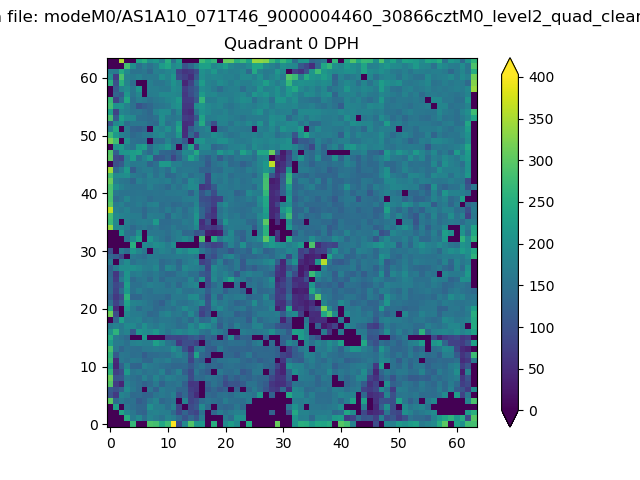 |
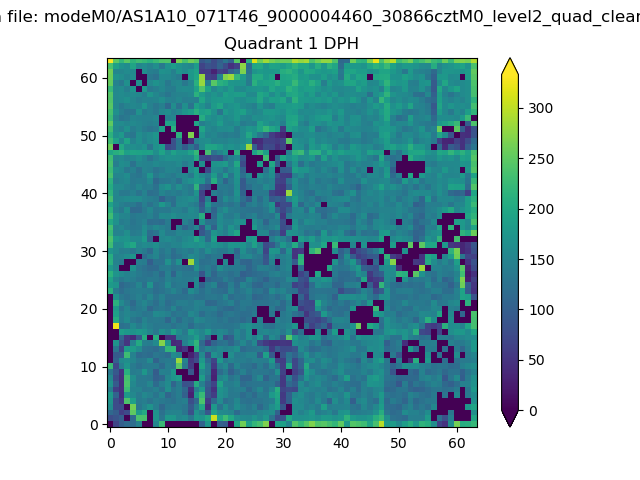 |
Quadrant B |
|---|---|---|---|
| Quadrant D | 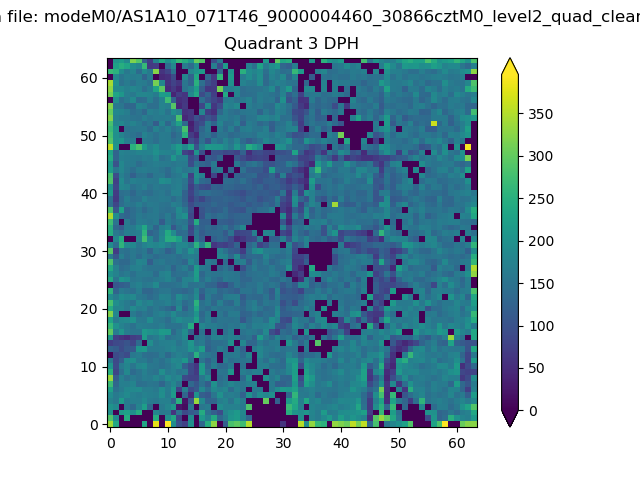 |
 |
Quadrant C |
| Plot type | Count rate plots | Images |
|---|---|---|
| Comparison with Poisson distribution Blue bars denote a histogram of data divided into 1 sec bins. Red curve is a Poisson curve with rate = median count rate of data. |
 |
 |
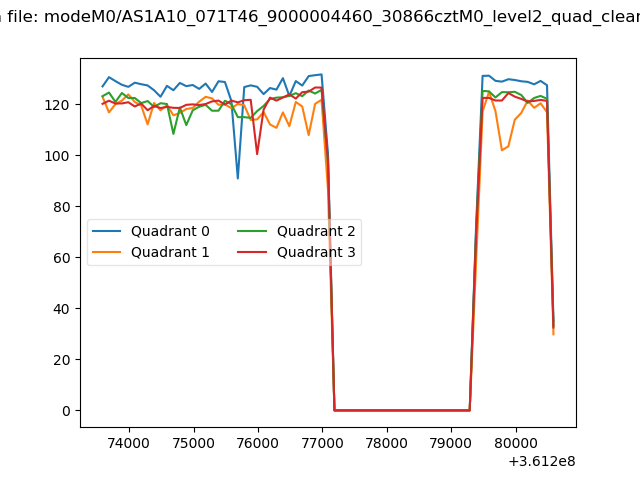
| Quadrant-wise count rates Data is divided into 100 sec bins |
 |
|
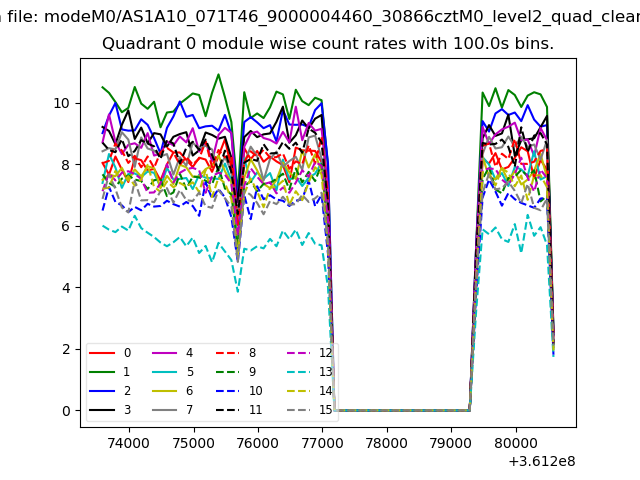
| Module-wise count rates for Quadrant A Data is divided into 100 sec bins |
 |
 |
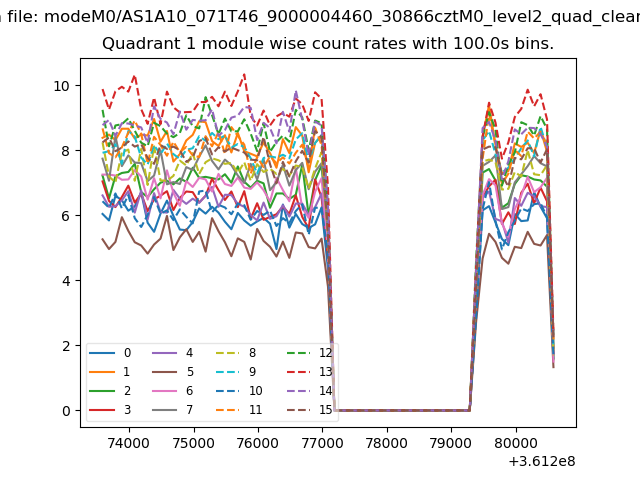
| Module-wise count rates for Quadrant B Data is divided into 100 sec bins |
 |
 |
| Module-wise count rates for Quadrant C Data is divided into 100 sec bins |
 |
 |
| Module-wise count rates for Quadrant D Data is divided into 100 sec bins |
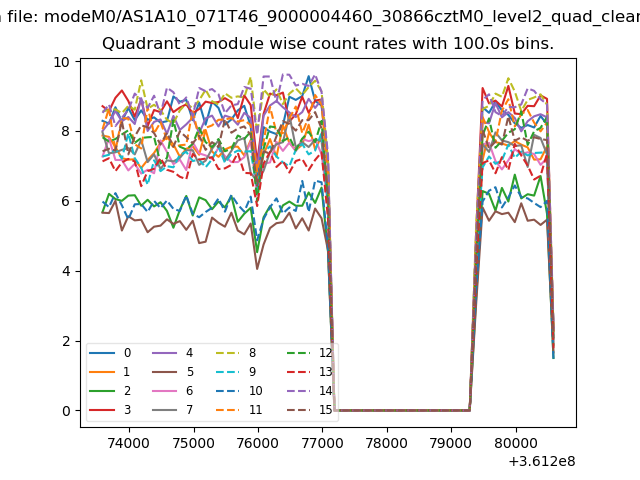 |
 |
| Parameter | Plot |
|---|---|
| CZT HV Monitor | 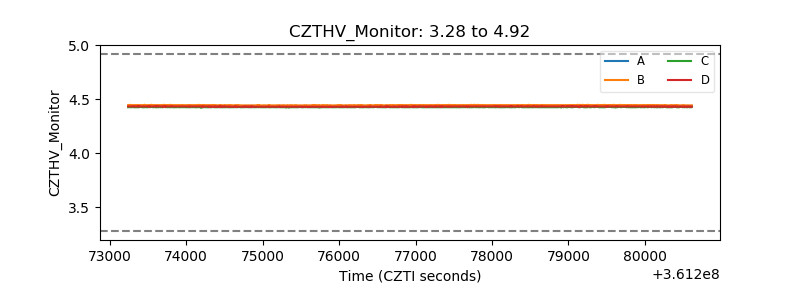 |
| D_VDD | 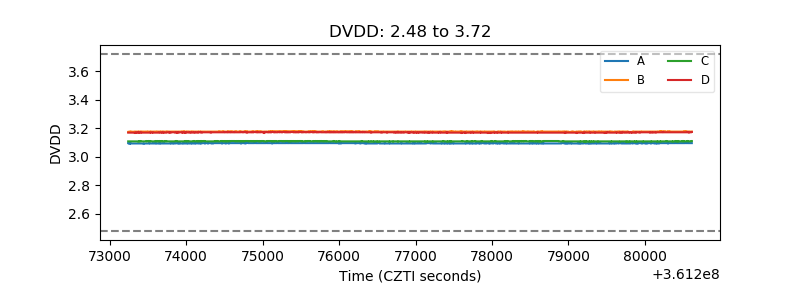 |
| Temperature 1 | 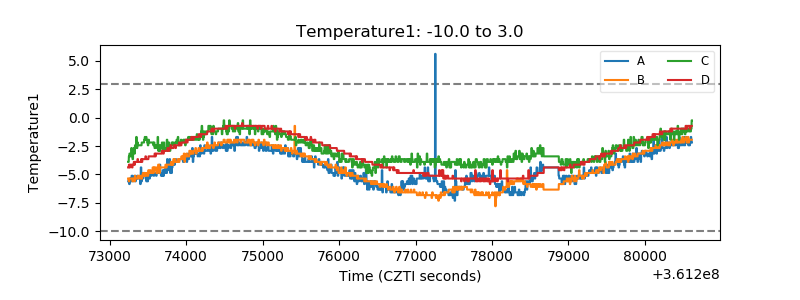 |
| Veto HV Monitor |  |
| Veto LLD | 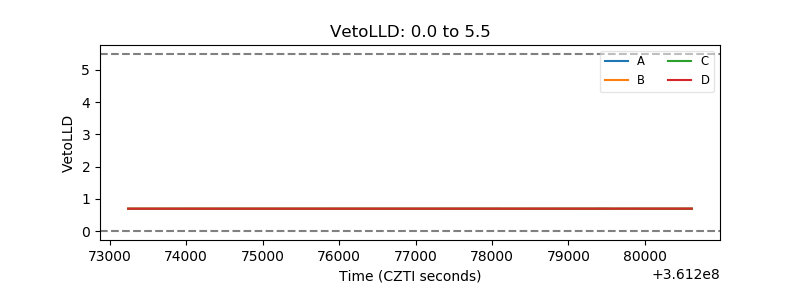 |
| Alpha Counter | 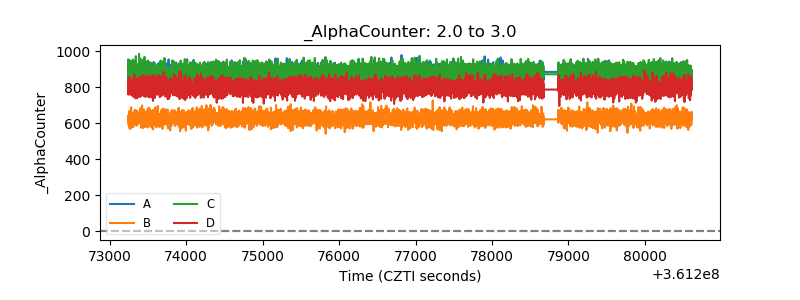 |
| _CPM_Rate | 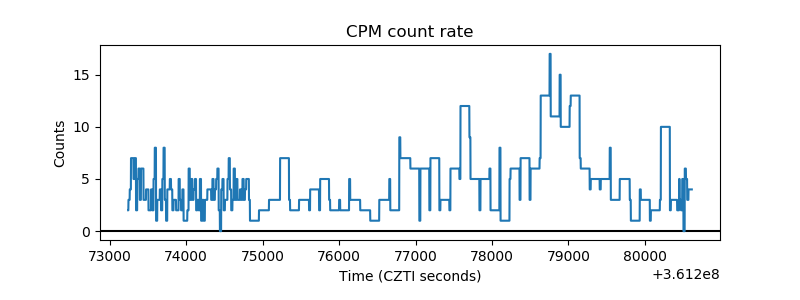 |
| CZT Counter |  |
| +2.5 Volts monitor |  |
| +5 Volts monitor |  |
| _ROLL_ROT | 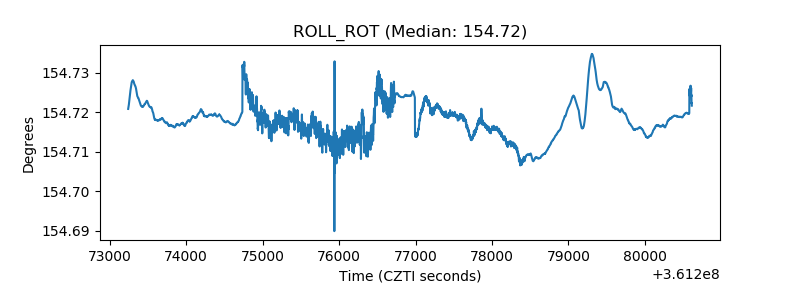 |
| _Roll_DEC | 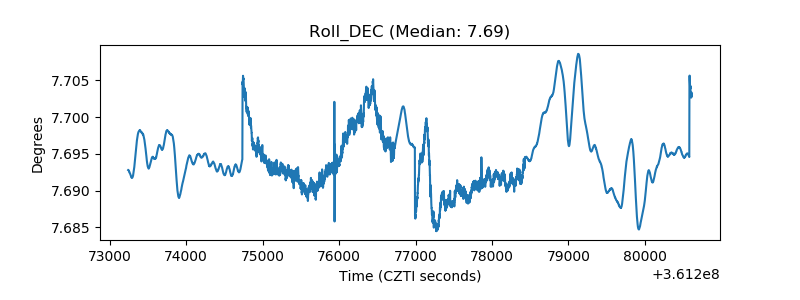 |
| _Roll_RA |  |
| Veto Counter | 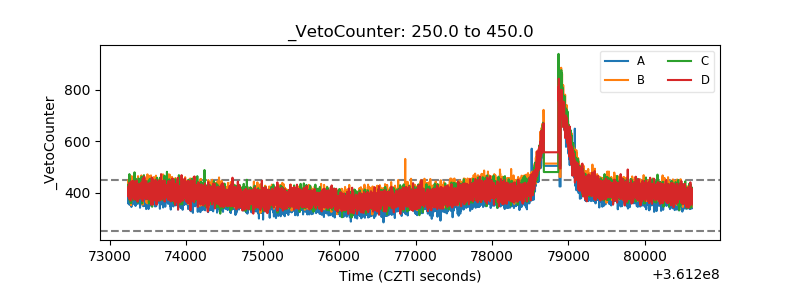 |