| Param | Original file | Final file |
|---|---|---|
| Filename | modeM0/AS1A10_071T46_9000004460_30869cztM0_level2.evt | modeM0/AS1A10_071T46_9000004460_30869cztM0_level2_quad_clean.evt |
| Size (bytes) | 230,051,520 | 40,438,080 |
| Size | 219.4 MB | 38.6 MB |
| Events in quadrant A | 1,013,084 | 281,338 |
| Events in quadrant B | 3,538,051 | 251,276 |
| Events in quadrant C | 1,023,918 | 266,826 |
| Events in quadrant D | 1,240,273 | 264,946 |
| Mode M0 | |||
|---|---|---|---|
| Quadrant | BADHDUFLAG | Total packets | Discarded packets |
| A | 0 | 4432 | 0 |
| B | 0 | 12073 | 0 |
| C | 0 | 4440 | 0 |
| D | 0 | 5086 | 0 |
| Mode SS | |||
|---|---|---|---|
| Quadrant | BADHDUFLAG | Total packets | Discarded packets |
| A | 0 | 44 | 0 |
| B | 0 | 44 | 0 |
| C | 0 | 44 | 0 |
| D | 0 | 44 | 0 |
| Quadrant | Total seconds | Saturated seconds | Saturation percentage |
|---|---|---|---|
| A | 2207 | 3 | 0.135931% |
| B | 2208 | 687 | 31.114130% |
| C | 2208 | 7 | 0.317029% |
| D | 2208 | 3 | 0.135870% |
Noise dominated data is calculated using 1-second bins in cleaned event files. If a bin has >2000 counts, and if more than 50% of those come from <1% of pixels, then it is considered to be noise-dominated and hence unusable.
| Quadrant | # 1 sec bins | Bins with >0 counts | Bins with >2000 counts | High rate bins dominated by noise | Noise dominated (total time) | Noise dominated (detector-on time) | Marked lightcurve |
|---|---|---|---|---|---|---|---|
| A | 2207 | 2207 | 0 | 0 | 0.00% | 0.00% | 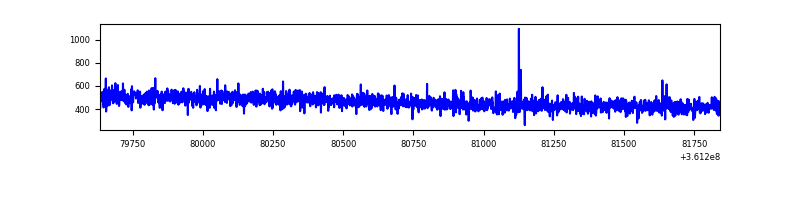 |
| B | 2208 | 2208 | 472 | 472 | 21.38% | 21.38% | 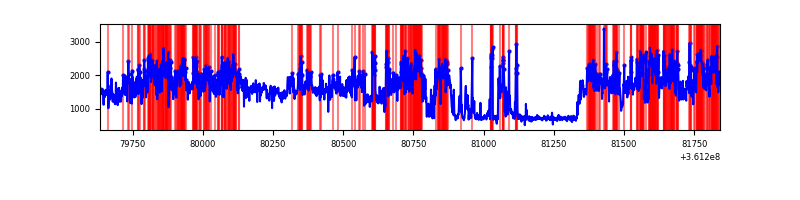 |
| C | 2208 | 2208 | 0 | 0 | 0.00% | 0.00% | 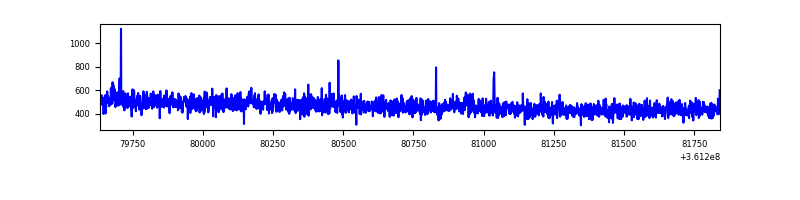 |
| D | 2208 | 2208 | 4 | 4 | 0.18% | 0.18% | 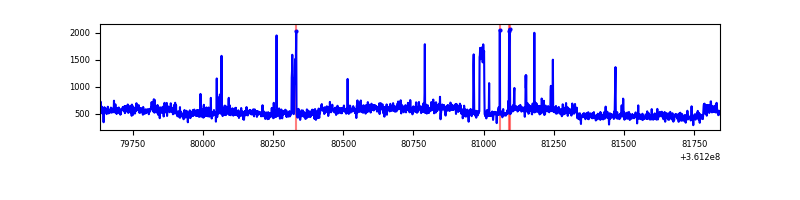 |
Top three noisy pixels from each quadrant. If the there are fewer than three noisy pixels in the level2.evt file, extra rows are filled as -1
| Pixel properties | Quadrant properties | ||||||
|---|---|---|---|---|---|---|---|
| Quadrant | DetID | PixID | Counts | Sigma | Mean | Median | Sigma |
| A | 13 | 254 | 3861 | 65.82 | 262 | 256 | 54.8 |
| A | 3 | 137 | 2640 | 43.53 | 262 | 256 | 54.8 |
| A | 0 | 226 | 2230 | 36.04 | 262 | 256 | 54.8 |
| B | 6 | 36 | 1837216 | 38696.23 | 239 | 234 | 47.5 |
| B | 6 | 159 | 557255 | 11733.71 | 239 | 234 | 47.5 |
| B | 5 | 172 | 140280 | 2950.08 | 239 | 234 | 47.5 |
| C | 14 | 238 | 39131 | 654.87 | 247 | 247 | 59.4 |
| C | 3 | 233 | 11519 | 189.84 | 247 | 247 | 59.4 |
| C | 2 | 114 | 4938 | 79.0 | 247 | 247 | 59.4 |
| D | 8 | 195 | 242261 | 3964.72 | 253 | 248 | 61.0 |
| D | 2 | 234 | 10733 | 171.77 | 253 | 248 | 61.0 |
| D | 2 | 250 | 10219 | 163.35 | 253 | 248 | 61.0 |
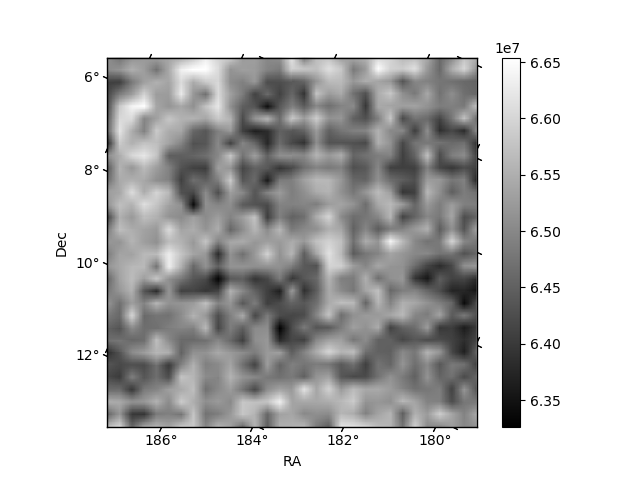
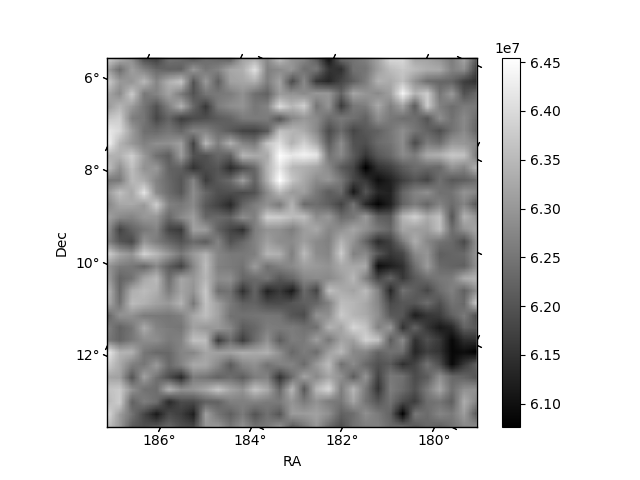
Histogram calculated using DETX and DETY for each event in the final _common_clean file
| Quadrant A | 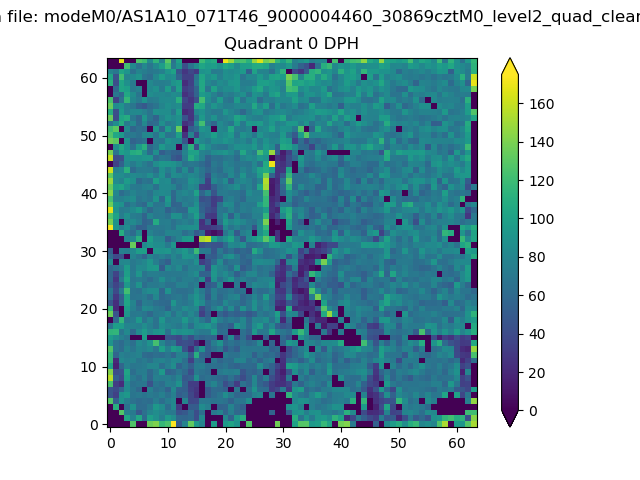 |
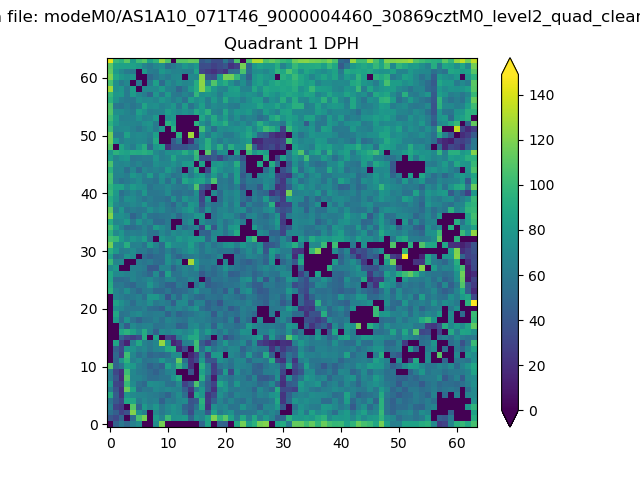 |
Quadrant B |
|---|---|---|---|
| Quadrant D | 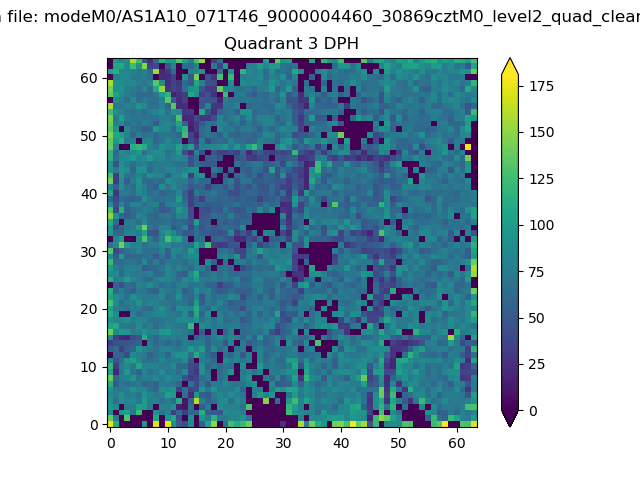 |
 |
Quadrant C |
| Plot type | Count rate plots | Images |
|---|---|---|
| Comparison with Poisson distribution Blue bars denote a histogram of data divided into 1 sec bins. Red curve is a Poisson curve with rate = median count rate of data. |
 |
 |
| Quadrant-wise count rates Data is divided into 100 sec bins |
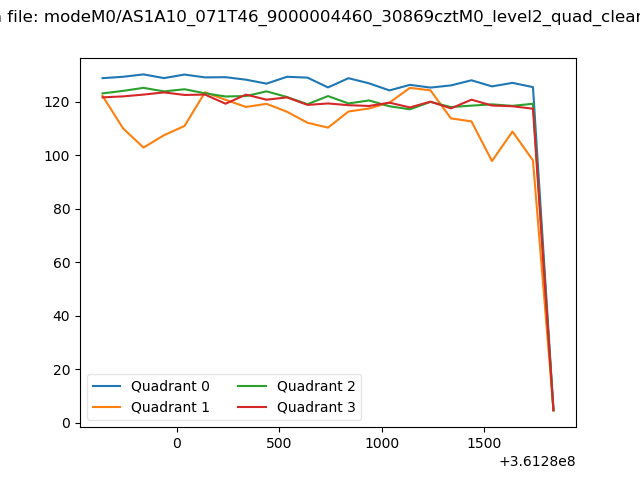 |
|
| Module-wise count rates for Quadrant A Data is divided into 100 sec bins |
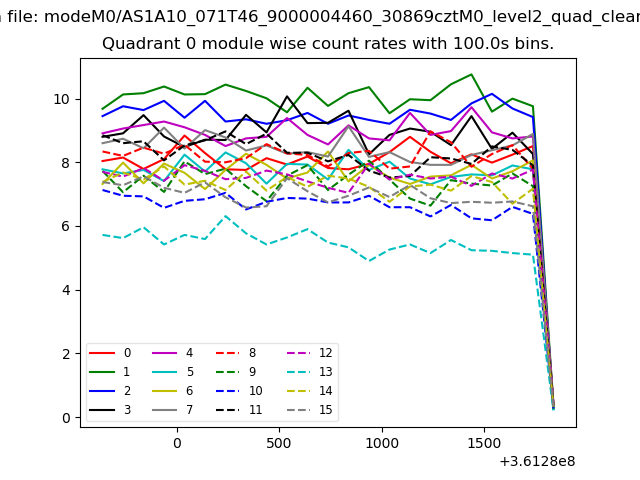 |
 |
| Module-wise count rates for Quadrant B Data is divided into 100 sec bins |
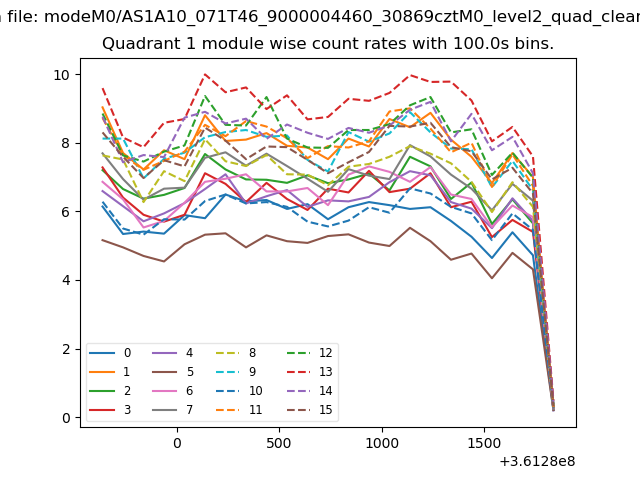 |
 |
| Module-wise count rates for Quadrant C Data is divided into 100 sec bins |
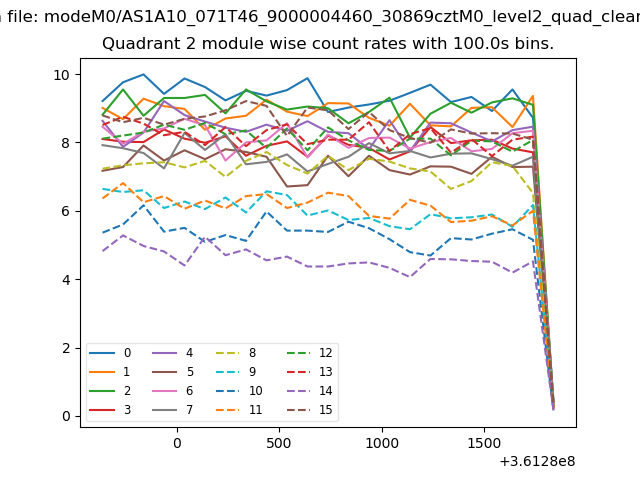 |
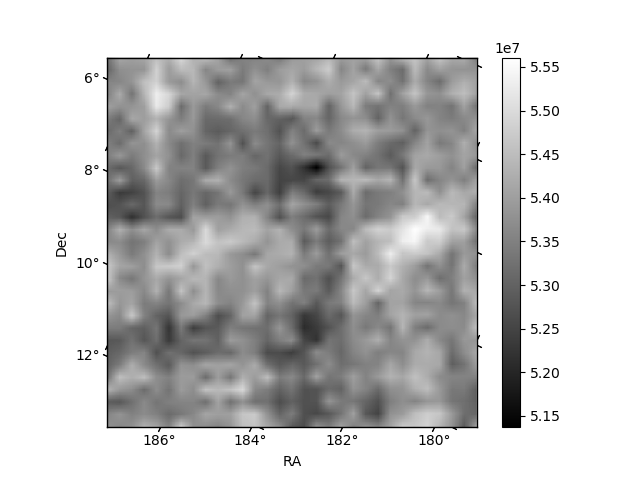 |
| Module-wise count rates for Quadrant D Data is divided into 100 sec bins |
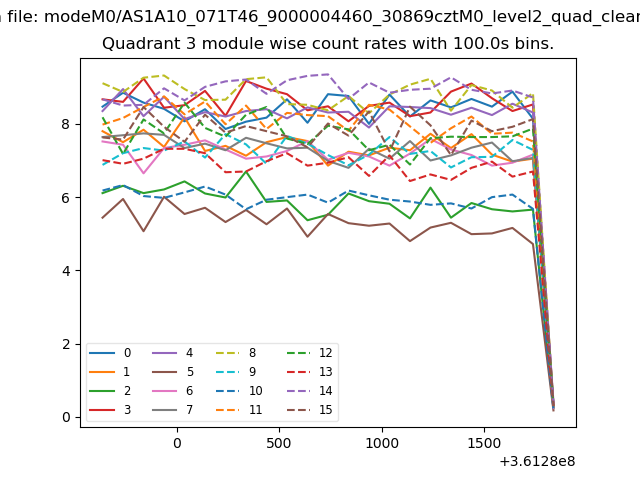 |
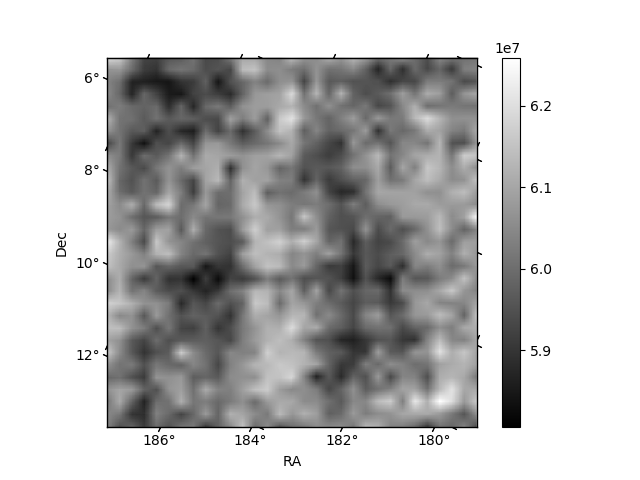 |
| Parameter | Plot |
|---|---|
| CZT HV Monitor | 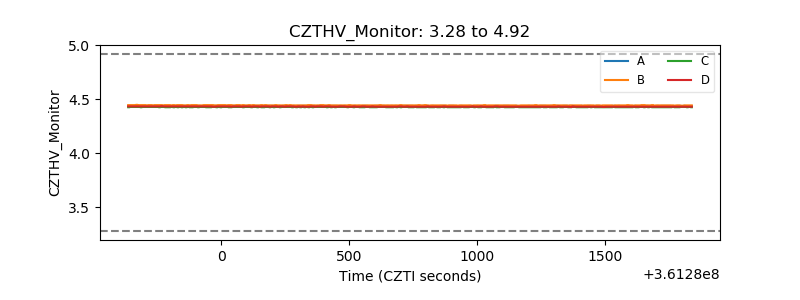 |
| D_VDD |  |
| Temperature 1 | 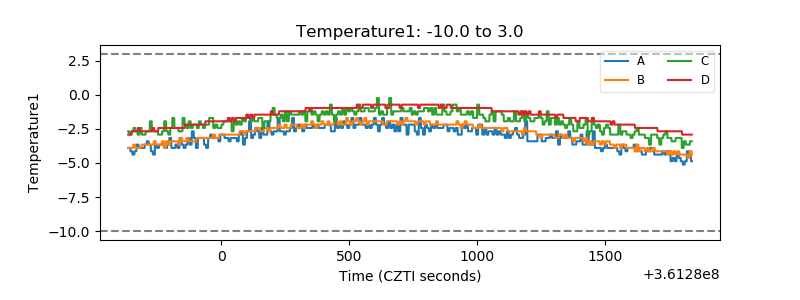 |
| Veto HV Monitor |  |
| Veto LLD | 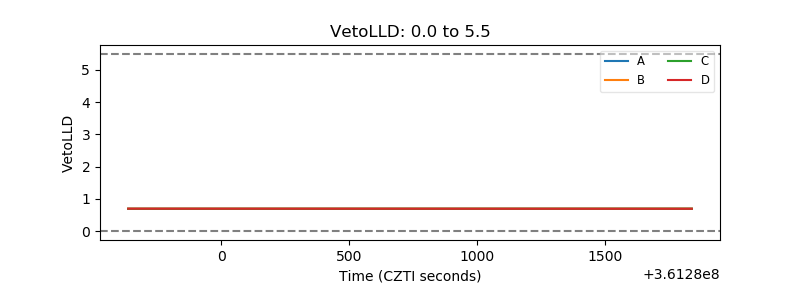 |
| Alpha Counter | 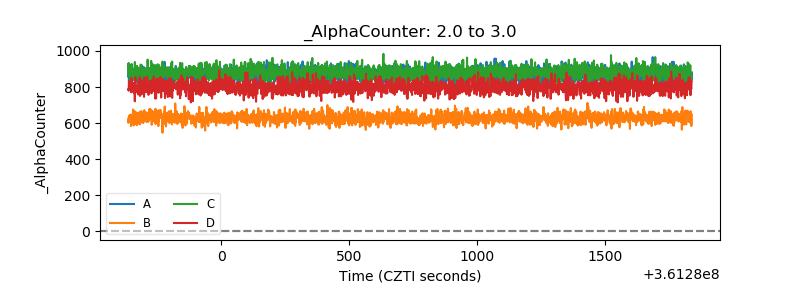 |
| _CPM_Rate | 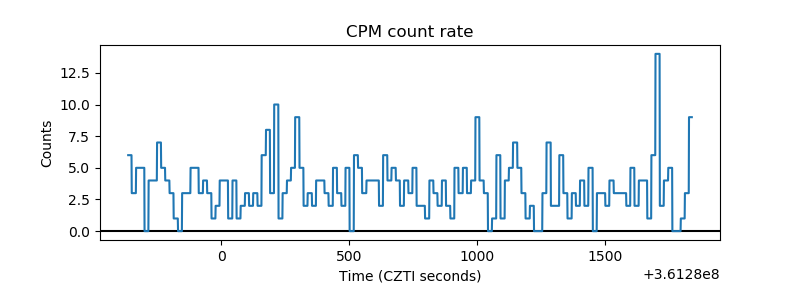 |
| CZT Counter |  |
| +2.5 Volts monitor |  |
| +5 Volts monitor |  |
| _ROLL_ROT | 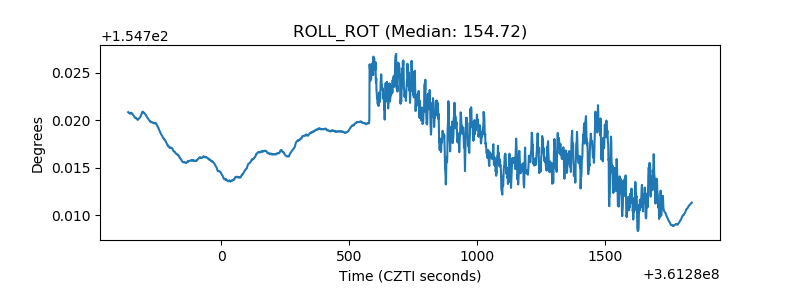 |
| _Roll_DEC | 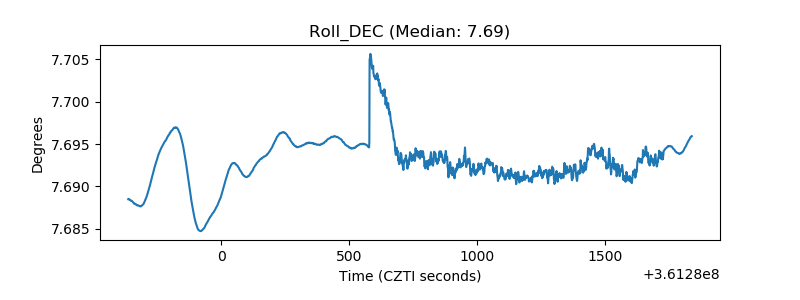 |
| _Roll_RA |  |
| Veto Counter | 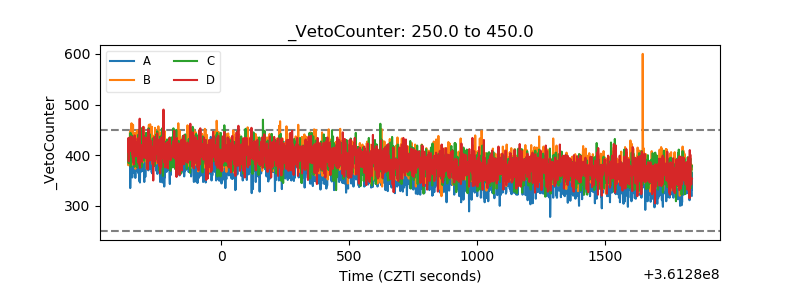 |