| Param | Original file | Final file |
|---|---|---|
| Filename | modeM0/AS1A10_071T49_9000004462cztM0_level2.fits | modeM0/AS1A10_071T49_9000004462cztM0_level2_quad_clean.evt |
| Size (bytes) | 692,046,720 | 494,323,200 |
| Size | 660.0 MB | 471.4 MB |
| Events in quadrant A | 4,493,842 | 2,971,368 |
| Events in quadrant B | 3,524,358 | 1,772,397 |
| Events in quadrant C | 4,282,628 | 2,777,374 |
| Events in quadrant D | 3,758,354 | 2,559,496 |
| Mode SS | |||
|---|---|---|---|
| Quadrant | BADHDUFLAG | Total packets | Discarded packets |
| A | 0 | 1448 | 0 |
| B | 0 | 1448 | 0 |
| C | 0 | 1448 | 0 |
| D | 0 | 1448 | 0 |
| Mode M0 | |||
|---|---|---|---|
| Quadrant | BADHDUFLAG | Total packets | Discarded packets |
| A | 0 | 154744 | 0 |
| B | 0 | 378089 | 0 |
| C | 0 | 156811 | 0 |
| D | 0 | 176481 | 0 |
| Mode M9 | |||
|---|---|---|---|
| Quadrant | BADHDUFLAG | Total packets | Discarded packets |
| A | 0 | 111 | 0 |
| B | 0 | 111 | 0 |
| C | 0 | 111 | 0 |
| D | 0 | 111 | 0 |
| Quadrant | Total seconds | Saturated seconds | Saturation percentage |
|---|---|---|---|
| A | 71255 | 1610 | 2.259491% |
| B | 71255 | 26685 | 37.450004% |
| C | 71255 | 1938 | 2.719809% |
| D | 71255 | 1732 | 2.430707% |
Noise dominated data is calculated using 1-second bins in cleaned event files. If a bin has >2000 counts, and if more than 50% of those come from <1% of pixels, then it is considered to be noise-dominated and hence unusable.
| Quadrant | # 1 sec bins | Bins with >0 counts | Bins with >2000 counts | High rate bins dominated by noise | Noise dominated (total time) | Noise dominated (detector-on time) | Marked lightcurve |
|---|---|---|---|---|---|---|---|
| A | 82450 | 71242 | 0 | 0 | 0.00% | 0.00% |  |
| B | 82450 | 71227 | 0 | 0 | 0.00% | 0.00% |  |
| C | 82450 | 71246 | 0 | 0 | 0.00% | 0.00% |  |
| D | 82450 | 71245 | 0 | 0 | 0.00% | 0.00% | 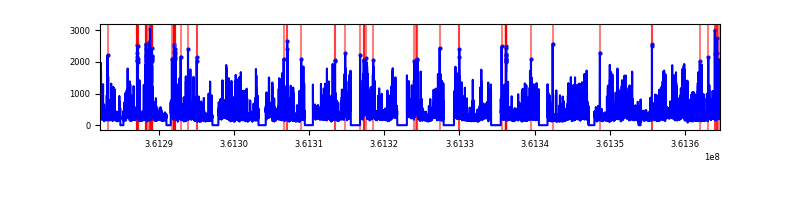 |
Top three noisy pixels from each quadrant. If the there are fewer than three noisy pixels in the level2.evt file, extra rows are filled as -1
| Pixel properties | Quadrant properties | ||||||
|---|---|---|---|---|---|---|---|
| Quadrant | DetID | PixID | Counts | Sigma | Mean | Median | Sigma |
| A | 0 | 29 | 3633 | 8.97 | 1170 | 1102 | 282.2 |
| A | 7 | 110 | 3533 | 8.61 | 1170 | 1102 | 282.2 |
| A | 9 | 19 | 3384 | 8.09 | 1170 | 1102 | 282.2 |
| B | 2 | 9 | 2728 | 9.81 | 932 | 891 | 187.2 |
| B | 5 | 128 | 2421 | 8.17 | 932 | 891 | 187.2 |
| B | 5 | 232 | 2355 | 7.82 | 932 | 891 | 187.2 |
| C | 12 | 241 | 2991 | 6.69 | 1133 | 1059 | 288.9 |
| C | 3 | 126 | 2881 | 6.31 | 1133 | 1059 | 288.9 |
| C | 9 | 233 | 2833 | 6.14 | 1133 | 1059 | 288.9 |
| D | 10 | 189 | 2722 | 6.18 | 1072 | 977 | 282.4 |
| D | 7 | 3 | 2716 | 6.16 | 1072 | 977 | 282.4 |
| D | 15 | 47 | 2628 | 5.84 | 1072 | 977 | 282.4 |
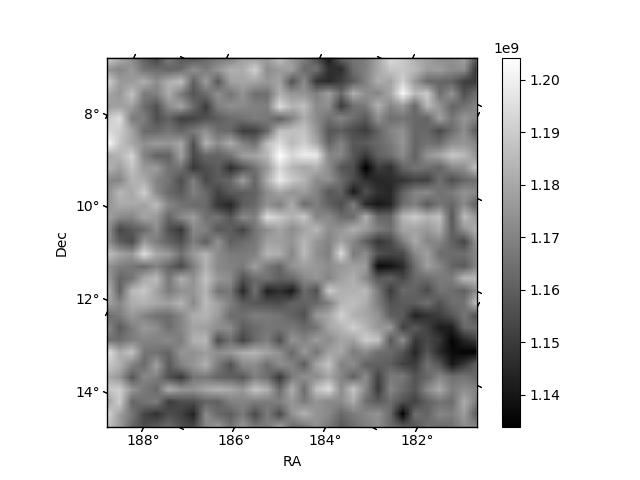
Histogram calculated using DETX and DETY for each event in the final _common_clean file
| Quadrant A |  |
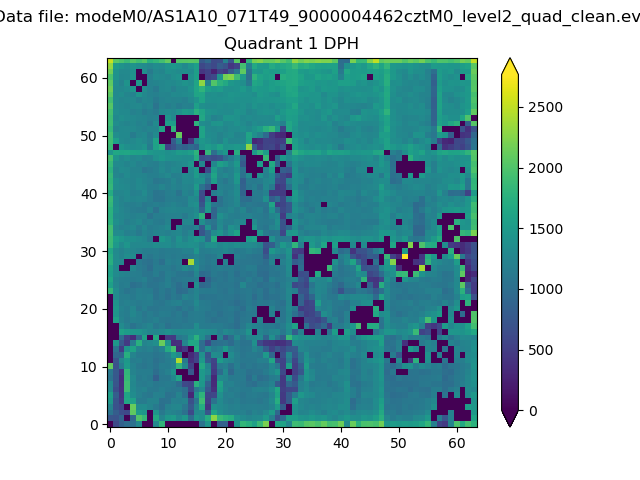 |
Quadrant B |
|---|---|---|---|
| Quadrant D | 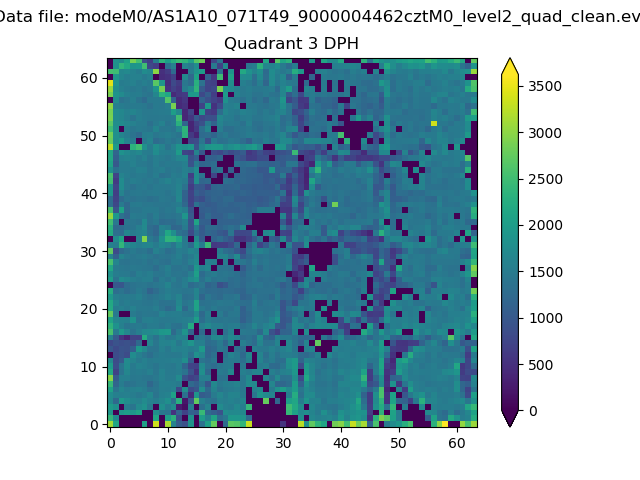 |
 |
Quadrant C |
| Plot type | Count rate plots | Images |
|---|---|---|
| Comparison with Poisson distribution Blue bars denote a histogram of data divided into 1 sec bins. Red curve is a Poisson curve with rate = median count rate of data. |
 |
 |
| Quadrant-wise count rates Data is divided into 100 sec bins |
 |
|
| Module-wise count rates for Quadrant A Data is divided into 100 sec bins |
 |
 |
| Module-wise count rates for Quadrant B Data is divided into 100 sec bins |
 |
 |
| Module-wise count rates for Quadrant C Data is divided into 100 sec bins |
 |
 |
| Module-wise count rates for Quadrant D Data is divided into 100 sec bins |
 |
 |
| Parameter | Plot |
|---|---|
| CZT HV Monitor |  |
| D_VDD |  |
| Temperature 1 |  |
| Veto HV Monitor |  |
| Veto LLD |  |
| Alpha Counter | 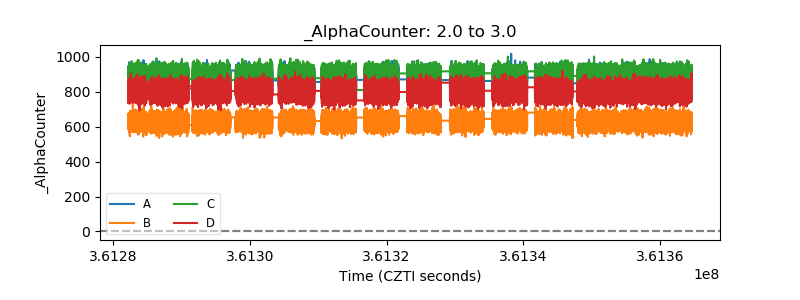 |
| _CPM_Rate | 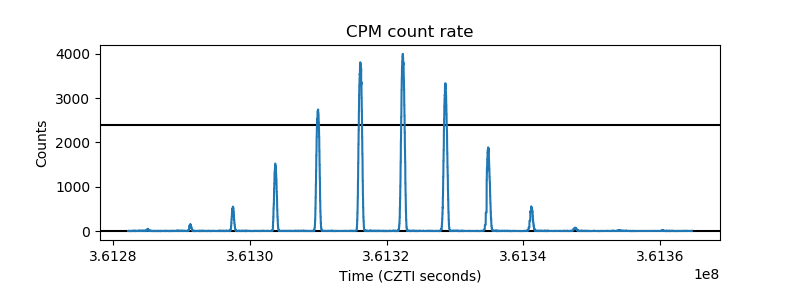 |
| CZT Counter |  |
| +2.5 Volts monitor |  |
| +5 Volts monitor |  |
| _ROLL_ROT | 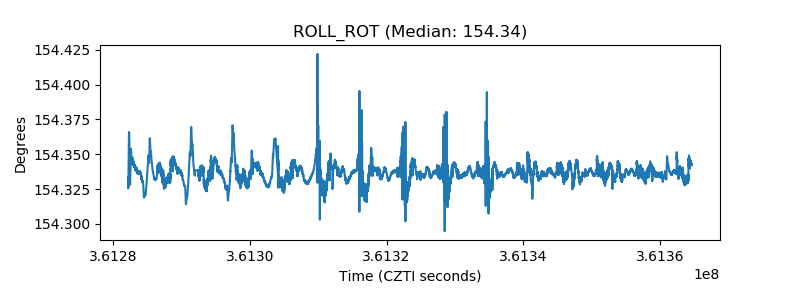 |
| _Roll_DEC |  |
| _Roll_RA |  |
| Veto Counter |  |