| Param | Original file | Final file |
|---|---|---|
| Filename | modeM0/AS1A10_071T49_9000004462_30869cztM0_level2.evt | modeM0/AS1A10_071T49_9000004462_30869cztM0_level2_quad_clean.evt |
| Size (bytes) | 1,643,319,360 | 184,999,680 |
| Size | 1.5 GB | 176.4 MB |
| Events in quadrant A | 7,467,047 | 1,190,019 |
| Events in quadrant B | 23,857,083 | 1,084,858 |
| Events in quadrant C | 8,086,770 | 1,134,887 |
| Events in quadrant D | 9,315,098 | 1,123,182 |
| Mode SS | |||
|---|---|---|---|
| Quadrant | BADHDUFLAG | Total packets | Discarded packets |
| A | 0 | 316 | 0 |
| B | 0 | 316 | 0 |
| C | 0 | 316 | 0 |
| D | 0 | 316 | 0 |
| Mode M0 | |||
|---|---|---|---|
| Quadrant | BADHDUFLAG | Total packets | Discarded packets |
| A | 0 | 32184 | 3 |
| B | 0 | 81595 | 3 |
| C | 0 | 33909 | 4 |
| D | 0 | 37645 | 3 |
| Mode M9 | |||
|---|---|---|---|
| Quadrant | BADHDUFLAG | Total packets | Discarded packets |
| A | 0 | 18 | 0 |
| B | 0 | 18 | 0 |
| C | 0 | 18 | 0 |
| D | 0 | 18 | 0 |
| Quadrant | Total seconds | Saturated seconds | Saturation percentage |
|---|---|---|---|
| A | 15492 | 242 | 1.562097% |
| B | 15492 | 4705 | 30.370514% |
| C | 15491 | 400 | 2.582144% |
| D | 15491 | 332 | 2.143180% |
Noise dominated data is calculated using 1-second bins in cleaned event files. If a bin has >2000 counts, and if more than 50% of those come from <1% of pixels, then it is considered to be noise-dominated and hence unusable.
| Quadrant | # 1 sec bins | Bins with >0 counts | Bins with >2000 counts | High rate bins dominated by noise | Noise dominated (total time) | Noise dominated (detector-on time) | Marked lightcurve |
|---|---|---|---|---|---|---|---|
| A | 17287 | 15492 | 9 | 9 | 0.05% | 0.06% | 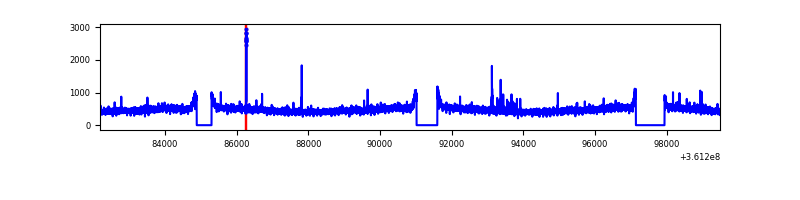 |
| B | 17287 | 15492 | 2011 | 2011 | 11.63% | 12.98% | 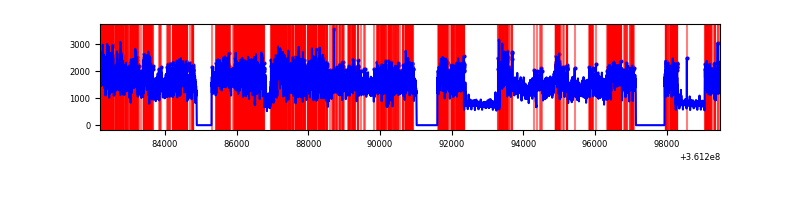 |
| C | 17286 | 15492 | 19 | 19 | 0.11% | 0.12% | 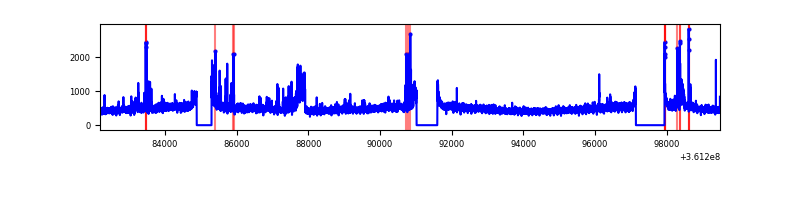 |
| D | 17286 | 15491 | 184 | 184 | 1.06% | 1.19% | 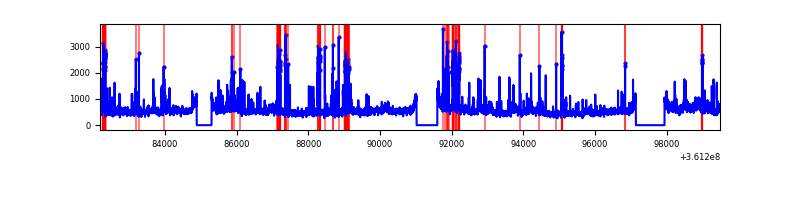 |
Top three noisy pixels from each quadrant. If the there are fewer than three noisy pixels in the level2.evt file, extra rows are filled as -1
| Pixel properties | Quadrant properties | ||||||
|---|---|---|---|---|---|---|---|
| Quadrant | DetID | PixID | Counts | Sigma | Mean | Median | Sigma |
| A | 0 | 13 | 98456 | 251.67 | 1908 | 1867 | 383.8 |
| A | 13 | 254 | 28694 | 69.9 | 1908 | 1867 | 383.8 |
| A | 3 | 137 | 20117 | 47.55 | 1908 | 1867 | 383.8 |
| B | 6 | 36 | 12336556 | 35828.19 | 1776 | 1728 | 344.3 |
| B | 6 | 159 | 4207399 | 12215.94 | 1776 | 1728 | 344.3 |
| B | 5 | 172 | 100499 | 286.89 | 1776 | 1728 | 344.3 |
| C | 2 | 16 | 472204 | 1096.64 | 1824 | 1836 | 428.9 |
| C | 14 | 238 | 292317 | 677.24 | 1824 | 1836 | 428.9 |
| C | 0 | 10 | 85812 | 195.79 | 1824 | 1836 | 428.9 |
| D | 8 | 195 | 1409077 | 3230.31 | 1840 | 1797 | 435.6 |
| D | 12 | 233 | 253099 | 576.85 | 1840 | 1797 | 435.6 |
| D | 7 | 64 | 195117 | 443.75 | 1840 | 1797 | 435.6 |
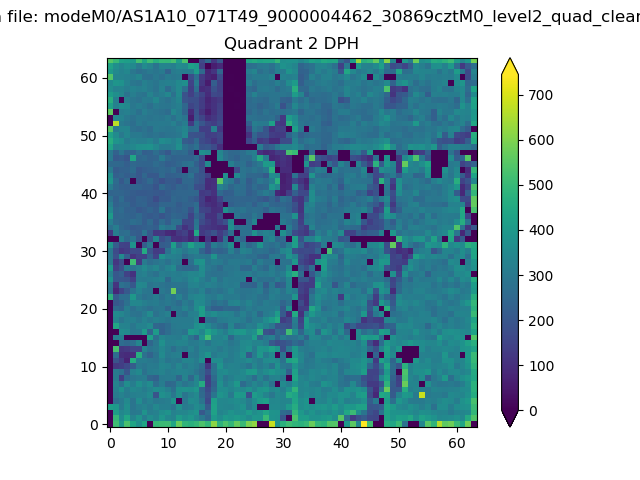
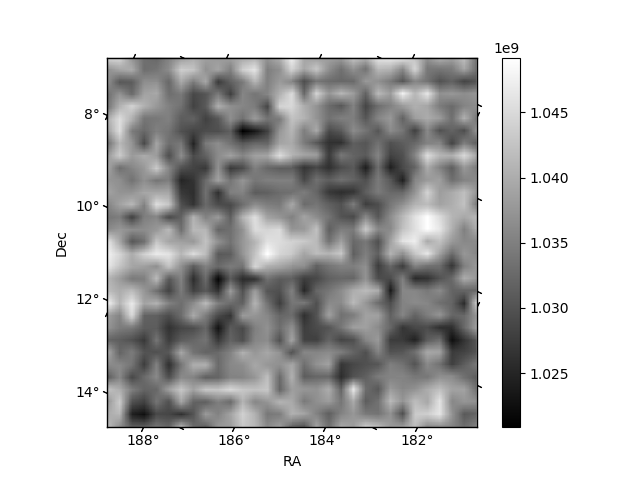
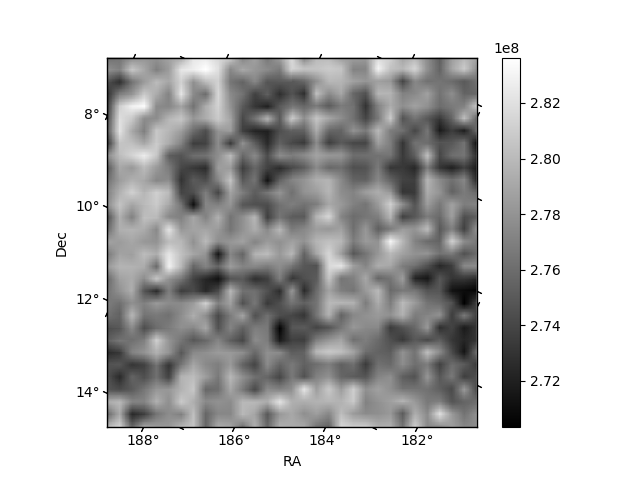
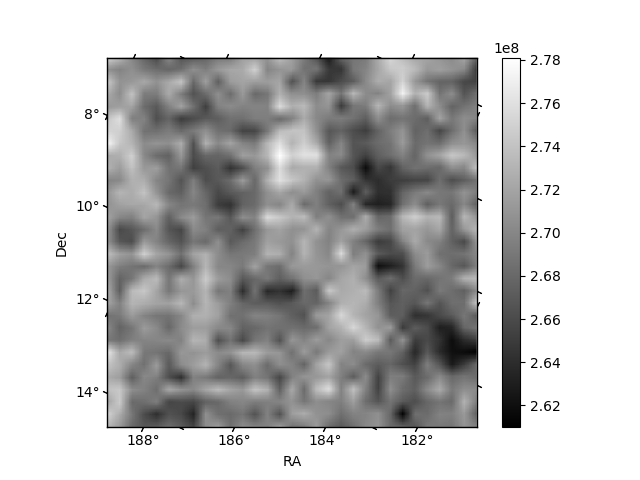
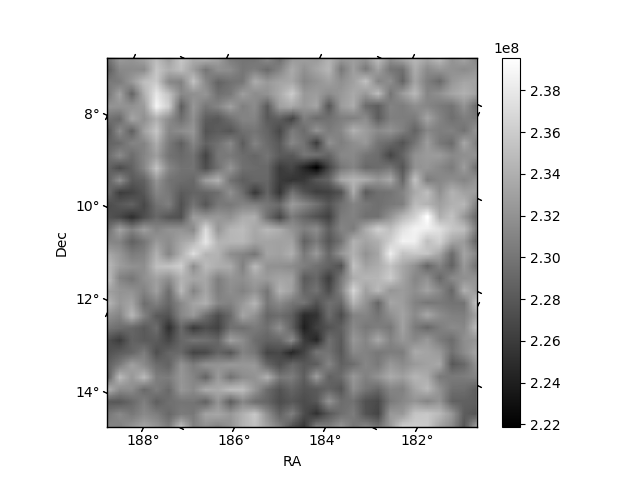
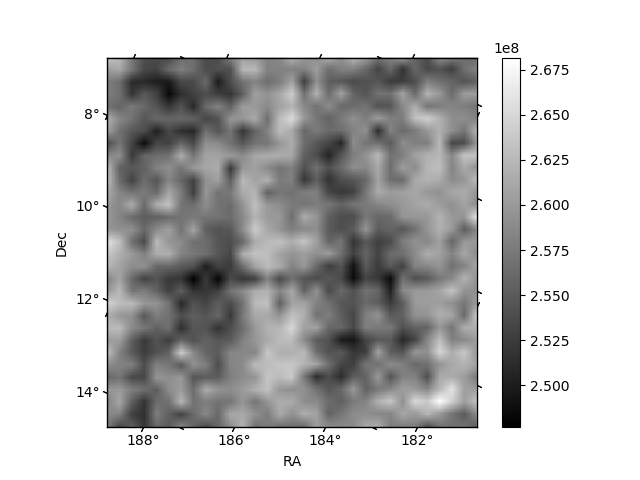
Histogram calculated using DETX and DETY for each event in the final _common_clean file
| Quadrant A | 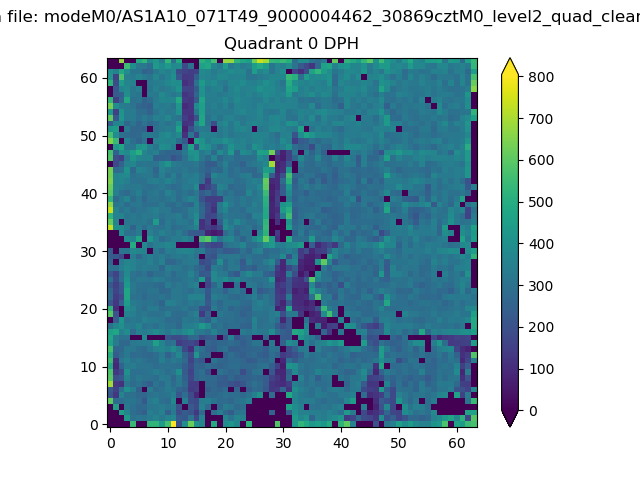 |
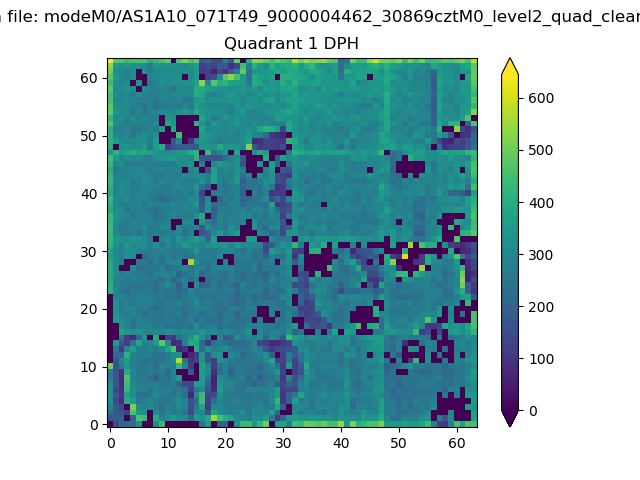 |
Quadrant B |
|---|---|---|---|
| Quadrant D | 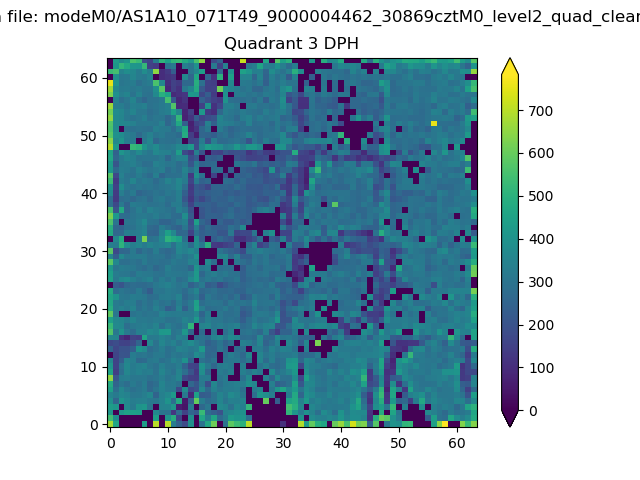 |
 |
Quadrant C |
| Plot type | Count rate plots | Images |
|---|---|---|
| Comparison with Poisson distribution Blue bars denote a histogram of data divided into 1 sec bins. Red curve is a Poisson curve with rate = median count rate of data. |
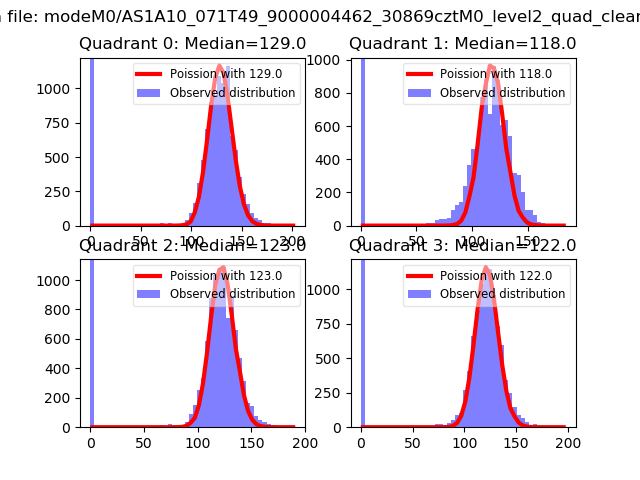 |
 |
| Quadrant-wise count rates Data is divided into 100 sec bins |
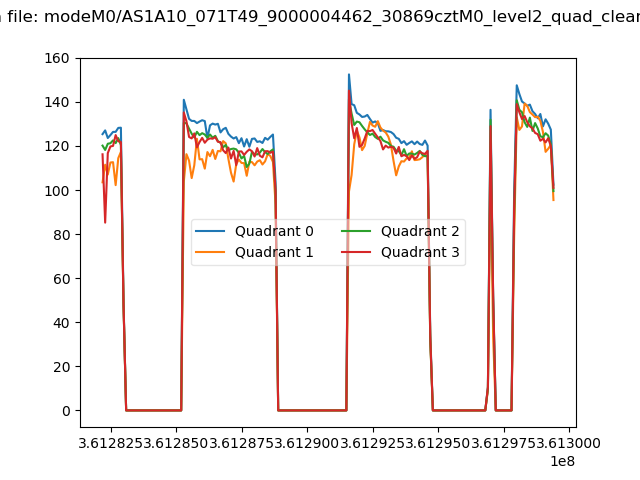 |
|
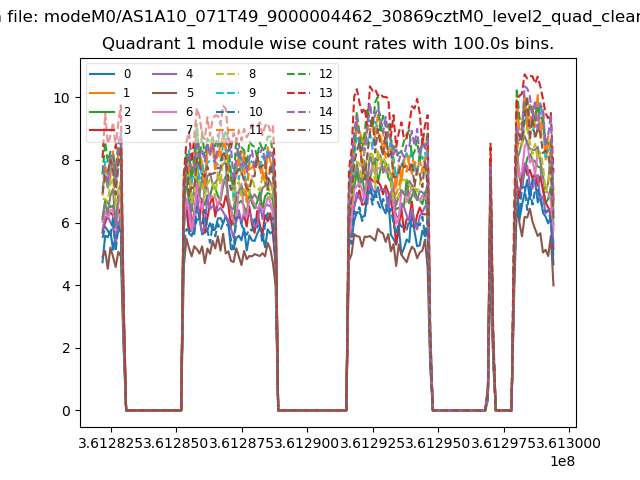
| Module-wise count rates for Quadrant A Data is divided into 100 sec bins |
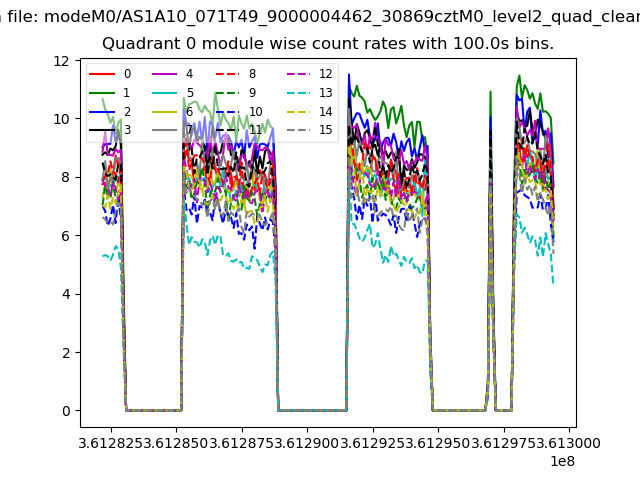 |
 |
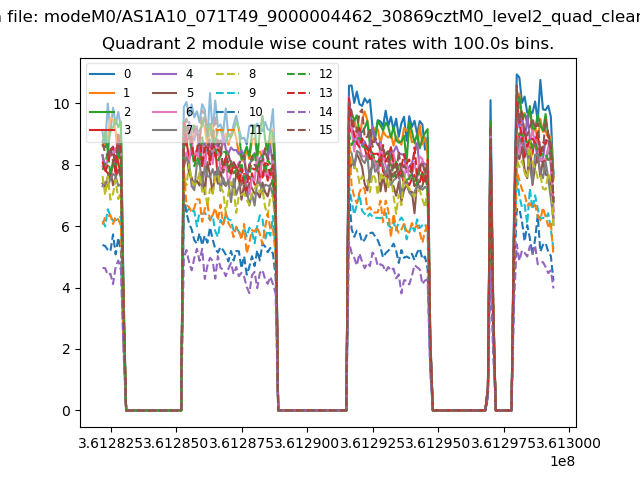
| Module-wise count rates for Quadrant B Data is divided into 100 sec bins |
 |
 |
| Module-wise count rates for Quadrant C Data is divided into 100 sec bins |
 |
 |
| Module-wise count rates for Quadrant D Data is divided into 100 sec bins |
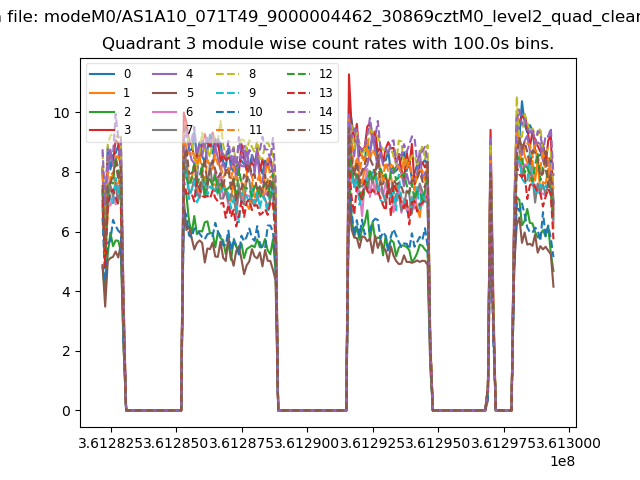 |
 |
| Parameter | Plot |
|---|---|
| CZT HV Monitor | 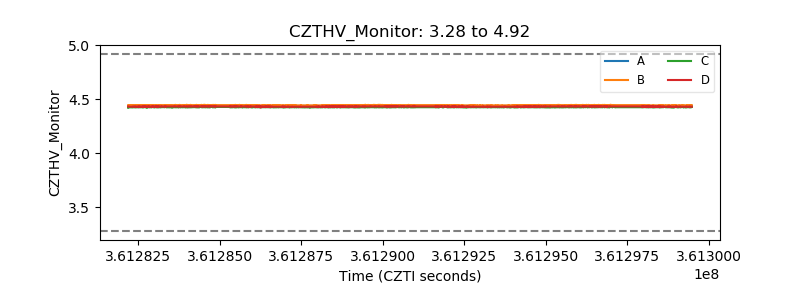 |
| D_VDD | 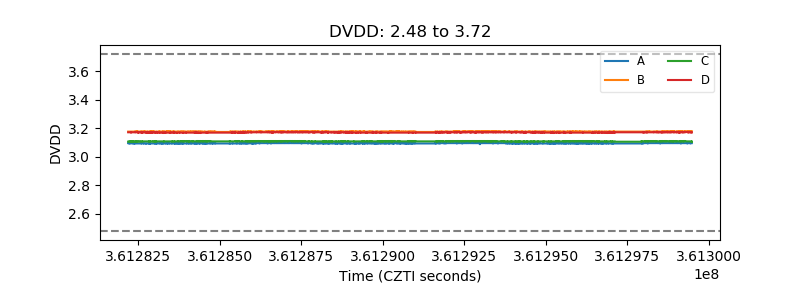 |
| Temperature 1 | 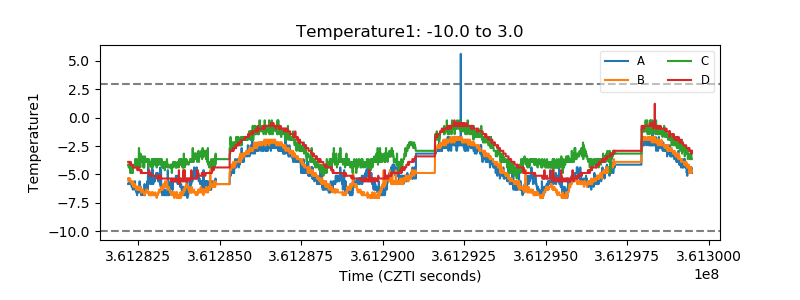 |
| Veto HV Monitor | 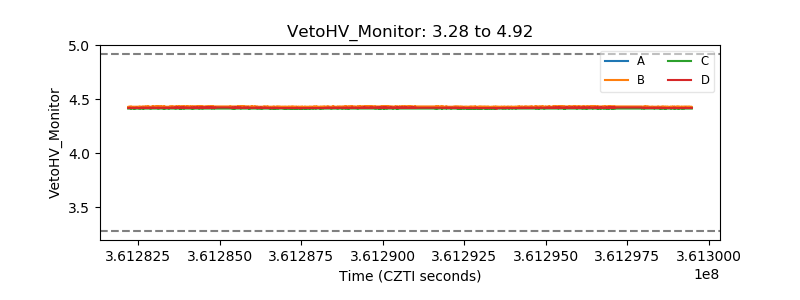 |
| Veto LLD | 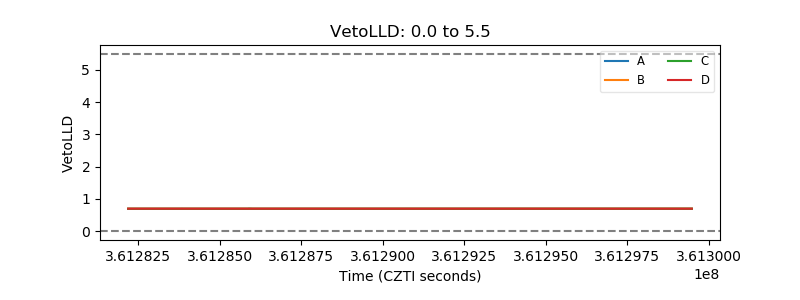 |
| Alpha Counter | 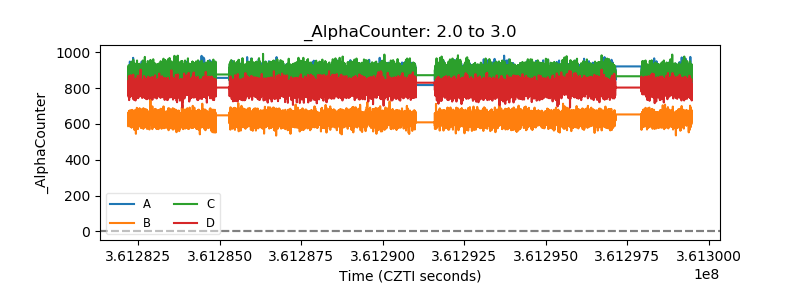 |
| _CPM_Rate | 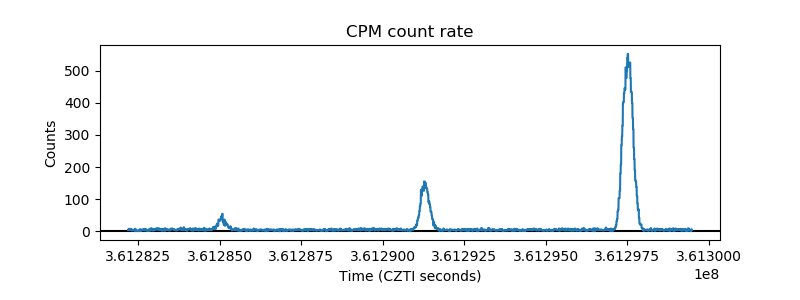 |
| CZT Counter | 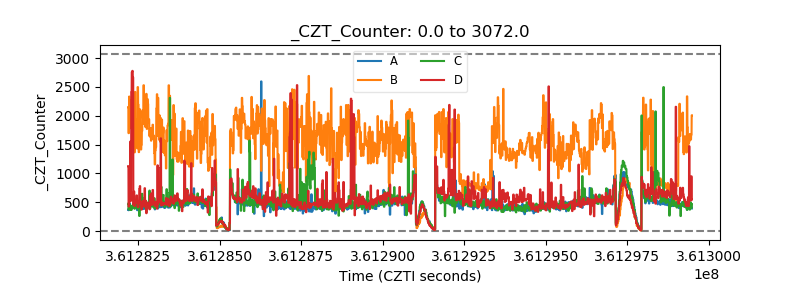 |
| +2.5 Volts monitor |  |
| +5 Volts monitor | 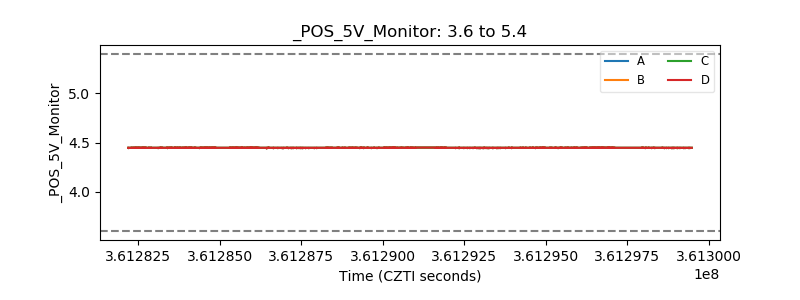 |
| _ROLL_ROT | 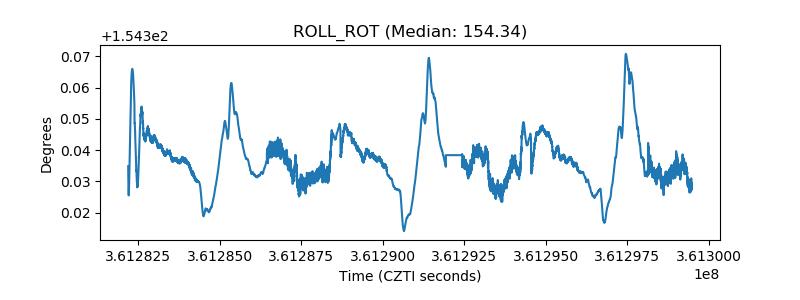 |
| _Roll_DEC | 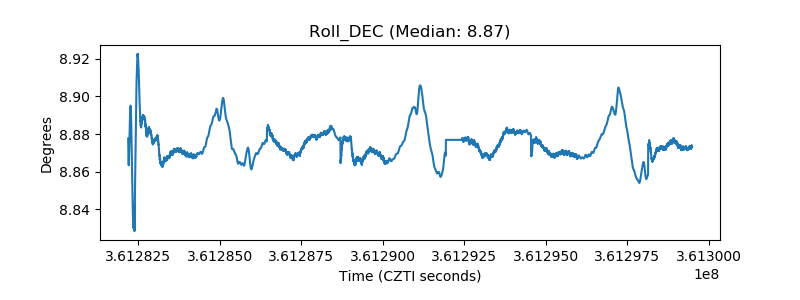 |
| _Roll_RA | 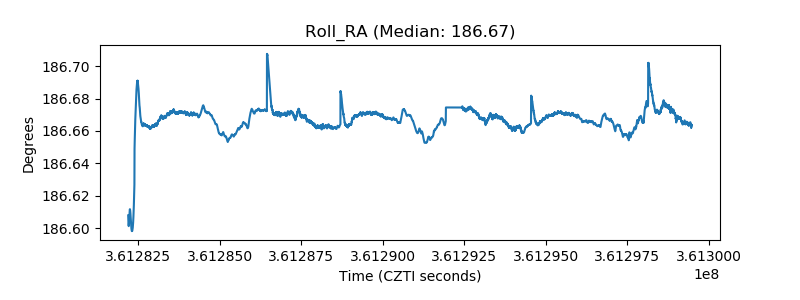 |
| Veto Counter | 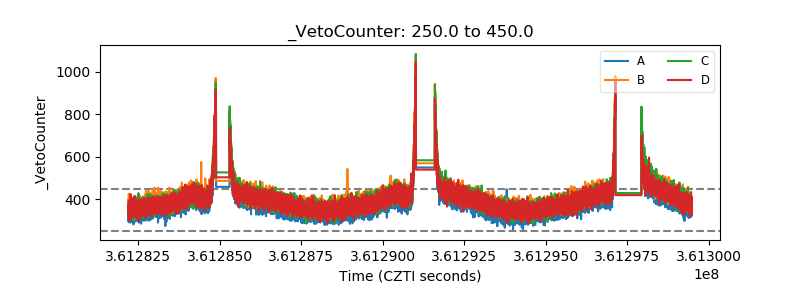 |