| Param | Original file | Final file |
|---|---|---|
| Filename | modeM0/AS1A10_071T49_9000004462_30870cztM0_level2.evt | modeM0/AS1A10_071T49_9000004462_30870cztM0_level2_quad_clean.evt |
| Size (bytes) | 658,080,000 | 84,381,120 |
| Size | 627.6 MB | 80.5 MB |
| Events in quadrant A | 3,498,475 | 540,953 |
| Events in quadrant B | 8,834,063 | 522,260 |
| Events in quadrant C | 3,518,833 | 525,232 |
| Events in quadrant D | 3,648,762 | 522,307 |
| Mode SS | |||
|---|---|---|---|
| Quadrant | BADHDUFLAG | Total packets | Discarded packets |
| A | 0 | 130 | 0 |
| B | 0 | 130 | 0 |
| C | 0 | 130 | 0 |
| D | 0 | 130 | 0 |
| Mode M0 | |||
|---|---|---|---|
| Quadrant | BADHDUFLAG | Total packets | Discarded packets |
| A | 0 | 14620 | 1 |
| B | 0 | 30553 | 1 |
| C | 0 | 14630 | 1 |
| D | 0 | 15092 | 1 |
| Mode M9 | |||
|---|---|---|---|
| Quadrant | BADHDUFLAG | Total packets | Discarded packets |
| A | 0 | 9 | 0 |
| B | 0 | 9 | 0 |
| C | 0 | 9 | 0 |
| D | 0 | 9 | 0 |
| Quadrant | Total seconds | Saturated seconds | Saturation percentage |
|---|---|---|---|
| A | 6362 | 159 | 2.499214% |
| B | 6362 | 1148 | 18.044640% |
| C | 6362 | 141 | 2.216284% |
| D | 6363 | 35 | 0.550055% |
Noise dominated data is calculated using 1-second bins in cleaned event files. If a bin has >2000 counts, and if more than 50% of those come from <1% of pixels, then it is considered to be noise-dominated and hence unusable.
| Quadrant | # 1 sec bins | Bins with >0 counts | Bins with >2000 counts | High rate bins dominated by noise | Noise dominated (total time) | Noise dominated (detector-on time) | Marked lightcurve |
|---|---|---|---|---|---|---|---|
| A | 7332 | 6362 | 120 | 120 | 1.64% | 1.89% |  |
| B | 7332 | 6362 | 340 | 340 | 4.64% | 5.34% | 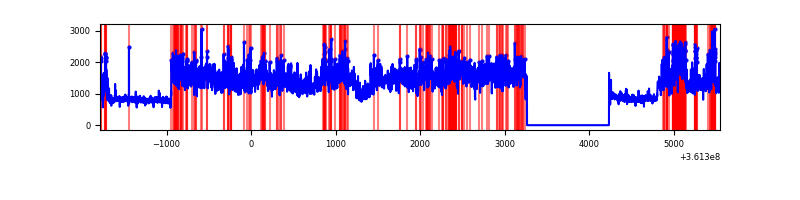 |
| C | 7332 | 6362 | 40 | 40 | 0.55% | 0.63% | 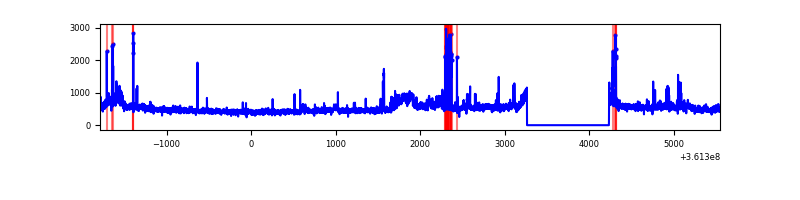 |
| D | 7333 | 6364 | 17 | 17 | 0.23% | 0.27% | 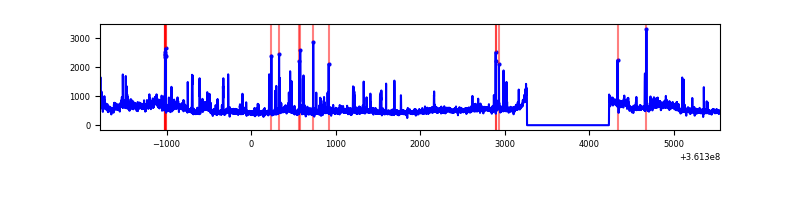 |
Top three noisy pixels from each quadrant. If the there are fewer than three noisy pixels in the level2.evt file, extra rows are filled as -1
| Pixel properties | Quadrant properties | ||||||
|---|---|---|---|---|---|---|---|
| Quadrant | DetID | PixID | Counts | Sigma | Mean | Median | Sigma |
| A | 0 | 13 | 528628 | 3419.3 | 768 | 754 | 154.4 |
| A | 13 | 254 | 12112 | 73.57 | 768 | 754 | 154.4 |
| A | 3 | 137 | 7705 | 45.03 | 768 | 754 | 154.4 |
| B | 6 | 36 | 3912796 | 27302.88 | 745 | 727 | 143.3 |
| B | 6 | 159 | 1798840 | 12549.28 | 745 | 727 | 143.3 |
| B | 5 | 172 | 77455 | 535.5 | 745 | 727 | 143.3 |
| C | 0 | 10 | 365389 | 2088.4 | 739 | 742 | 174.6 |
| C | 14 | 238 | 119610 | 680.78 | 739 | 742 | 174.6 |
| C | 3 | 233 | 73047 | 414.1 | 739 | 742 | 174.6 |
| D | 8 | 195 | 633543 | 3540.26 | 749 | 732 | 178.7 |
| D | 2 | 250 | 74216 | 411.11 | 749 | 732 | 178.7 |
| D | 2 | 120 | 36219 | 198.53 | 749 | 732 | 178.7 |
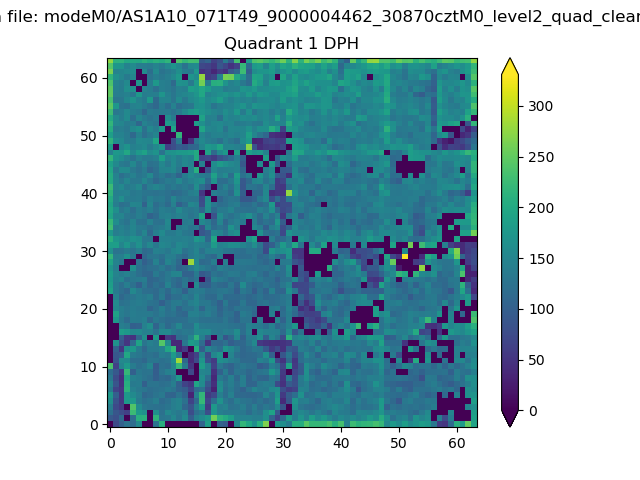
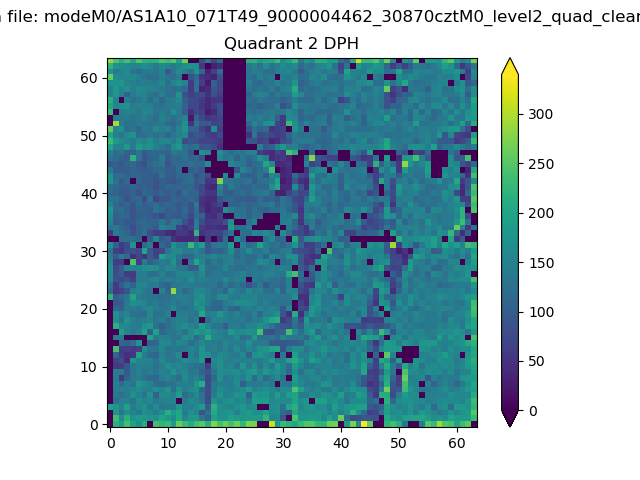
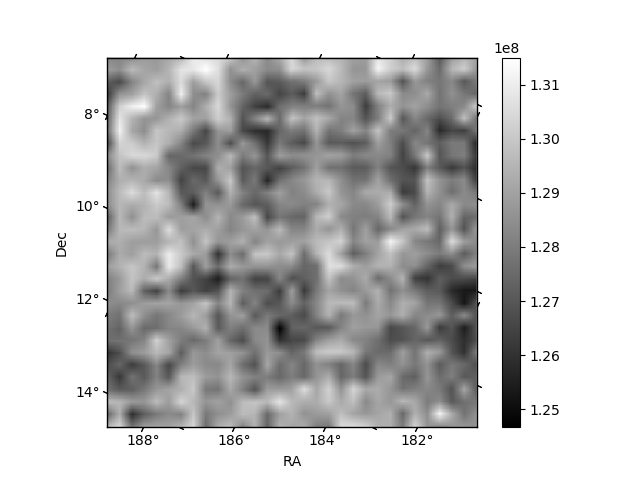
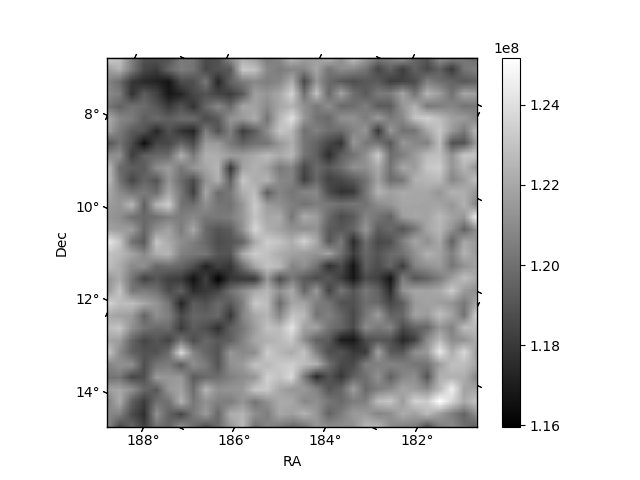
Histogram calculated using DETX and DETY for each event in the final _common_clean file
| Quadrant A | 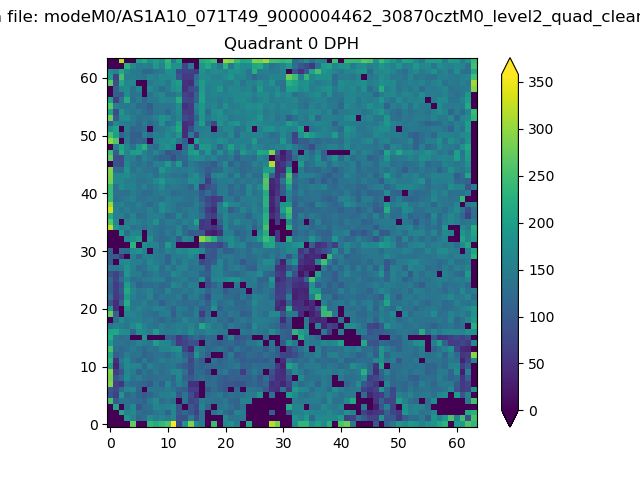 |
 |
Quadrant B |
|---|---|---|---|
| Quadrant D | 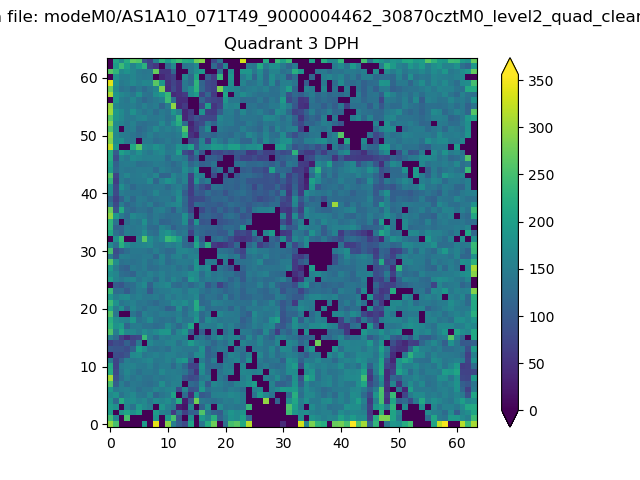 |
 |
Quadrant C |
| Plot type | Count rate plots | Images |
|---|---|---|
| Comparison with Poisson distribution Blue bars denote a histogram of data divided into 1 sec bins. Red curve is a Poisson curve with rate = median count rate of data. |
 |
 |
| Quadrant-wise count rates Data is divided into 100 sec bins |
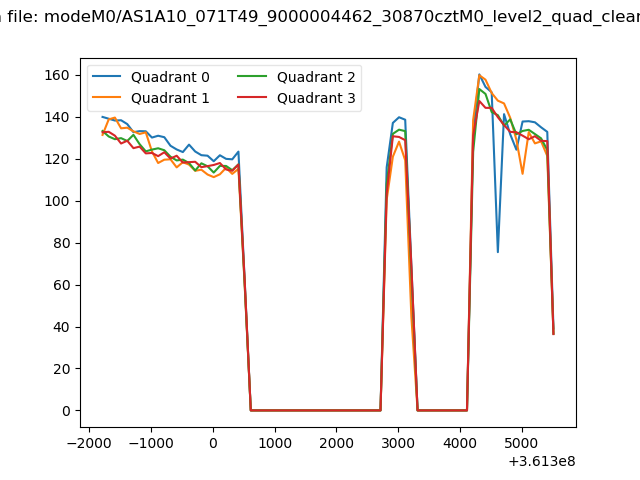 |
|
| Module-wise count rates for Quadrant A Data is divided into 100 sec bins |
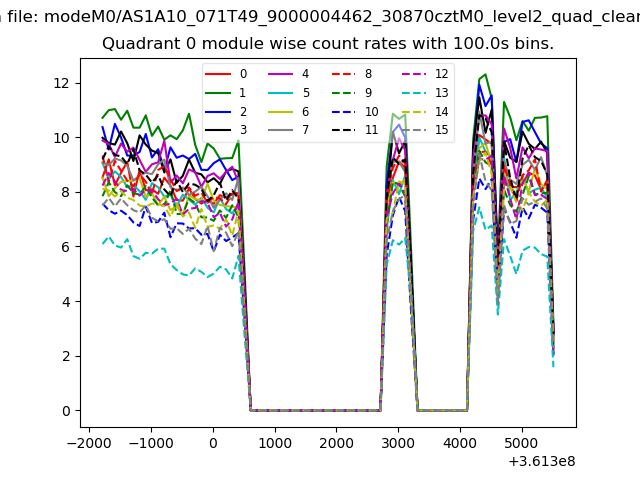 |
 |
| Module-wise count rates for Quadrant B Data is divided into 100 sec bins |
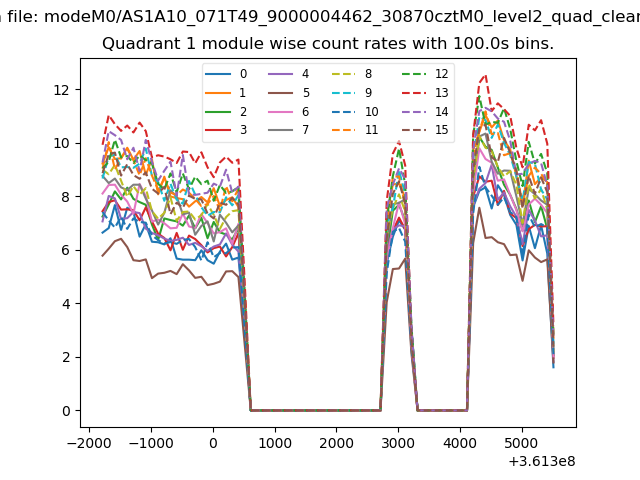 |
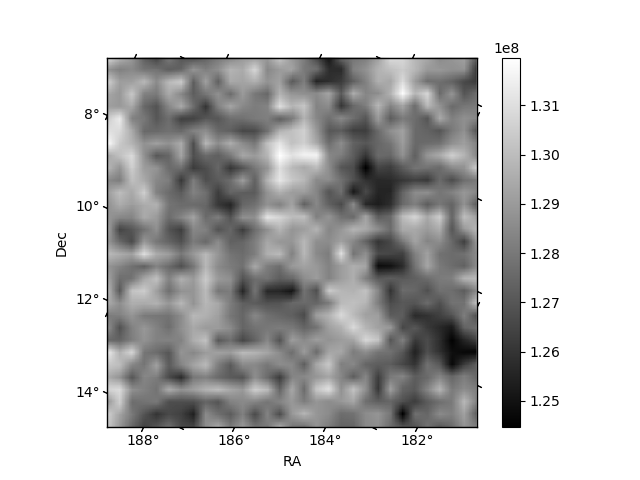 |
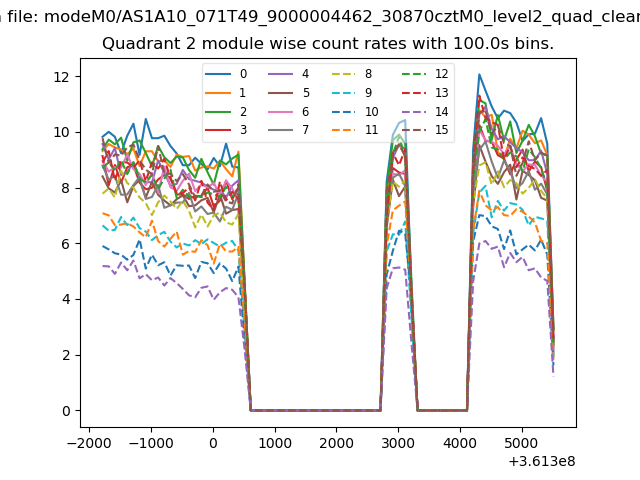
| Module-wise count rates for Quadrant C Data is divided into 100 sec bins |
 |
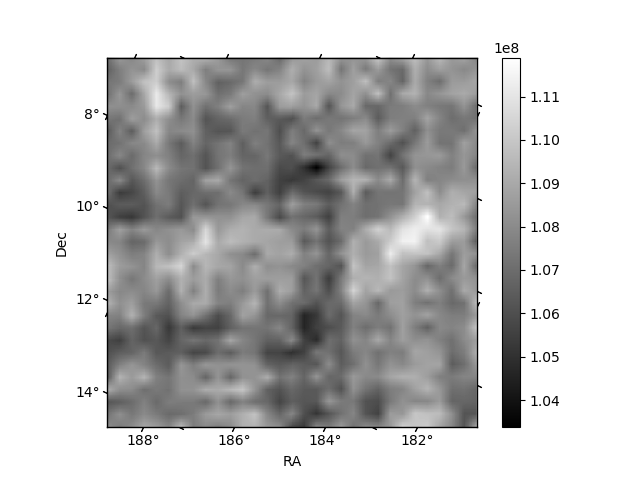 |
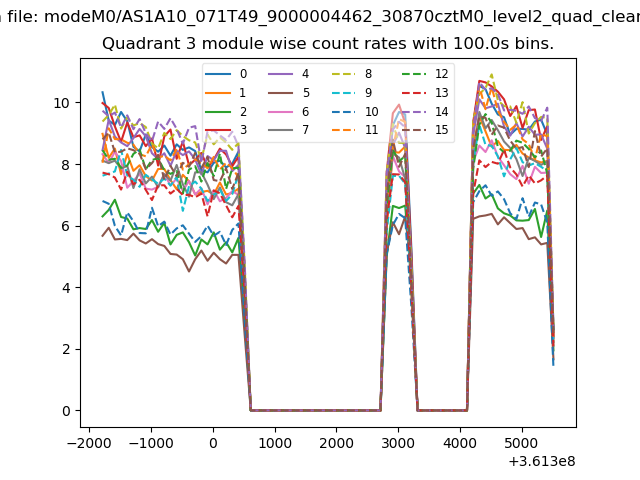
| Module-wise count rates for Quadrant D Data is divided into 100 sec bins |
 |
 |
| Parameter | Plot |
|---|---|
| CZT HV Monitor | 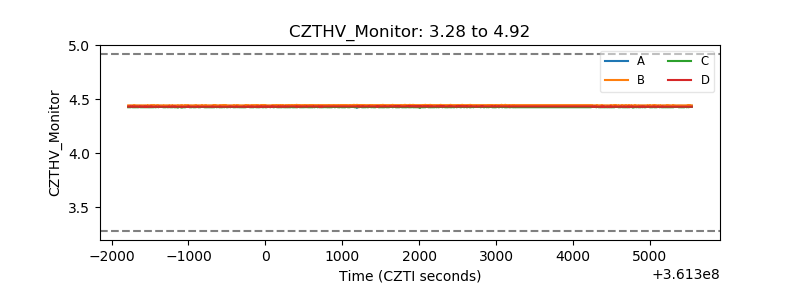 |
| D_VDD | 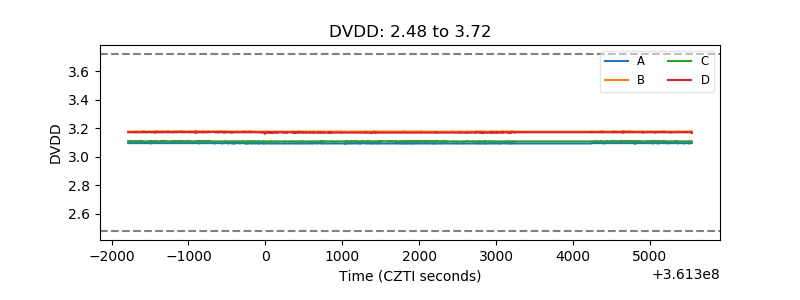 |
| Temperature 1 | 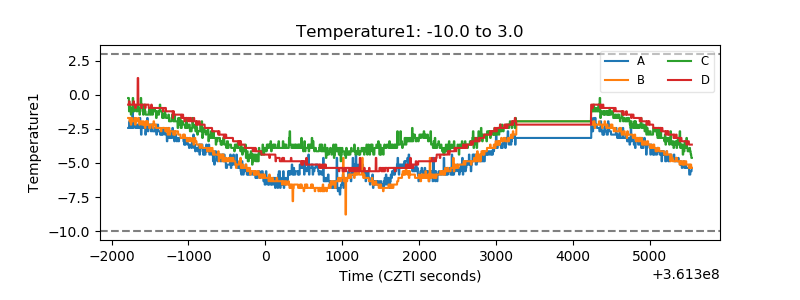 |
| Veto HV Monitor | 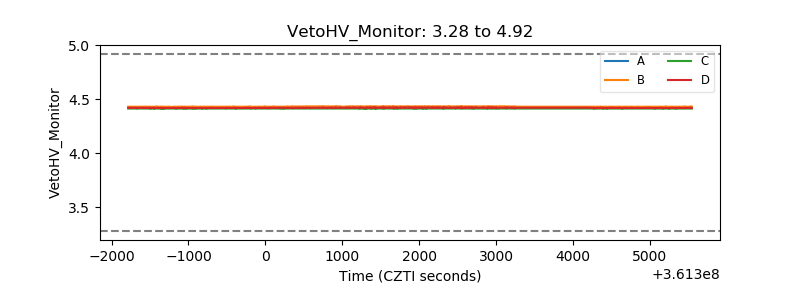 |
| Veto LLD | 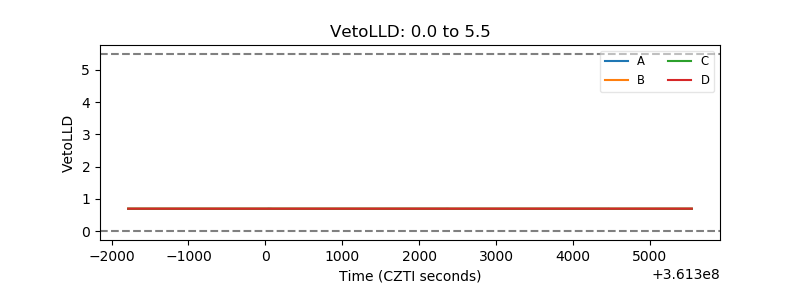 |
| Alpha Counter | 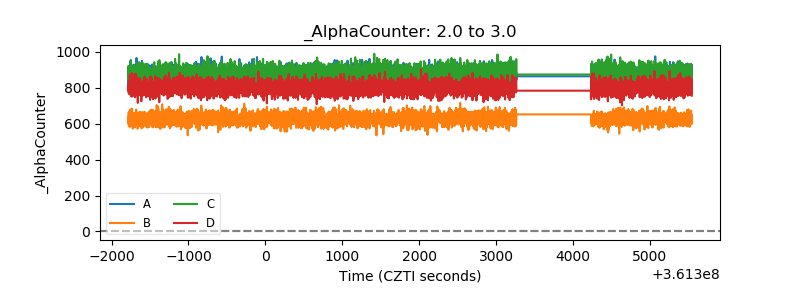 |
| _CPM_Rate | 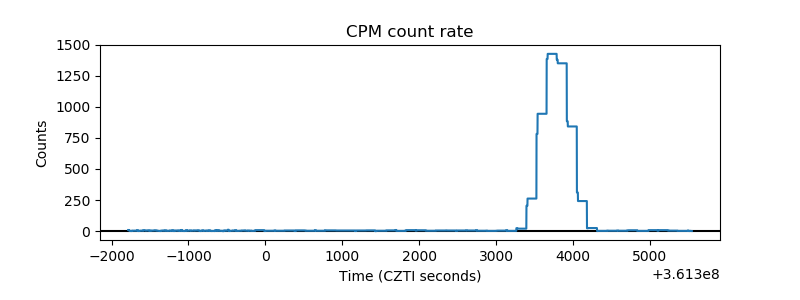 |
| CZT Counter | 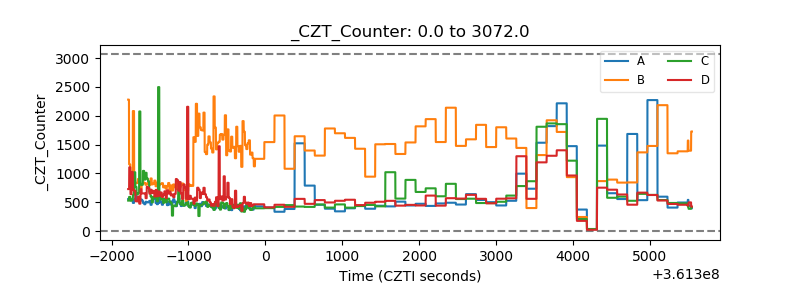 |
| +2.5 Volts monitor |  |
| +5 Volts monitor |  |
| _ROLL_ROT |  |
| _Roll_DEC | 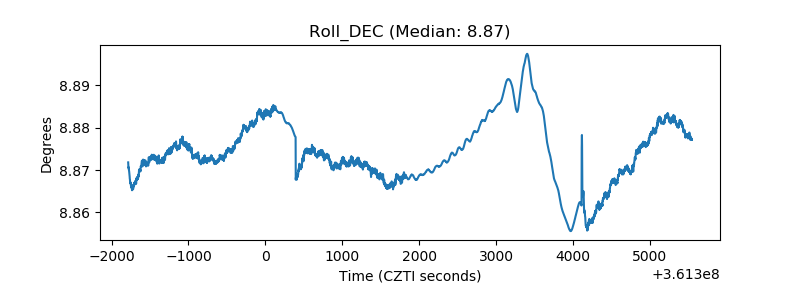 |
| _Roll_RA | 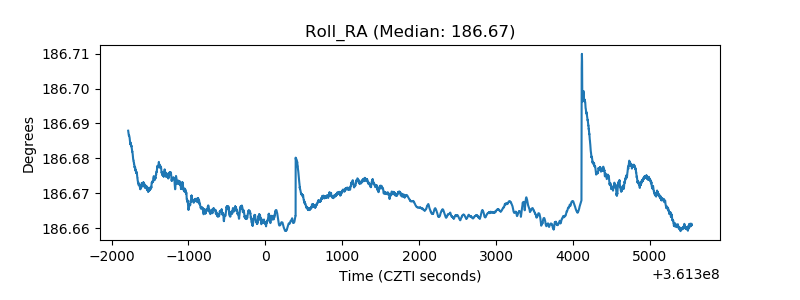 |
| Veto Counter | 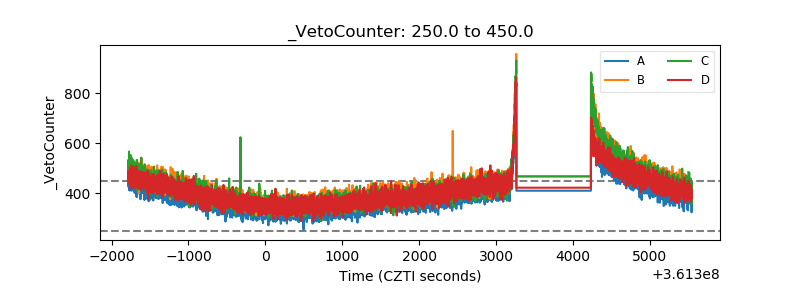 |