| Param | Original file | Final file |
|---|---|---|
| Filename | modeM0/AS1A10_071T49_9000004462_30873cztM0_level2.evt | modeM0/AS1A10_071T49_9000004462_30873cztM0_level2_quad_clean.evt |
| Size (bytes) | 637,384,320 | 92,600,640 |
| Size | 607.9 MB | 88.3 MB |
| Events in quadrant A | 3,179,095 | 616,731 |
| Events in quadrant B | 7,663,288 | 607,051 |
| Events in quadrant C | 3,355,254 | 588,333 |
| Events in quadrant D | 4,684,720 | 556,697 |
| Mode SS | |||
|---|---|---|---|
| Quadrant | BADHDUFLAG | Total packets | Discarded packets |
| A | 0 | 126 | 0 |
| B | 0 | 126 | 0 |
| C | 0 | 126 | 0 |
| D | 0 | 126 | 0 |
| Mode M0 | |||
|---|---|---|---|
| Quadrant | BADHDUFLAG | Total packets | Discarded packets |
| A | 0 | 13283 | 2 |
| B | 0 | 27122 | 2 |
| C | 0 | 13913 | 3 |
| D | 0 | 18040 | 2 |
| Mode M9 | |||
|---|---|---|---|
| Quadrant | BADHDUFLAG | Total packets | Discarded packets |
| A | 0 | 22 | 0 |
| B | 0 | 23 | 0 |
| C | 0 | 23 | 0 |
| D | 0 | 23 | 0 |
| Quadrant | Total seconds | Saturated seconds | Saturation percentage |
|---|---|---|---|
| A | 6242 | 33 | 0.528677% |
| B | 6242 | 337 | 5.398911% |
| C | 6241 | 70 | 1.121615% |
| D | 6241 | 285 | 4.566576% |
Noise dominated data is calculated using 1-second bins in cleaned event files. If a bin has >2000 counts, and if more than 50% of those come from <1% of pixels, then it is considered to be noise-dominated and hence unusable.
| Quadrant | # 1 sec bins | Bins with >0 counts | Bins with >2000 counts | High rate bins dominated by noise | Noise dominated (total time) | Noise dominated (detector-on time) | Marked lightcurve |
|---|---|---|---|---|---|---|---|
| A | 7482 | 6243 | 12 | 12 | 0.16% | 0.19% | 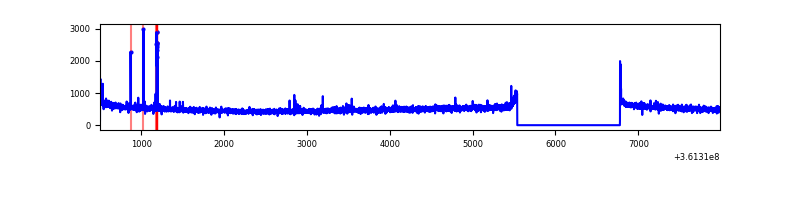 |
| B | 7482 | 6242 | 84 | 84 | 1.12% | 1.35% | 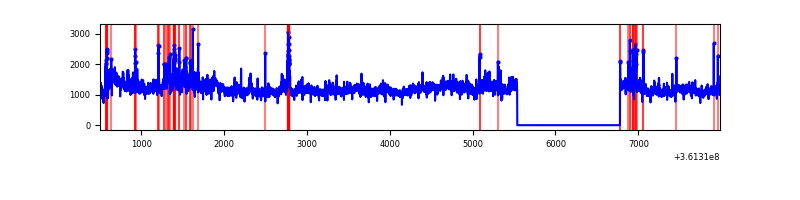 |
| C | 7481 | 6242 | 4 | 4 | 0.05% | 0.06% | 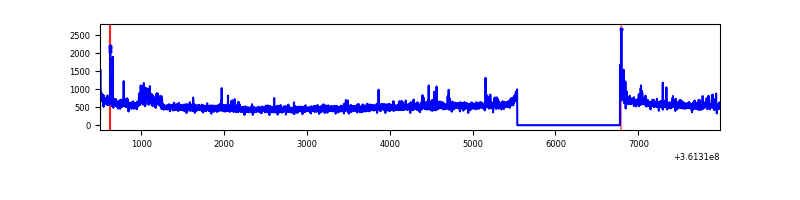 |
| D | 7481 | 6241 | 258 | 258 | 3.45% | 4.13% | 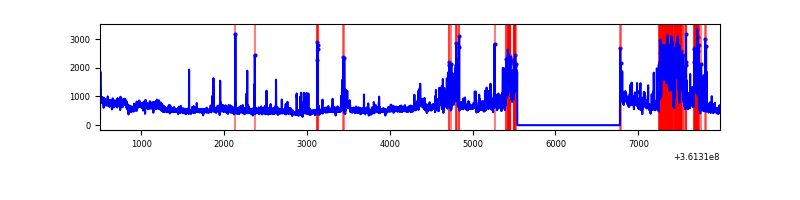 |
Top three noisy pixels from each quadrant. If the there are fewer than three noisy pixels in the level2.evt file, extra rows are filled as -1
| Pixel properties | Quadrant properties | ||||||
|---|---|---|---|---|---|---|---|
| Quadrant | DetID | PixID | Counts | Sigma | Mean | Median | Sigma |
| A | 0 | 13 | 42985 | 263.63 | 808 | 794 | 160.0 |
| A | 0 | 31 | 11847 | 69.06 | 808 | 794 | 160.0 |
| A | 13 | 254 | 11834 | 68.98 | 808 | 794 | 160.0 |
| B | 6 | 36 | 2465460 | 16208.28 | 799 | 779 | 152.1 |
| B | 6 | 159 | 1788554 | 11756.8 | 799 | 779 | 152.1 |
| B | 5 | 172 | 87440 | 569.9 | 799 | 779 | 152.1 |
| C | 14 | 238 | 126737 | 697.66 | 774 | 781 | 180.5 |
| C | 8 | 229 | 74405 | 407.8 | 774 | 781 | 180.5 |
| C | 2 | 16 | 50485 | 275.31 | 774 | 781 | 180.5 |
| D | 12 | 233 | 707174 | 3948.84 | 758 | 742 | 178.9 |
| D | 8 | 195 | 516414 | 2882.52 | 758 | 742 | 178.9 |
| D | 1 | 52 | 426603 | 2380.49 | 758 | 742 | 178.9 |
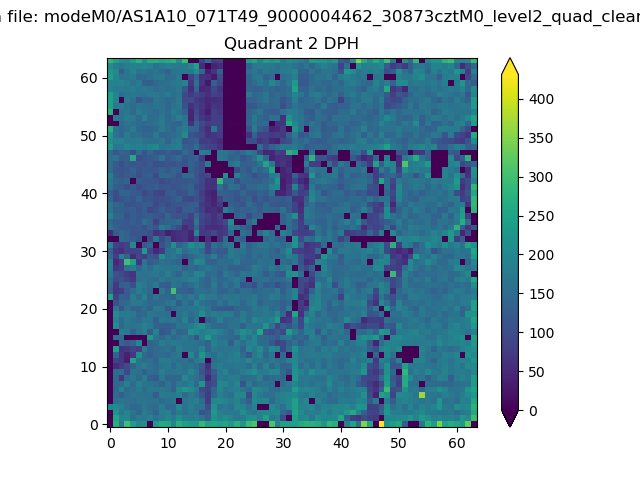
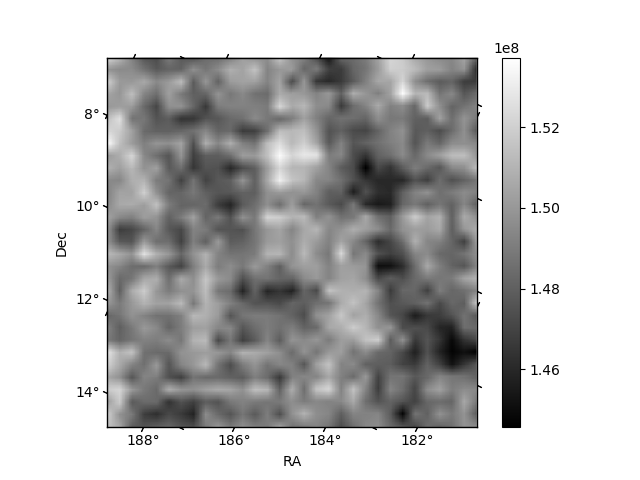
Histogram calculated using DETX and DETY for each event in the final _common_clean file
| Quadrant A | 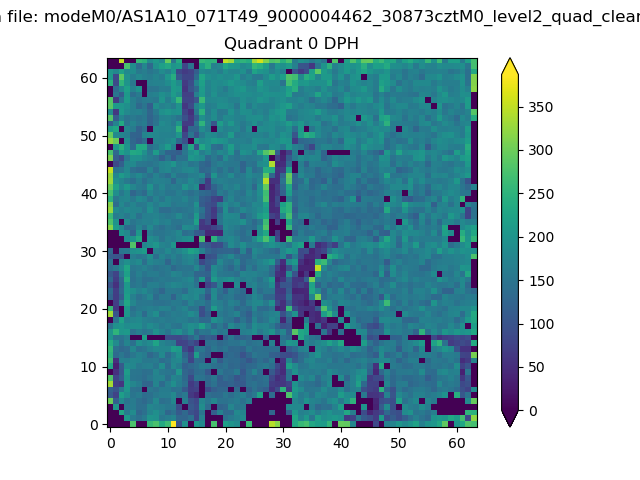 |
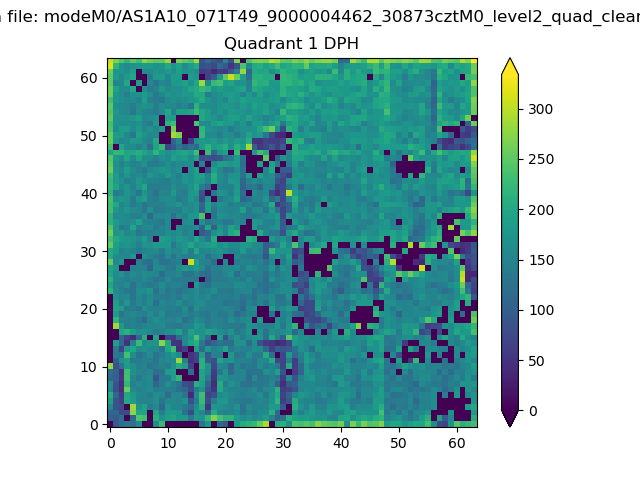 |
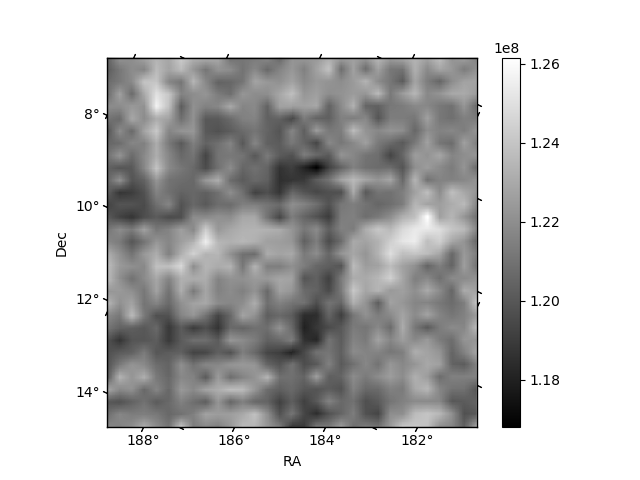
Quadrant B |
|---|---|---|---|
| Quadrant D | 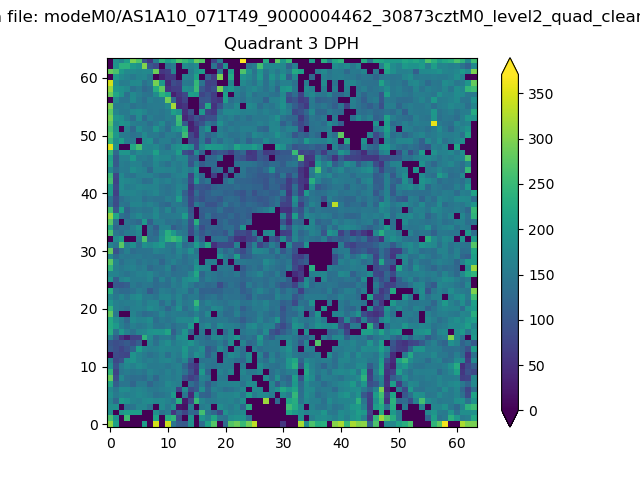 |
 |
Quadrant C |
| Plot type | Count rate plots | Images |
|---|---|---|
| Comparison with Poisson distribution Blue bars denote a histogram of data divided into 1 sec bins. Red curve is a Poisson curve with rate = median count rate of data. |
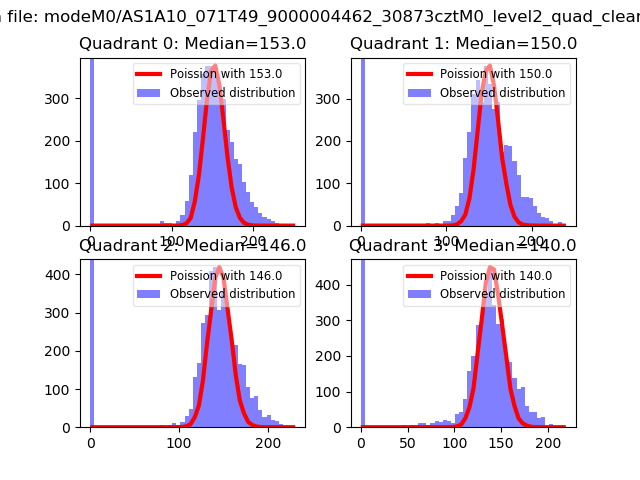 |
 |
| Quadrant-wise count rates Data is divided into 100 sec bins |
 |
|
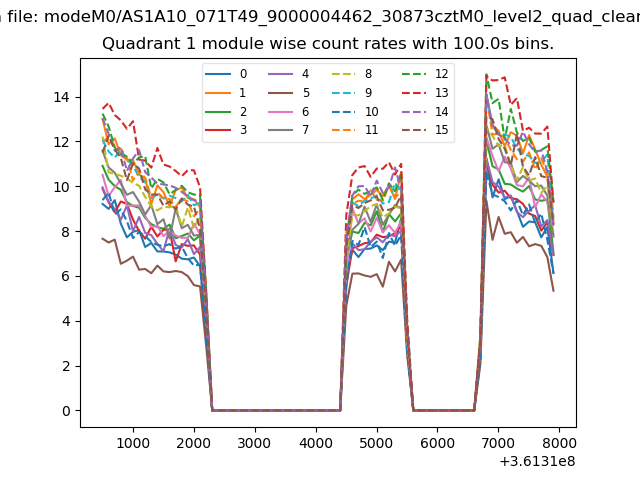
| Module-wise count rates for Quadrant A Data is divided into 100 sec bins |
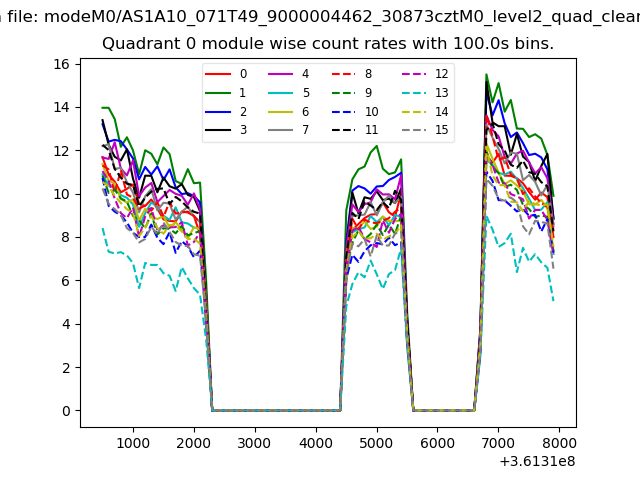 |
 |
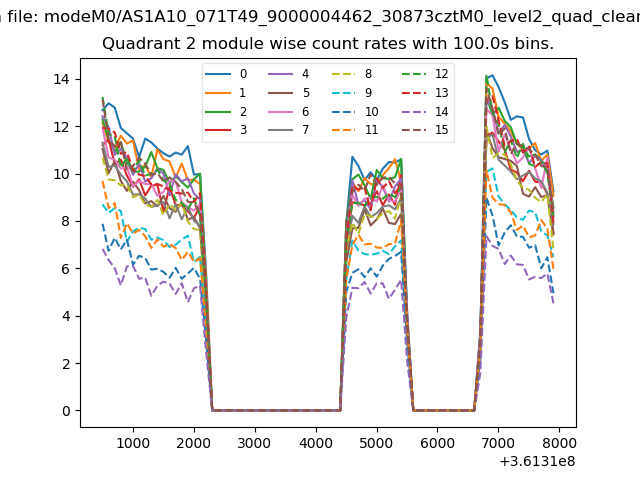
| Module-wise count rates for Quadrant B Data is divided into 100 sec bins |
 |
 |
| Module-wise count rates for Quadrant C Data is divided into 100 sec bins |
 |
 |
| Module-wise count rates for Quadrant D Data is divided into 100 sec bins |
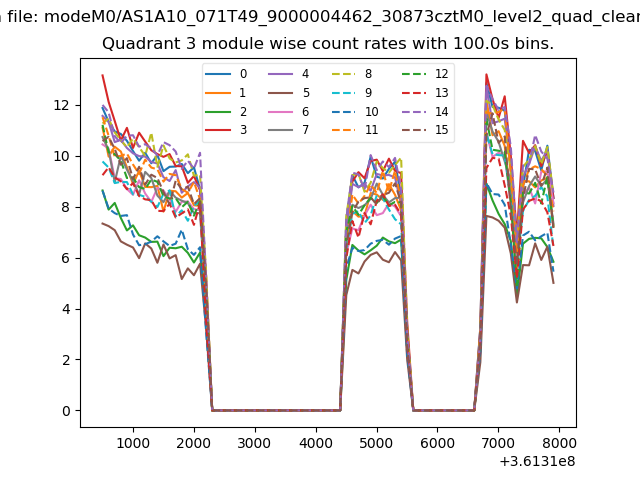 |
 |
| Parameter | Plot |
|---|---|
| CZT HV Monitor | 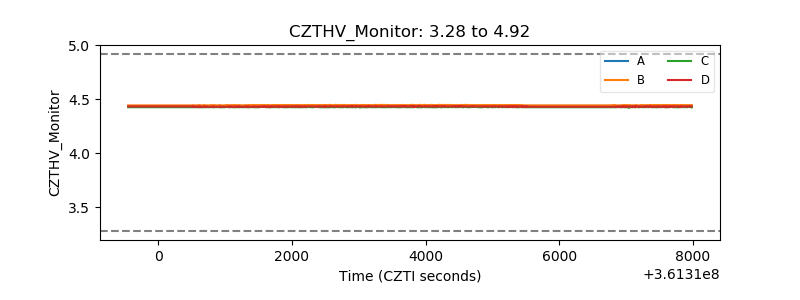 |
| D_VDD | 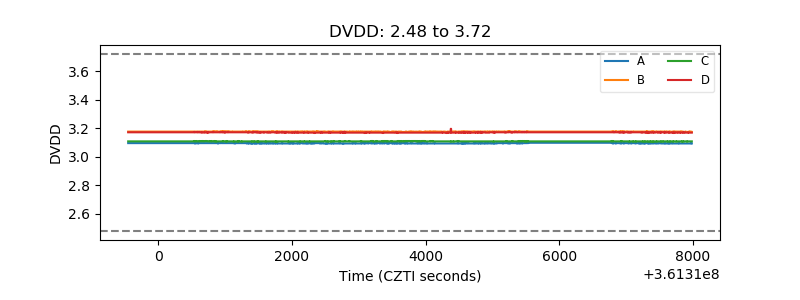 |
| Temperature 1 | 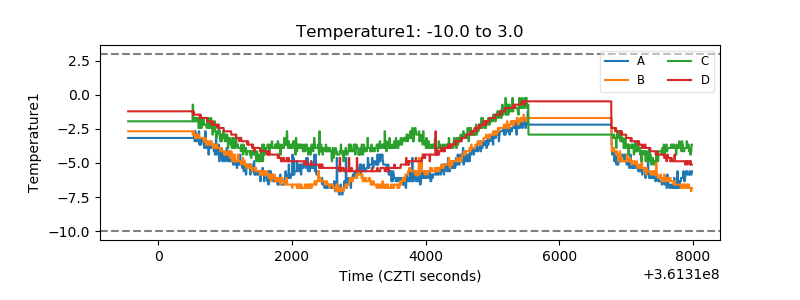 |
| Veto HV Monitor | 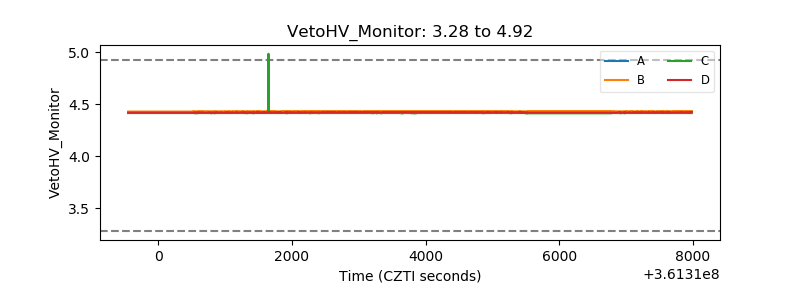 |
| Veto LLD | 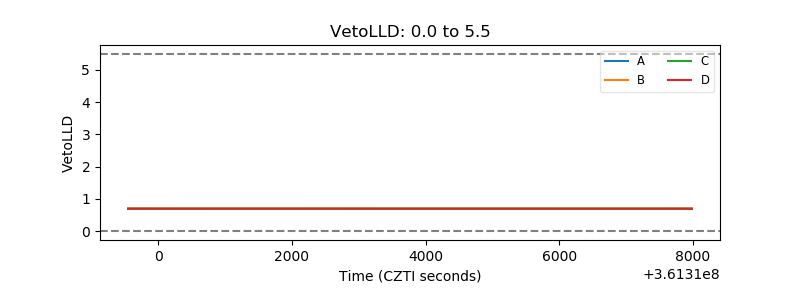 |
| Alpha Counter | 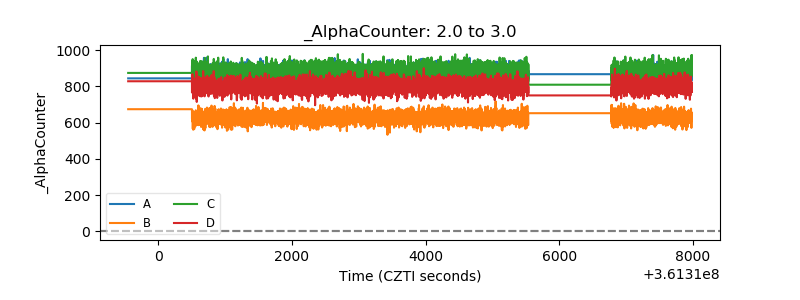 |
| _CPM_Rate | 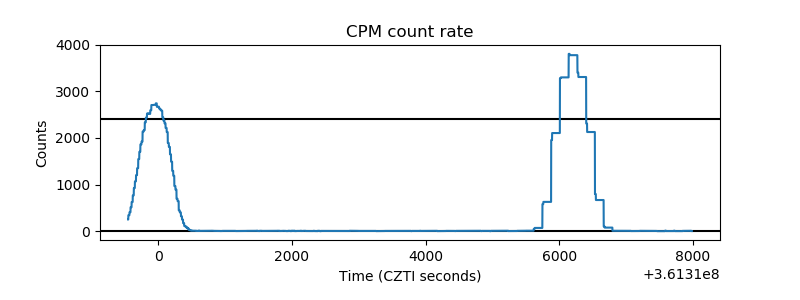 |
| CZT Counter | 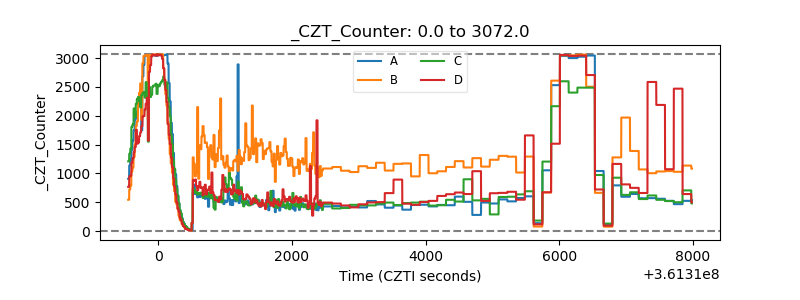 |
| +2.5 Volts monitor |  |
| +5 Volts monitor | 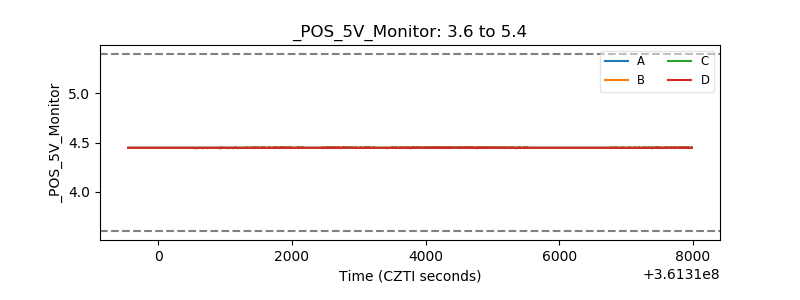 |
| _ROLL_ROT | 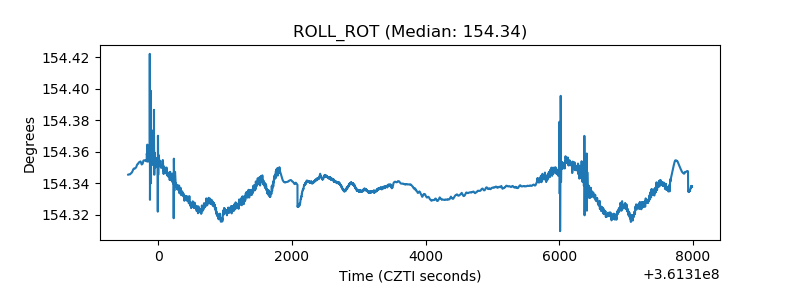 |
| _Roll_DEC | 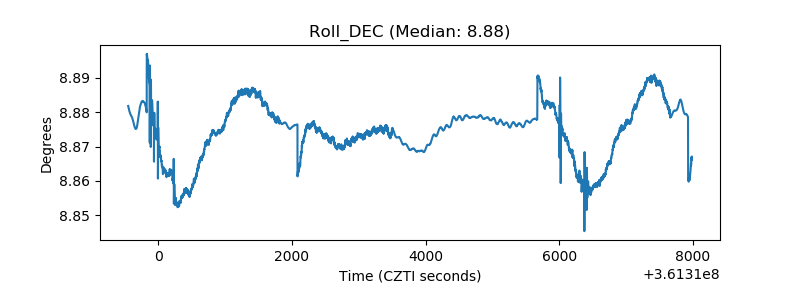 |
| _Roll_RA | 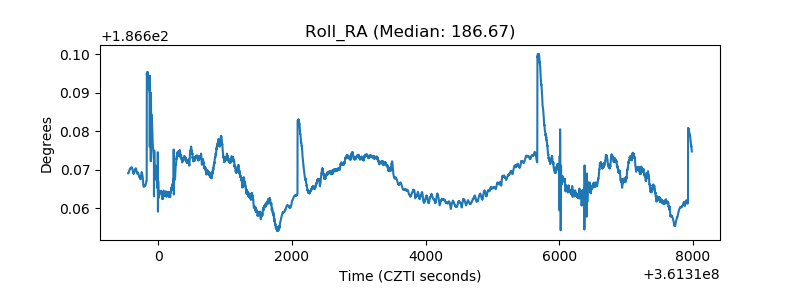 |
| Veto Counter | 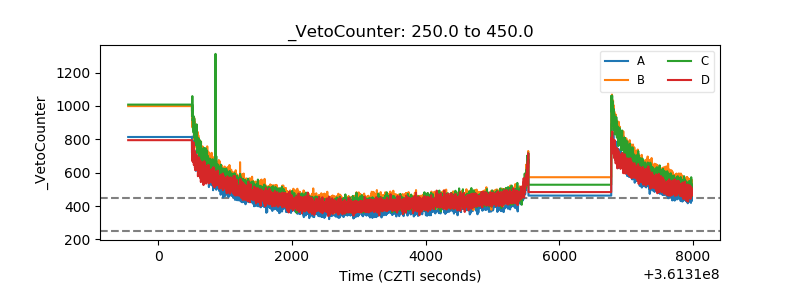 |