| Param | Original file | Final file |
|---|---|---|
| Filename | modeM0/AS1A10_071T49_9000004462_30874cztM0_level2.evt | modeM0/AS1A10_071T49_9000004462_30874cztM0_level2_quad_clean.evt |
| Size (bytes) | 646,611,840 | 90,040,320 |
| Size | 616.7 MB | 85.9 MB |
| Events in quadrant A | 3,288,444 | 596,985 |
| Events in quadrant B | 7,105,563 | 595,926 |
| Events in quadrant C | 3,487,892 | 561,550 |
| Events in quadrant D | 5,277,337 | 533,964 |
| Mode SS | |||
|---|---|---|---|
| Quadrant | BADHDUFLAG | Total packets | Discarded packets |
| A | 0 | 128 | 0 |
| B | 0 | 128 | 0 |
| C | 0 | 128 | 0 |
| D | 0 | 128 | 0 |
| Mode M0 | |||
|---|---|---|---|
| Quadrant | BADHDUFLAG | Total packets | Discarded packets |
| A | 0 | 13478 | 2 |
| B | 0 | 25806 | 2 |
| C | 0 | 14152 | 2 |
| D | 0 | 20007 | 2 |
| Mode M9 | |||
|---|---|---|---|
| Quadrant | BADHDUFLAG | Total packets | Discarded packets |
| A | 0 | 18 | 0 |
| B | 0 | 19 | 0 |
| C | 0 | 19 | 0 |
| D | 0 | 19 | 0 |
| Quadrant | Total seconds | Saturated seconds | Saturation percentage |
|---|---|---|---|
| A | 6275 | 23 | 0.366534% |
| B | 6275 | 258 | 4.111554% |
| C | 6275 | 95 | 1.513944% |
| D | 6275 | 412 | 6.565737% |
Noise dominated data is calculated using 1-second bins in cleaned event files. If a bin has >2000 counts, and if more than 50% of those come from <1% of pixels, then it is considered to be noise-dominated and hence unusable.
| Quadrant | # 1 sec bins | Bins with >0 counts | Bins with >2000 counts | High rate bins dominated by noise | Noise dominated (total time) | Noise dominated (detector-on time) | Marked lightcurve |
|---|---|---|---|---|---|---|---|
| A | 7570 | 6276 | 0 | 0 | 0.00% | 0.00% | 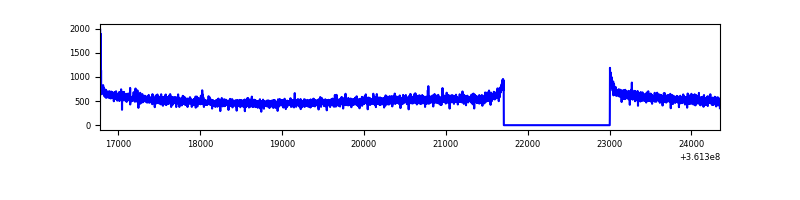 |
| B | 7570 | 6276 | 67 | 67 | 0.89% | 1.07% | 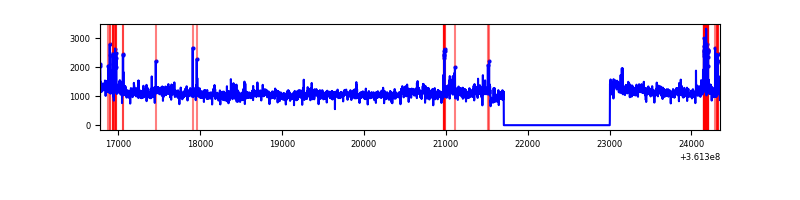 |
| C | 7570 | 6276 | 21 | 21 | 0.28% | 0.33% | 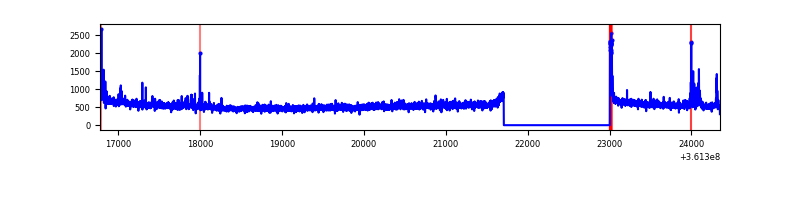 |
| D | 7570 | 6276 | 469 | 469 | 6.20% | 7.47% | 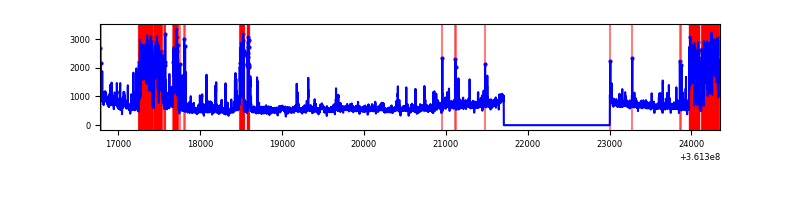 |
Top three noisy pixels from each quadrant. If the there are fewer than three noisy pixels in the level2.evt file, extra rows are filled as -1
| Pixel properties | Quadrant properties | ||||||
|---|---|---|---|---|---|---|---|
| Quadrant | DetID | PixID | Counts | Sigma | Mean | Median | Sigma |
| A | 13 | 254 | 11736 | 64.59 | 850 | 835 | 168.8 |
| A | 3 | 137 | 8243 | 43.89 | 850 | 835 | 168.8 |
| A | 12 | 96 | 7338 | 38.53 | 850 | 835 | 168.8 |
| B | 6 | 159 | 1818461 | 11555.88 | 843 | 824 | 157.3 |
| B | 6 | 36 | 1698166 | 10791.09 | 843 | 824 | 157.3 |
| B | 4 | 80 | 107109 | 675.72 | 843 | 824 | 157.3 |
| C | 14 | 238 | 132012 | 697.67 | 806 | 814 | 188.1 |
| C | 0 | 10 | 74255 | 390.54 | 806 | 814 | 188.1 |
| C | 3 | 233 | 63943 | 335.7 | 806 | 814 | 188.1 |
| D | 12 | 233 | 1364588 | 7360.26 | 786 | 770 | 185.3 |
| D | 8 | 195 | 528062 | 2845.69 | 786 | 770 | 185.3 |
| D | 1 | 52 | 262098 | 1410.34 | 786 | 770 | 185.3 |
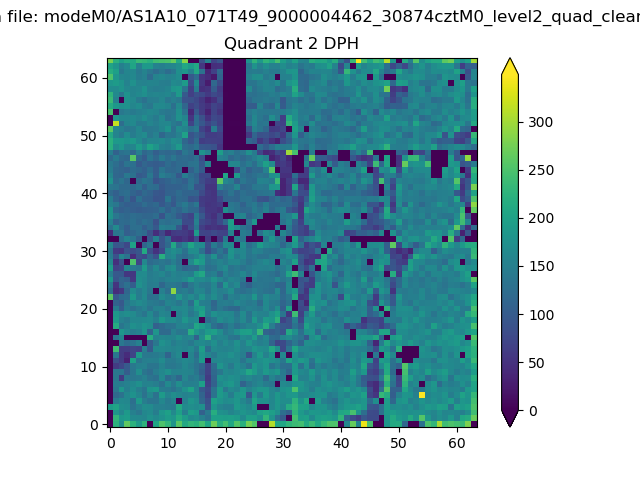
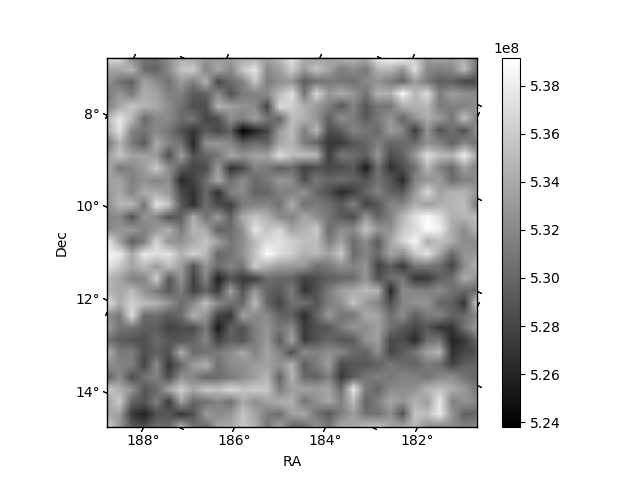
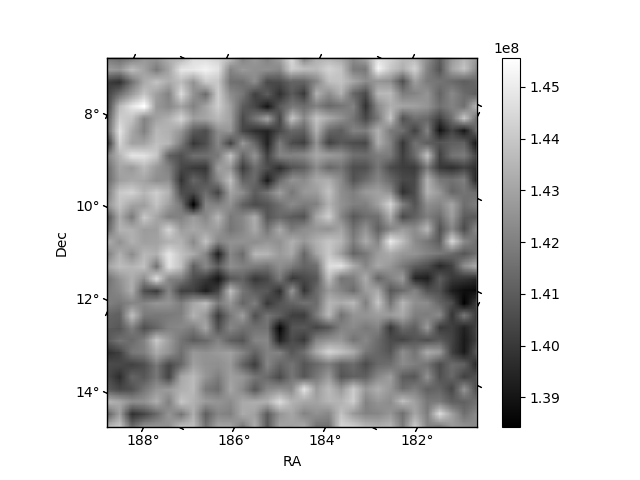
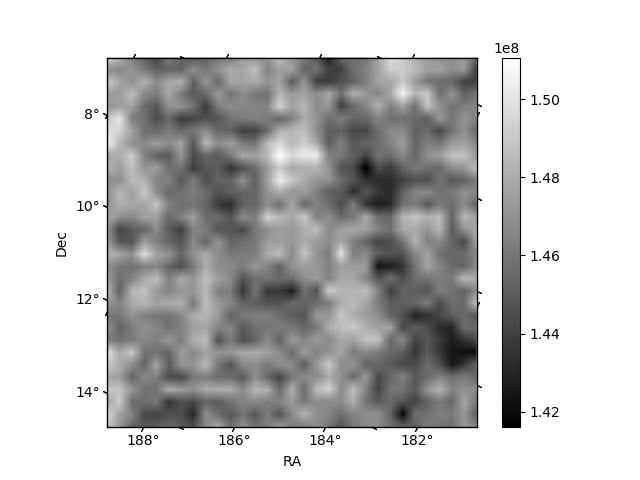
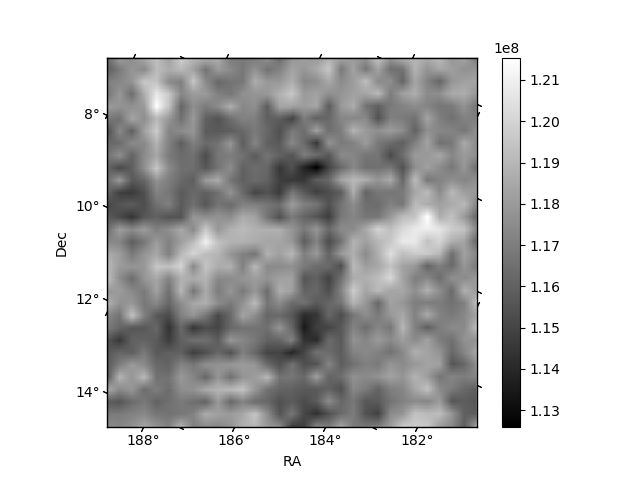
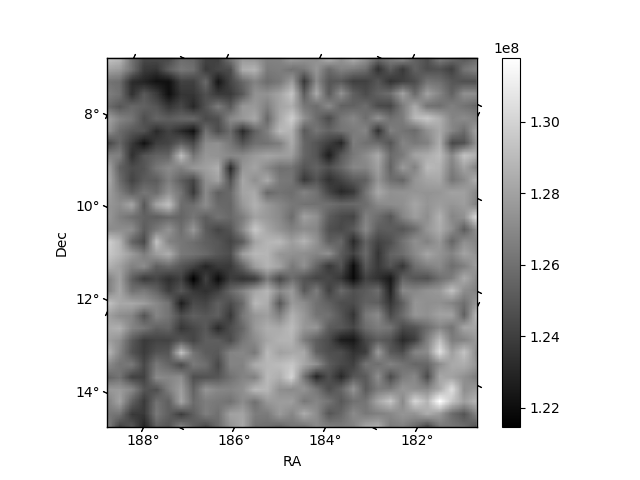
Histogram calculated using DETX and DETY for each event in the final _common_clean file
| Quadrant A | 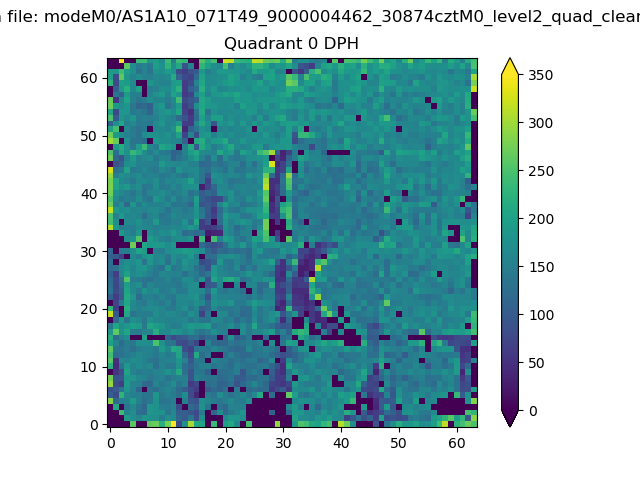 |
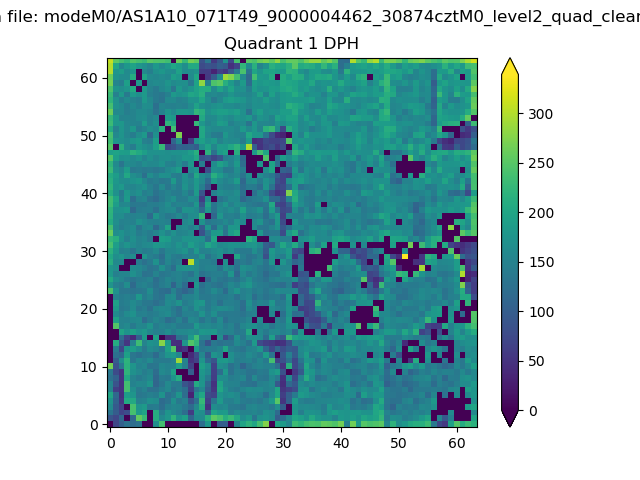 |
Quadrant B |
|---|---|---|---|
| Quadrant D | 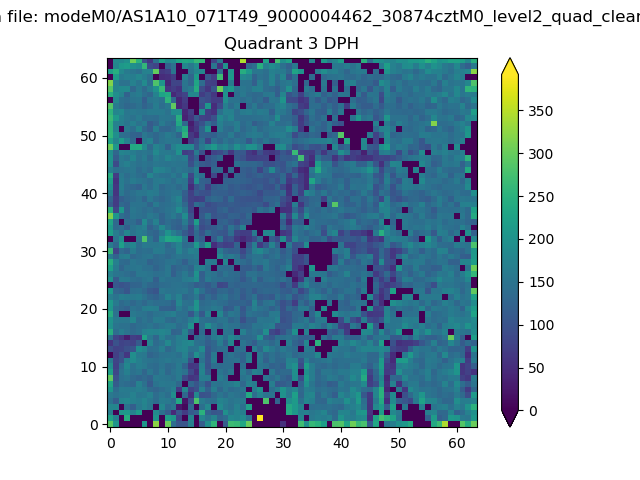 |
 |
Quadrant C |
| Plot type | Count rate plots | Images |
|---|---|---|
| Comparison with Poisson distribution Blue bars denote a histogram of data divided into 1 sec bins. Red curve is a Poisson curve with rate = median count rate of data. |
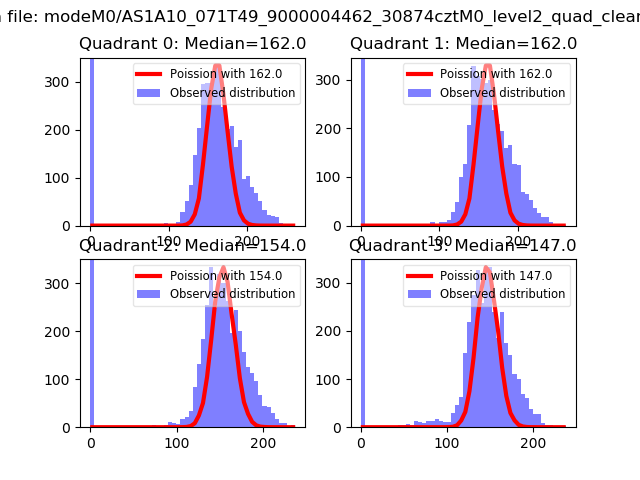 |
 |
| Quadrant-wise count rates Data is divided into 100 sec bins |
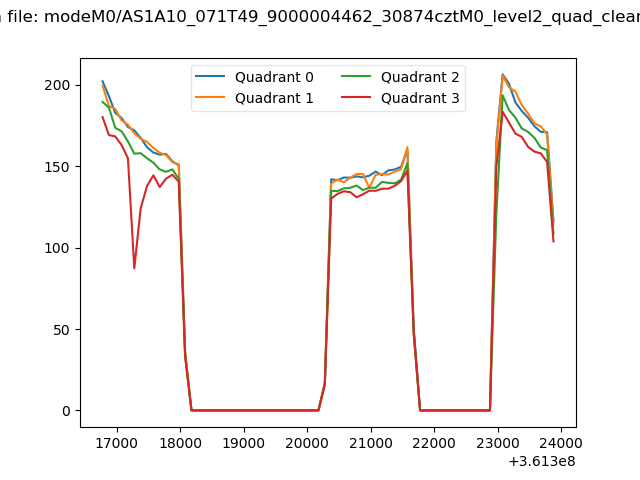 |
|
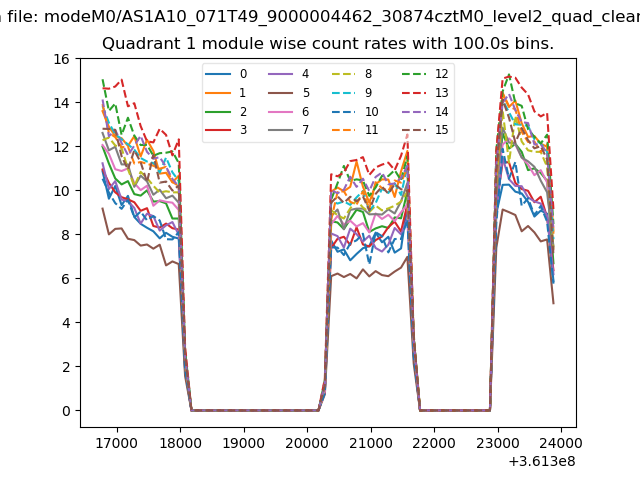
| Module-wise count rates for Quadrant A Data is divided into 100 sec bins |
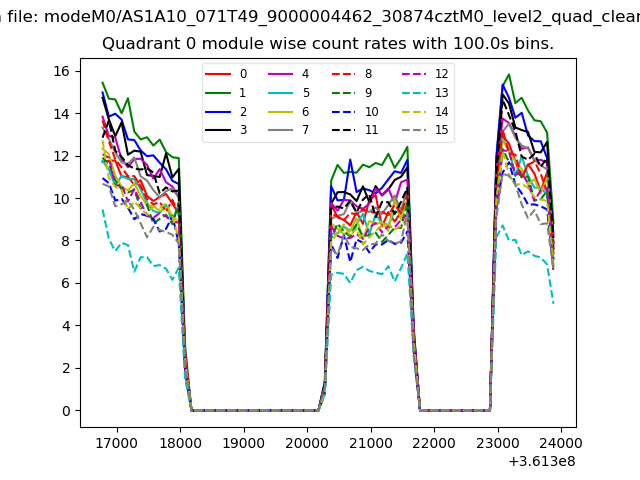 |
 |
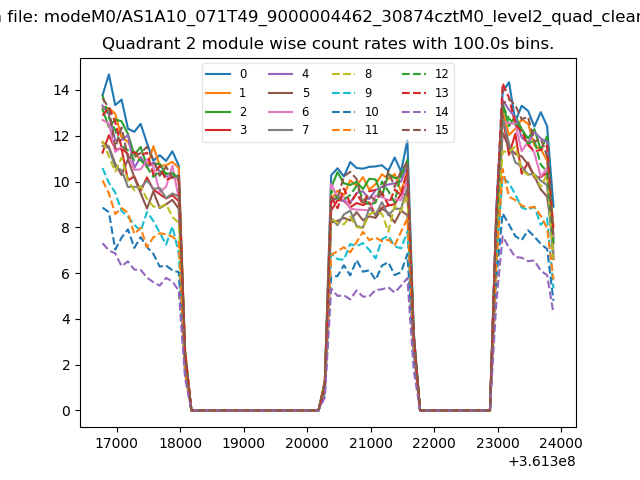
| Module-wise count rates for Quadrant B Data is divided into 100 sec bins |
 |
 |
| Module-wise count rates for Quadrant C Data is divided into 100 sec bins |
 |
 |
| Module-wise count rates for Quadrant D Data is divided into 100 sec bins |
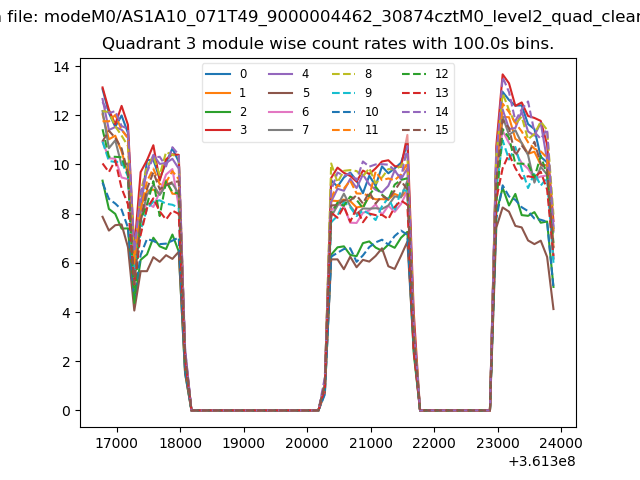 |
 |
| Parameter | Plot |
|---|---|
| CZT HV Monitor | 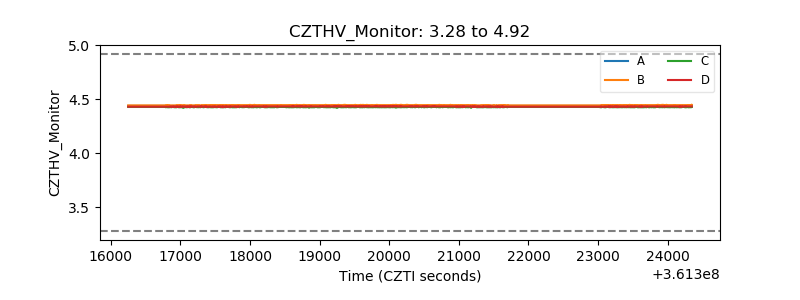 |
| D_VDD | 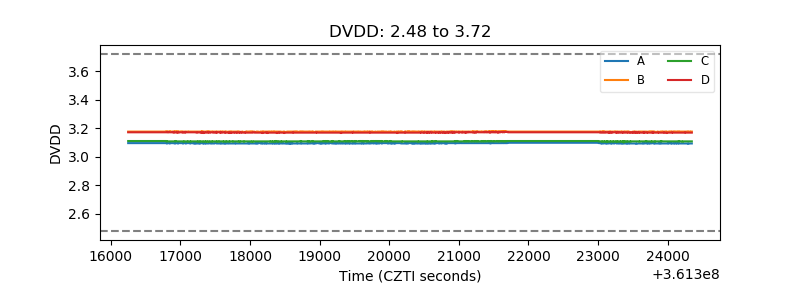 |
| Temperature 1 | 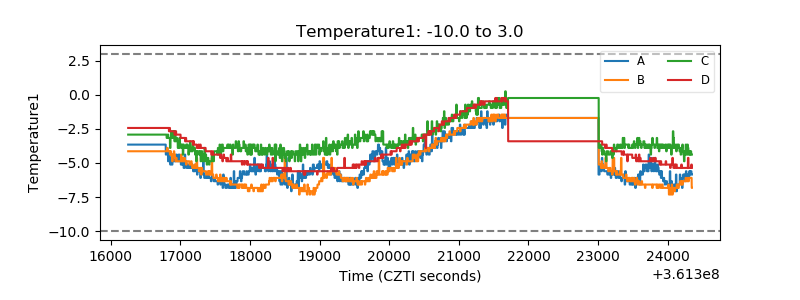 |
| Veto HV Monitor |  |
| Veto LLD | 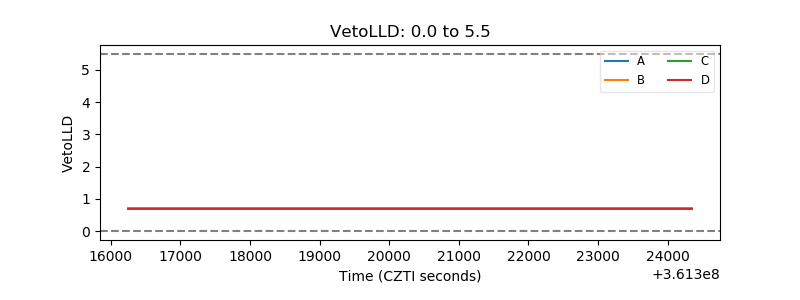 |
| Alpha Counter | 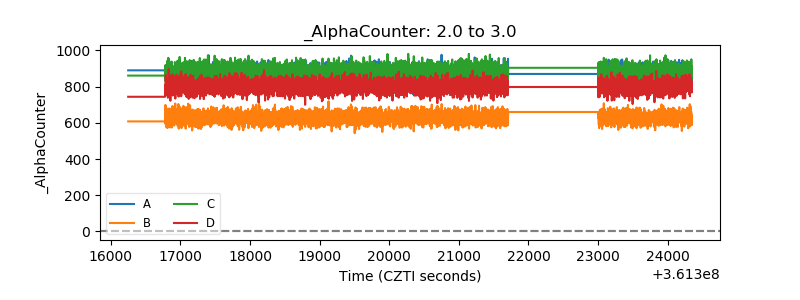 |
| _CPM_Rate | 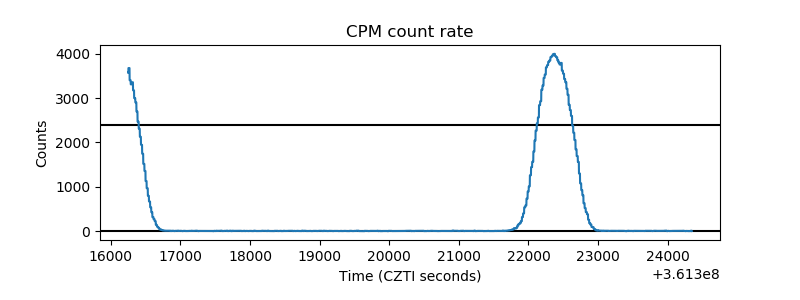 |
| CZT Counter | 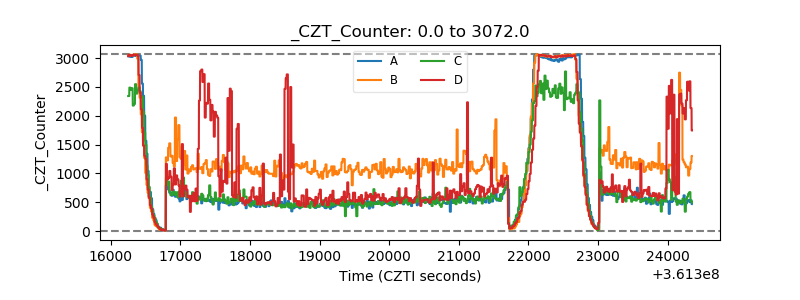 |
| +2.5 Volts monitor |  |
| +5 Volts monitor |  |
| _ROLL_ROT | 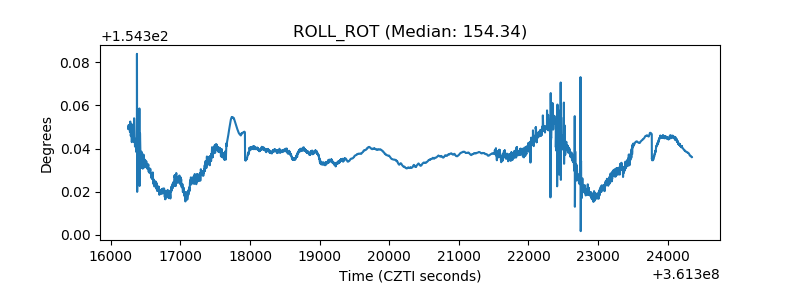 |
| _Roll_DEC | 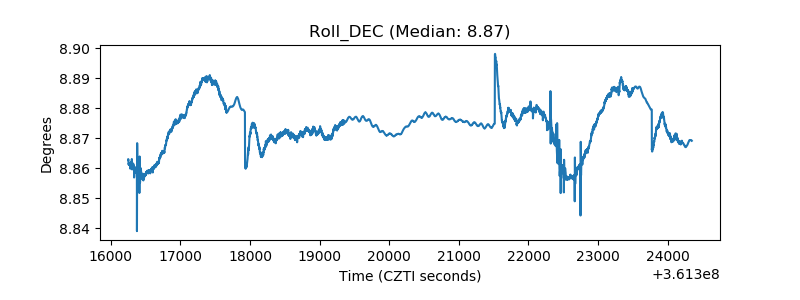 |
| _Roll_RA | 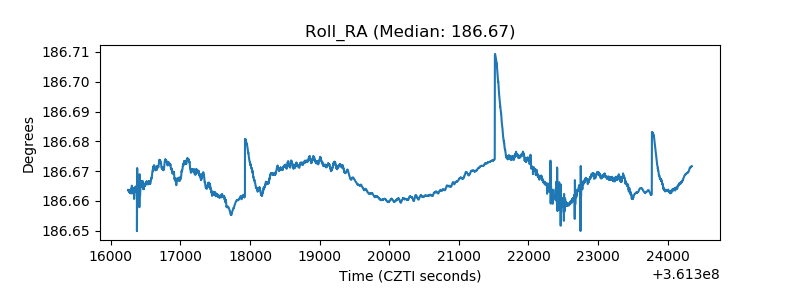 |
| Veto Counter | 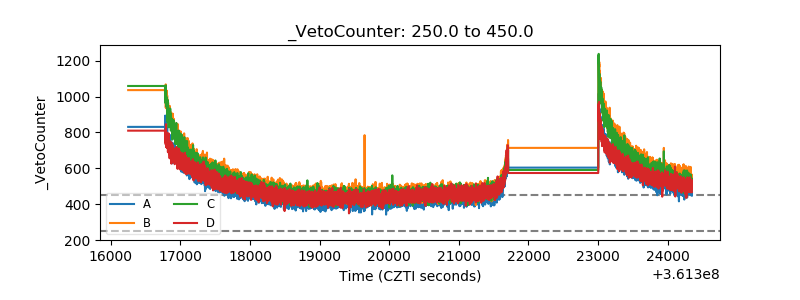 |