| Param | Original file | Final file |
|---|---|---|
| Filename | modeM0/AS1A10_071T49_9000004462_30875cztM0_level2.evt | modeM0/AS1A10_071T49_9000004462_30875cztM0_level2_quad_clean.evt |
| Size (bytes) | 628,784,640 | 81,149,760 |
| Size | 599.7 MB | 77.4 MB |
| Events in quadrant A | 3,323,948 | 528,162 |
| Events in quadrant B | 6,879,240 | 528,120 |
| Events in quadrant C | 3,866,337 | 488,445 |
| Events in quadrant D | 4,555,508 | 480,293 |
| Mode SS | |||
|---|---|---|---|
| Quadrant | BADHDUFLAG | Total packets | Discarded packets |
| A | 0 | 126 | 0 |
| B | 0 | 126 | 0 |
| C | 0 | 126 | 0 |
| D | 0 | 126 | 0 |
| Mode M0 | |||
|---|---|---|---|
| Quadrant | BADHDUFLAG | Total packets | Discarded packets |
| A | 0 | 13414 | 2 |
| B | 0 | 25085 | 2 |
| C | 0 | 15144 | 2 |
| D | 0 | 17766 | 2 |
| Mode M9 | |||
|---|---|---|---|
| Quadrant | BADHDUFLAG | Total packets | Discarded packets |
| A | 0 | 14 | 0 |
| B | 0 | 15 | 0 |
| C | 0 | 15 | 0 |
| D | 0 | 15 | 0 |
| Quadrant | Total seconds | Saturated seconds | Saturation percentage |
|---|---|---|---|
| A | 6192 | 20 | 0.322997% |
| B | 6192 | 196 | 3.165375% |
| C | 6192 | 185 | 2.987726% |
| D | 6192 | 263 | 4.247416% |
Noise dominated data is calculated using 1-second bins in cleaned event files. If a bin has >2000 counts, and if more than 50% of those come from <1% of pixels, then it is considered to be noise-dominated and hence unusable.
| Quadrant | # 1 sec bins | Bins with >0 counts | Bins with >2000 counts | High rate bins dominated by noise | Noise dominated (total time) | Noise dominated (detector-on time) | Marked lightcurve |
|---|---|---|---|---|---|---|---|
| A | 7572 | 6193 | 0 | 0 | 0.00% | 0.00% | 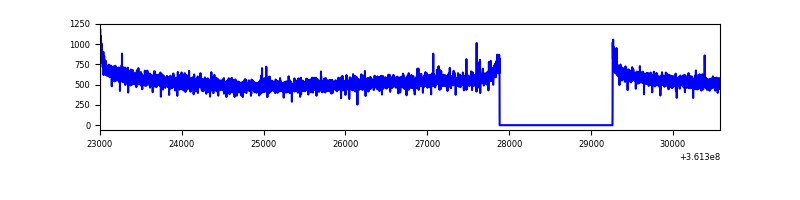 |
| B | 7572 | 6193 | 45 | 45 | 0.59% | 0.73% | 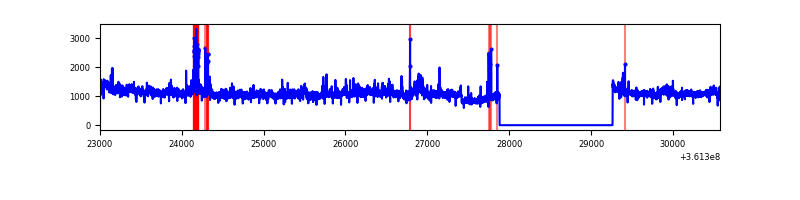 |
| C | 7572 | 6193 | 76 | 76 | 1.00% | 1.23% | 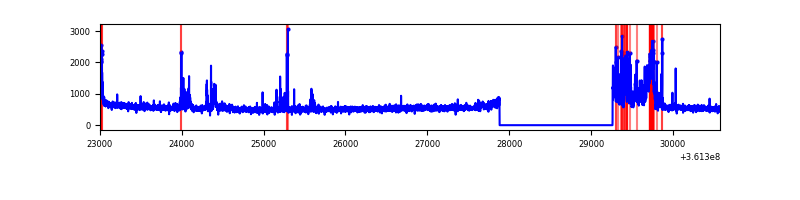 |
| D | 7572 | 6193 | 293 | 293 | 3.87% | 4.73% | 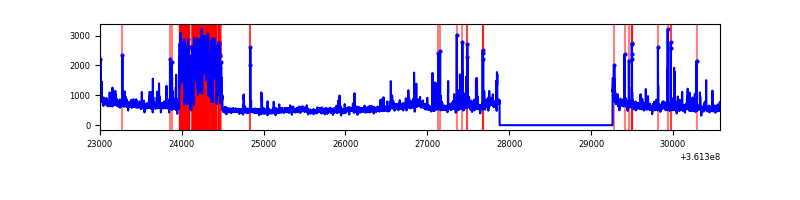 |
Top three noisy pixels from each quadrant. If the there are fewer than three noisy pixels in the level2.evt file, extra rows are filled as -1
| Pixel properties | Quadrant properties | ||||||
|---|---|---|---|---|---|---|---|
| Quadrant | DetID | PixID | Counts | Sigma | Mean | Median | Sigma |
| A | 13 | 254 | 11593 | 63.25 | 860 | 847 | 169.9 |
| A | 3 | 137 | 7939 | 41.74 | 860 | 847 | 169.9 |
| A | 0 | 226 | 7192 | 37.35 | 860 | 847 | 169.9 |
| B | 6 | 159 | 1751387 | 10997.41 | 853 | 834 | 159.2 |
| B | 6 | 36 | 1506497 | 9458.95 | 853 | 834 | 159.2 |
| B | 4 | 80 | 123354 | 769.7 | 853 | 834 | 159.2 |
| C | 3 | 233 | 388083 | 2067.67 | 805 | 813 | 187.3 |
| C | 14 | 238 | 133061 | 706.08 | 805 | 813 | 187.3 |
| C | 2 | 16 | 127021 | 673.84 | 805 | 813 | 187.3 |
| D | 12 | 233 | 826058 | 4424.67 | 797 | 780 | 186.5 |
| D | 8 | 195 | 510974 | 2735.37 | 797 | 780 | 186.5 |
| D | 2 | 250 | 117941 | 628.15 | 797 | 780 | 186.5 |
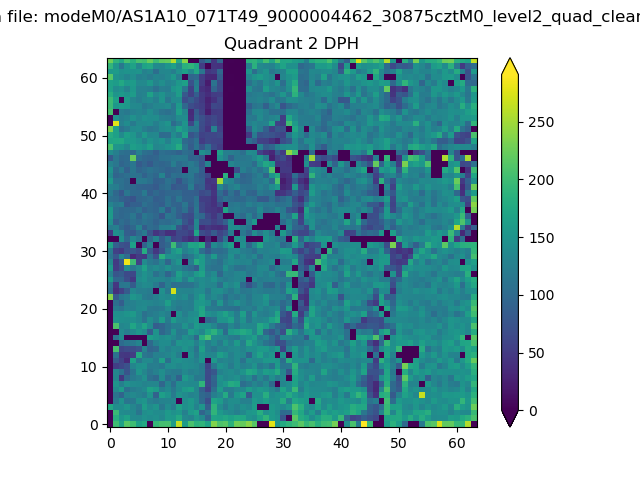
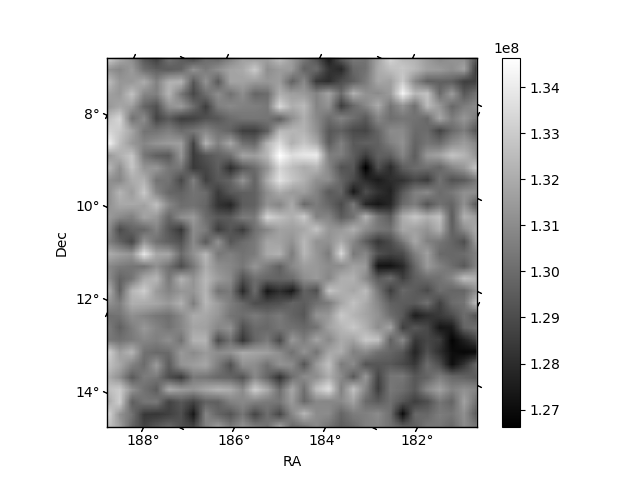
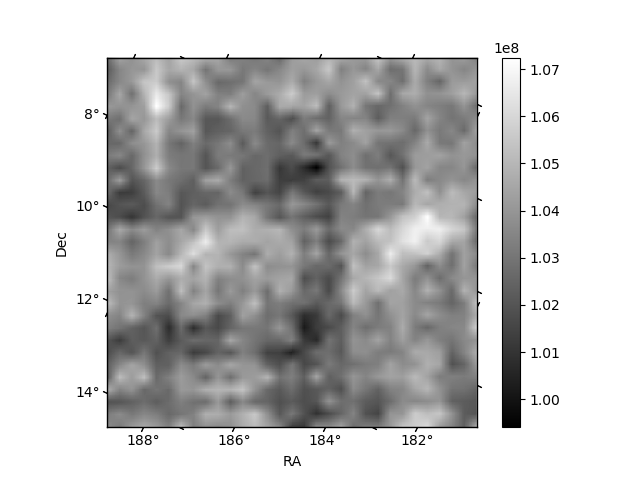
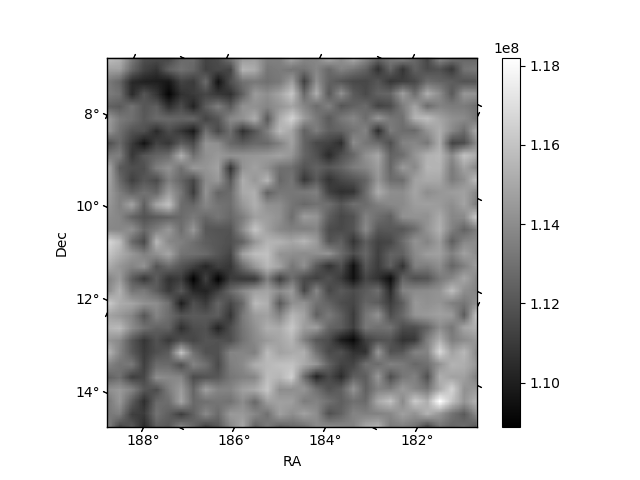
Histogram calculated using DETX and DETY for each event in the final _common_clean file
| Quadrant A | 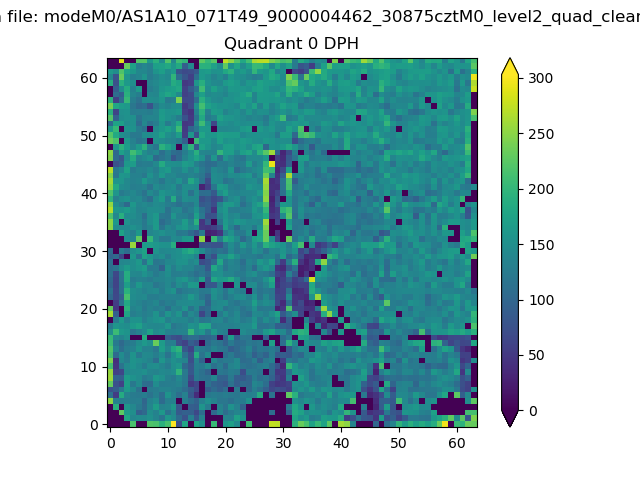 |
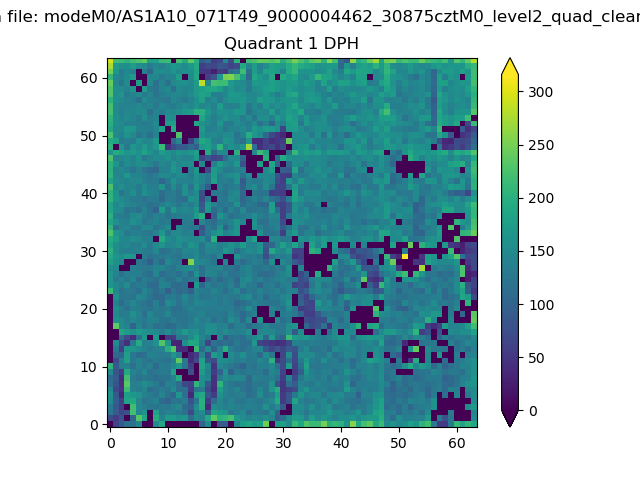 |
Quadrant B |
|---|---|---|---|
| Quadrant D | 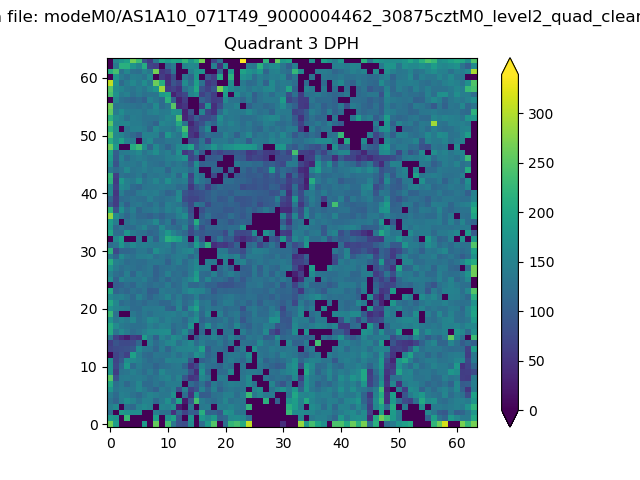 |
 |
Quadrant C |
| Plot type | Count rate plots | Images |
|---|---|---|
| Comparison with Poisson distribution Blue bars denote a histogram of data divided into 1 sec bins. Red curve is a Poisson curve with rate = median count rate of data. |
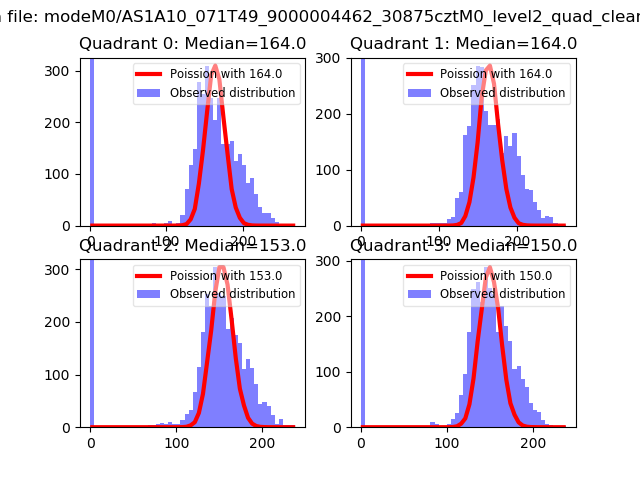 |
 |
| Quadrant-wise count rates Data is divided into 100 sec bins |
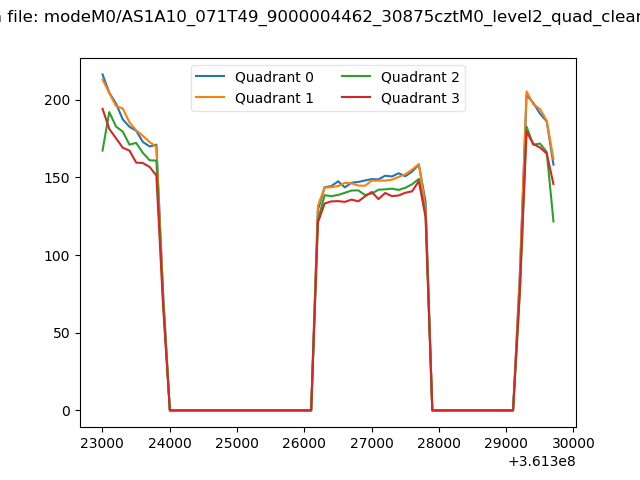 |
|
| Module-wise count rates for Quadrant A Data is divided into 100 sec bins |
 |
 |
| Module-wise count rates for Quadrant B Data is divided into 100 sec bins |
 |
 |
| Module-wise count rates for Quadrant C Data is divided into 100 sec bins |
 |
 |
| Module-wise count rates for Quadrant D Data is divided into 100 sec bins |
 |
 |
| Parameter | Plot |
|---|---|
| CZT HV Monitor |  |
| D_VDD |  |
| Temperature 1 |  |
| Veto HV Monitor | 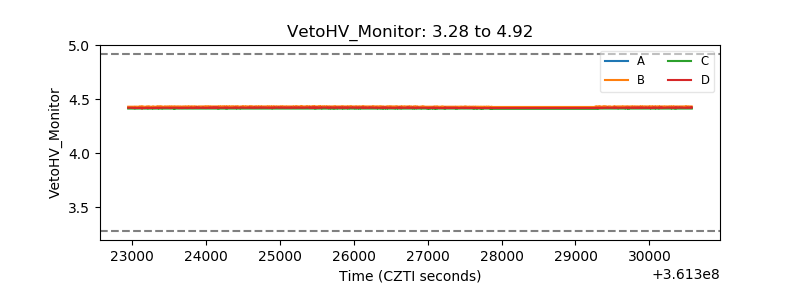 |
| Veto LLD |  |
| Alpha Counter | 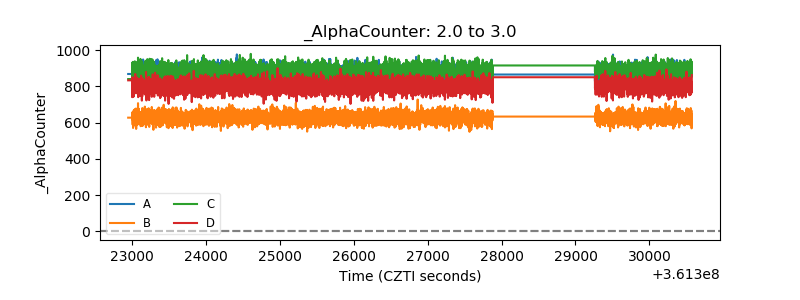 |
| _CPM_Rate | 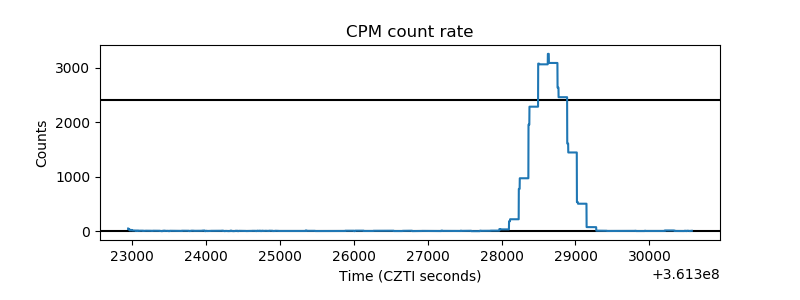 |
| CZT Counter | 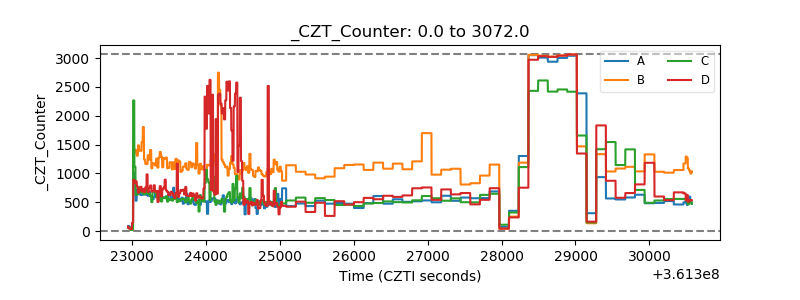 |
| +2.5 Volts monitor | 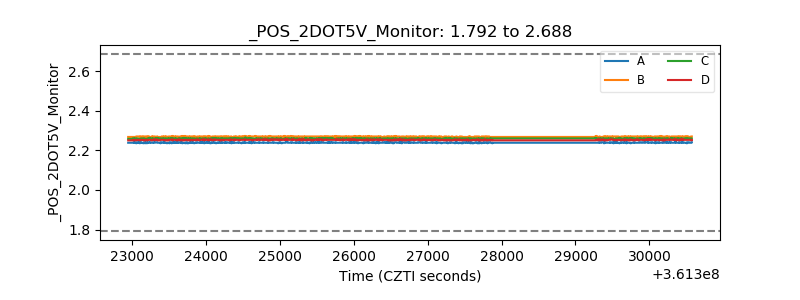 |
| +5 Volts monitor |  |
| _ROLL_ROT | 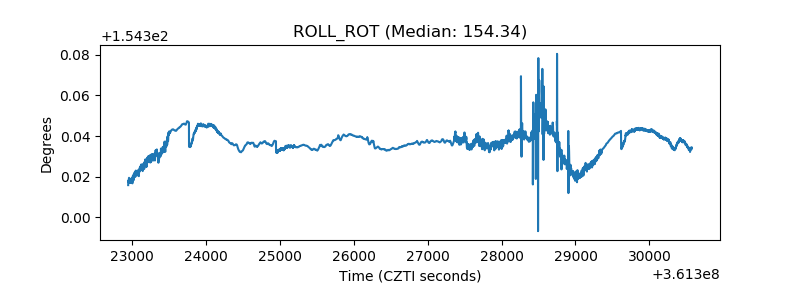 |
| _Roll_DEC | 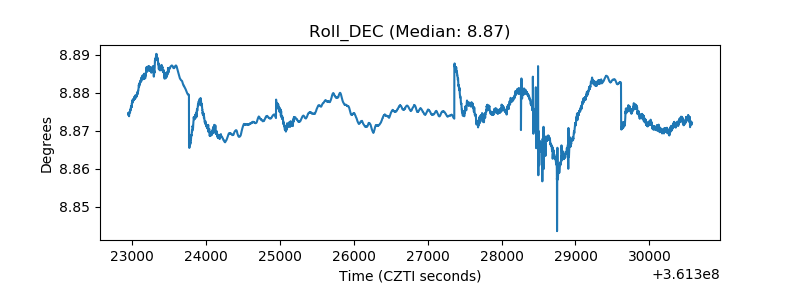 |
| _Roll_RA | 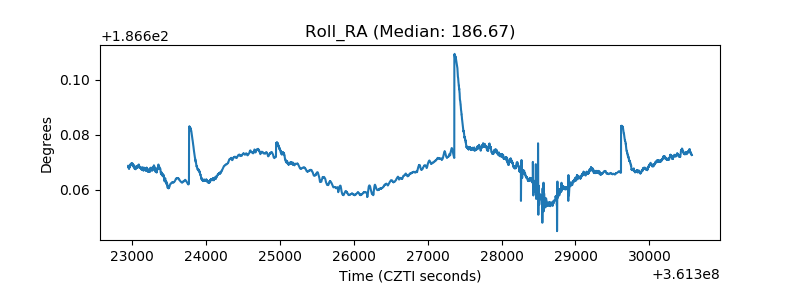 |
| Veto Counter |  |