| Param | Original file | Final file |
|---|---|---|
| Filename | modeM0/AS1A10_071T49_9000004462_30878cztM0_level2.evt | modeM0/AS1A10_071T49_9000004462_30878cztM0_level2_quad_clean.evt |
| Size (bytes) | 892,656,000 | 67,000,320 |
| Size | 851.3 MB | 63.9 MB |
| Events in quadrant A | 3,484,227 | 474,688 |
| Events in quadrant B | 15,724,502 | 182,621 |
| Events in quadrant C | 3,563,047 | 450,474 |
| Events in quadrant D | 3,801,647 | 445,300 |
| Mode SS | |||
|---|---|---|---|
| Quadrant | BADHDUFLAG | Total packets | Discarded packets |
| A | 0 | 138 | 0 |
| B | 0 | 138 | 0 |
| C | 0 | 138 | 0 |
| D | 0 | 138 | 0 |
| Mode M0 | |||
|---|---|---|---|
| Quadrant | BADHDUFLAG | Total packets | Discarded packets |
| A | 0 | 14306 | 1 |
| B | 0 | 51255 | 4 |
| C | 0 | 14570 | 1 |
| D | 0 | 15375 | 1 |
| Mode M9 | |||
|---|---|---|---|
| Quadrant | BADHDUFLAG | Total packets | Discarded packets |
| A | 0 | 7 | 0 |
| B | 0 | 7 | 0 |
| C | 0 | 7 | 0 |
| D | 0 | 7 | 0 |
| Quadrant | Total seconds | Saturated seconds | Saturation percentage |
|---|---|---|---|
| A | 6801 | 115 | 1.690928% |
| B | 6801 | 6480 | 95.280106% |
| C | 6801 | 166 | 2.440818% |
| D | 6801 | 75 | 1.102779% |
Noise dominated data is calculated using 1-second bins in cleaned event files. If a bin has >2000 counts, and if more than 50% of those come from <1% of pixels, then it is considered to be noise-dominated and hence unusable.
| Quadrant | # 1 sec bins | Bins with >0 counts | Bins with >2000 counts | High rate bins dominated by noise | Noise dominated (total time) | Noise dominated (detector-on time) | Marked lightcurve |
|---|---|---|---|---|---|---|---|
| A | 7561 | 6801 | 7 | 7 | 0.09% | 0.10% | 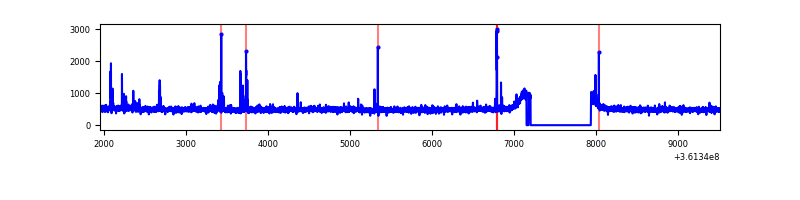 |
| B | 7560 | 6800 | 5977 | 5977 | 79.06% | 87.90% | 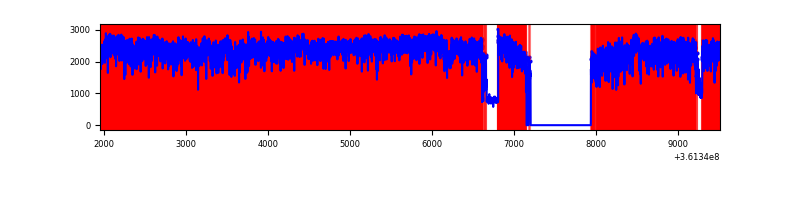 |
| C | 7561 | 6801 | 4 | 4 | 0.05% | 0.06% | 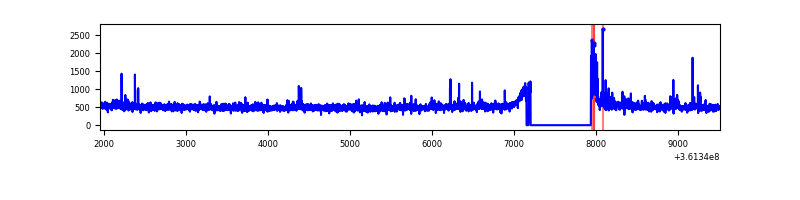 |
| D | 7561 | 6801 | 10 | 10 | 0.13% | 0.15% |  |
Top three noisy pixels from each quadrant. If the there are fewer than three noisy pixels in the level2.evt file, extra rows are filled as -1
| Pixel properties | Quadrant properties | ||||||
|---|---|---|---|---|---|---|---|
| Quadrant | DetID | PixID | Counts | Sigma | Mean | Median | Sigma |
| A | 0 | 13 | 109616 | 618.77 | 873 | 857 | 175.8 |
| A | 13 | 254 | 12608 | 66.86 | 873 | 857 | 175.8 |
| A | 3 | 137 | 8967 | 46.14 | 873 | 857 | 175.8 |
| B | 6 | 36 | 12956887 | 152604.92 | 431 | 421 | 84.9 |
| B | 6 | 159 | 983405 | 11577.86 | 431 | 421 | 84.9 |
| B | 4 | 80 | 44725 | 521.83 | 431 | 421 | 84.9 |
| C | 14 | 238 | 133416 | 683.72 | 824 | 831 | 193.9 |
| C | 3 | 233 | 91996 | 470.12 | 824 | 831 | 193.9 |
| C | 0 | 10 | 91171 | 465.87 | 824 | 831 | 193.9 |
| D | 8 | 195 | 493041 | 2501.3 | 832 | 814 | 196.8 |
| D | 2 | 250 | 91705 | 461.87 | 832 | 814 | 196.8 |
| D | 12 | 233 | 32867 | 162.88 | 832 | 814 | 196.8 |
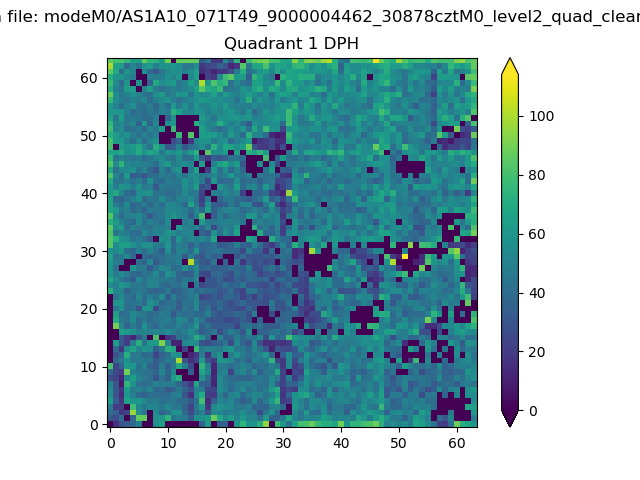
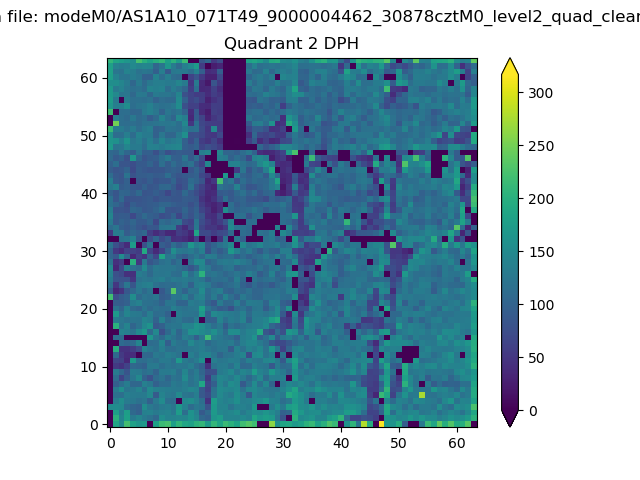
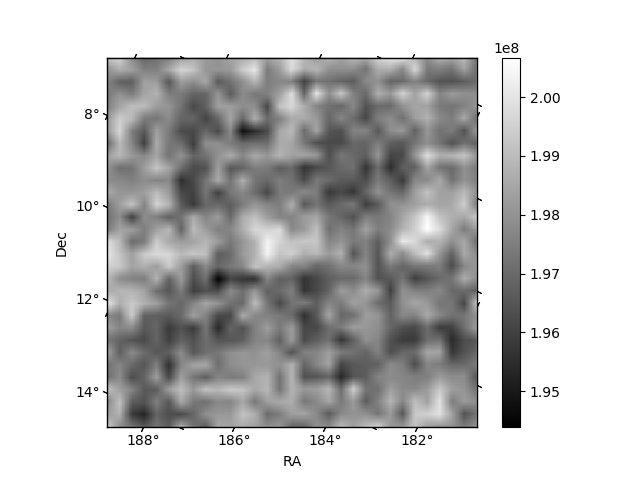
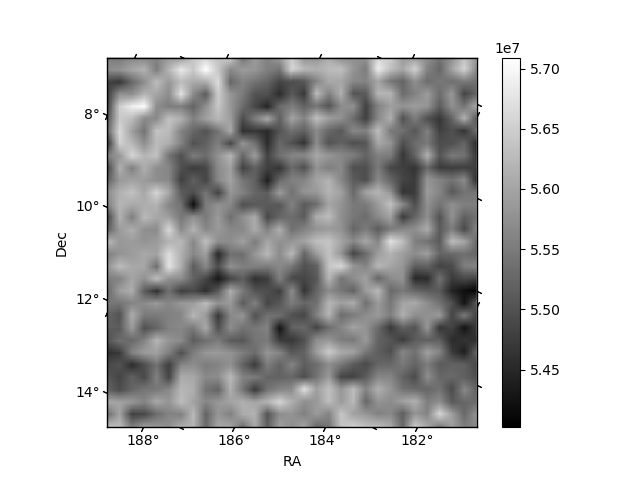
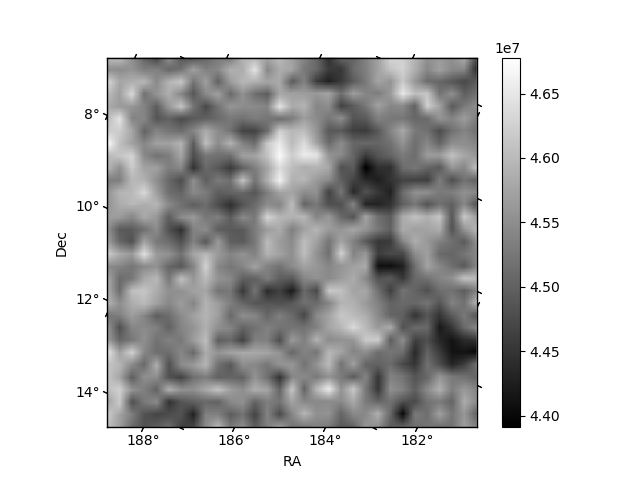
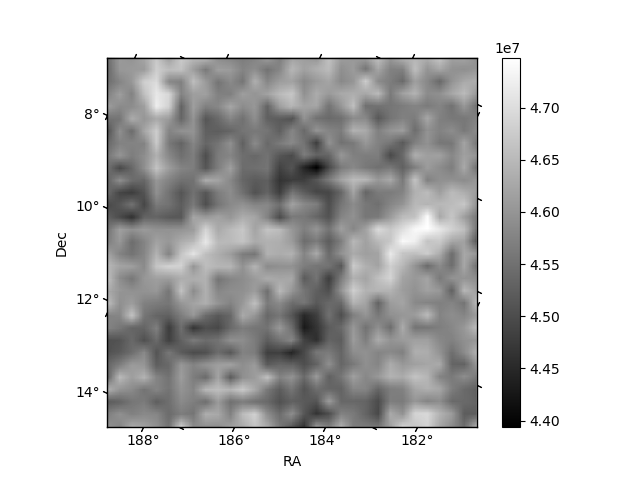
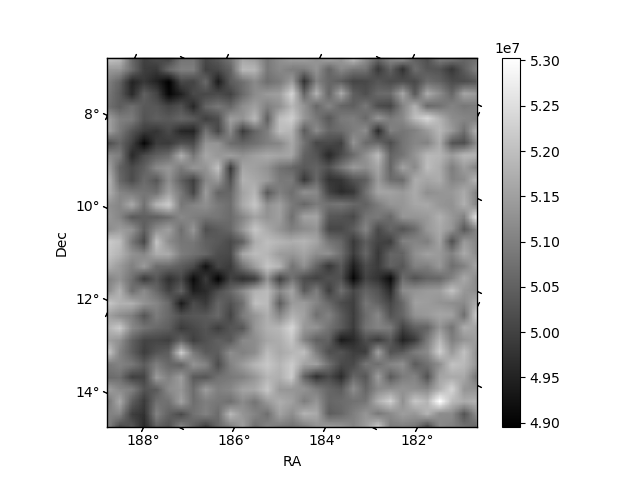
Histogram calculated using DETX and DETY for each event in the final _common_clean file
| Quadrant A | 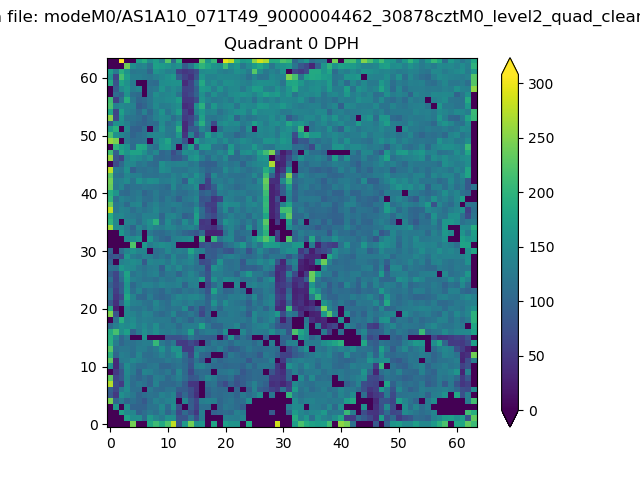 |
 |
Quadrant B |
|---|---|---|---|
| Quadrant D | 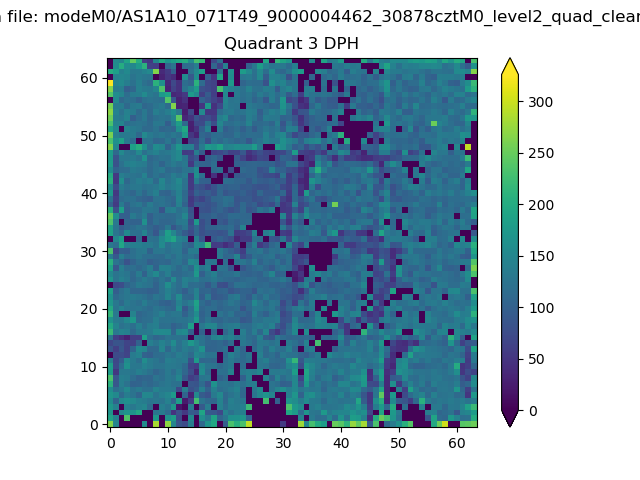 |
 |
Quadrant C |
| Plot type | Count rate plots | Images |
|---|---|---|
| Comparison with Poisson distribution Blue bars denote a histogram of data divided into 1 sec bins. Red curve is a Poisson curve with rate = median count rate of data. |
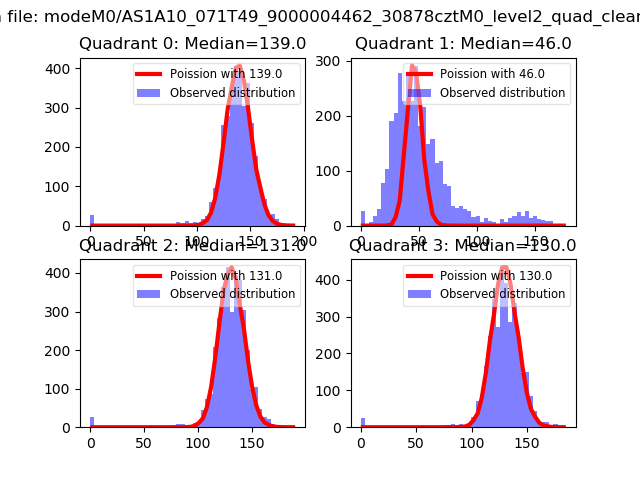 |
 |
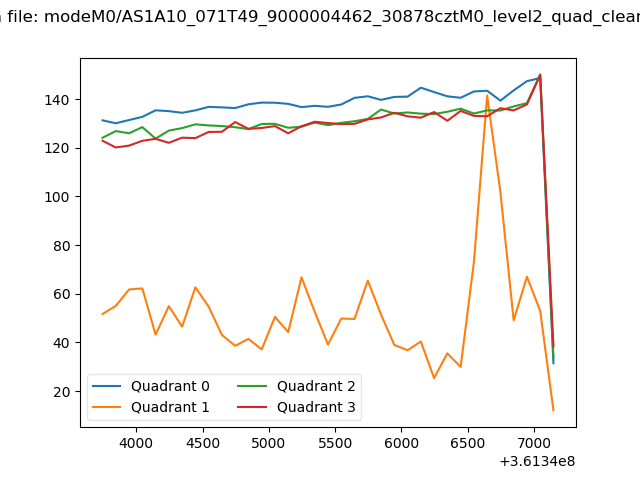
| Quadrant-wise count rates Data is divided into 100 sec bins |
 |
|
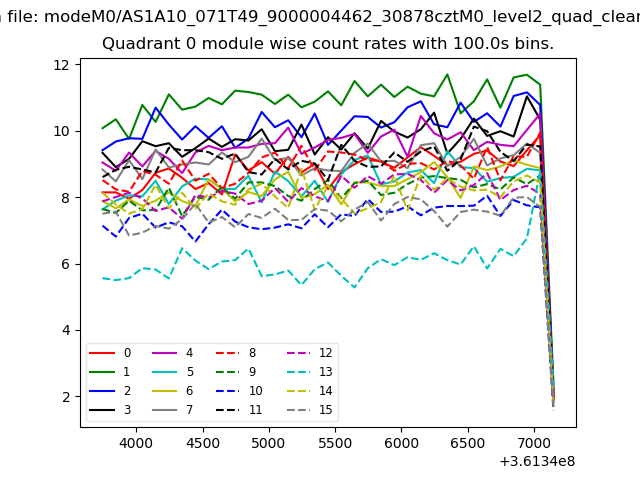
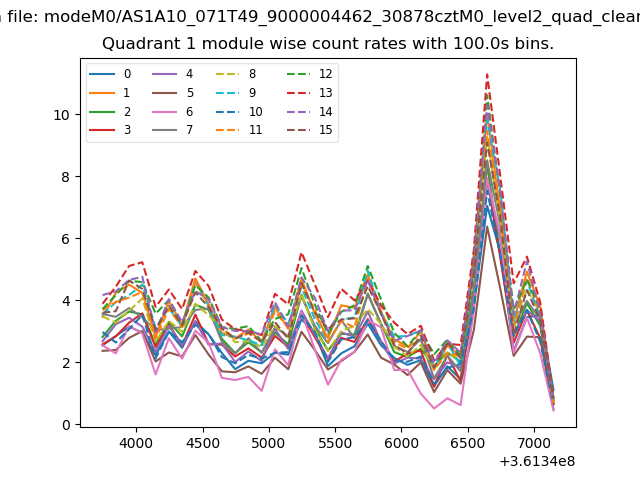
| Module-wise count rates for Quadrant A Data is divided into 100 sec bins |
 |
 |
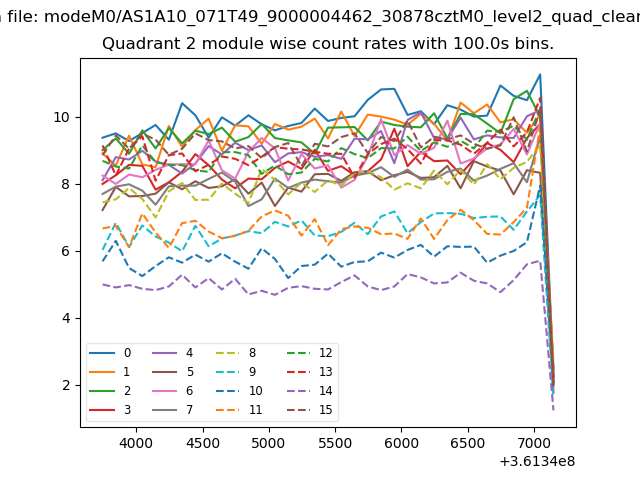
| Module-wise count rates for Quadrant B Data is divided into 100 sec bins |
 |
 |
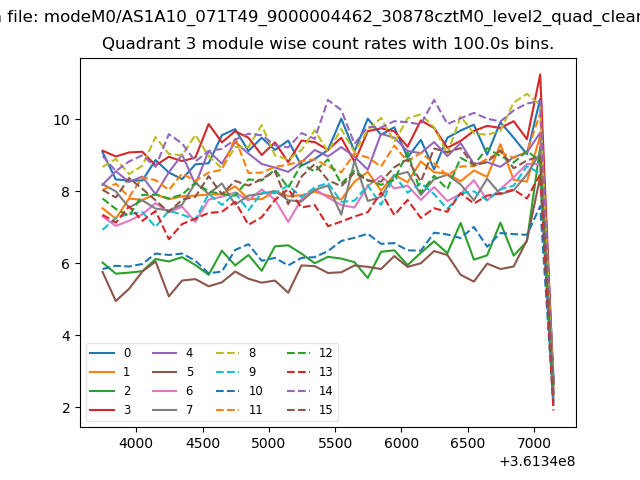
| Module-wise count rates for Quadrant C Data is divided into 100 sec bins |
 |
 |
| Module-wise count rates for Quadrant D Data is divided into 100 sec bins |
 |
 |
| Parameter | Plot |
|---|---|
| CZT HV Monitor | 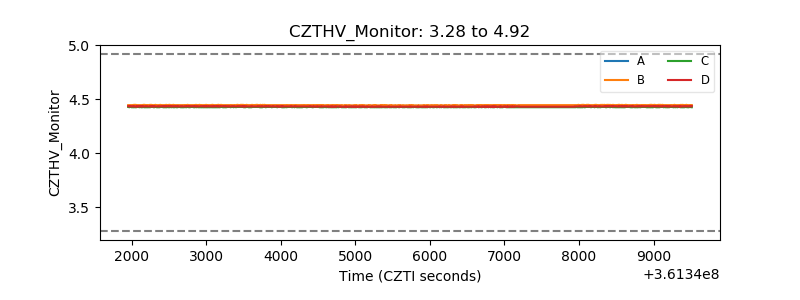 |
| D_VDD |  |
| Temperature 1 | 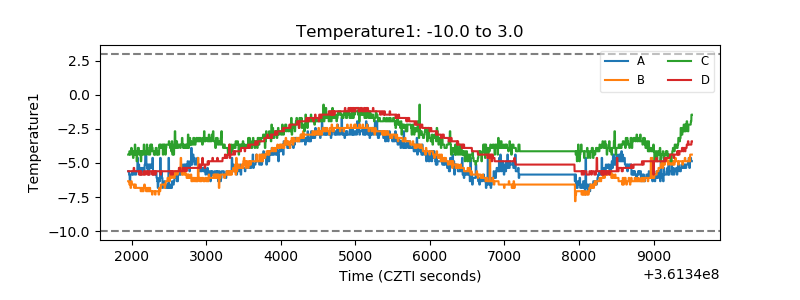 |
| Veto HV Monitor | 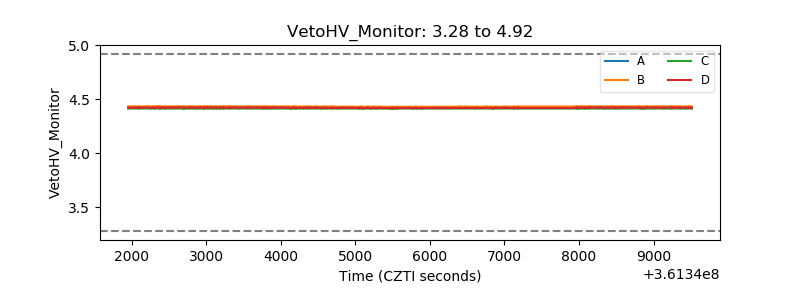 |
| Veto LLD | 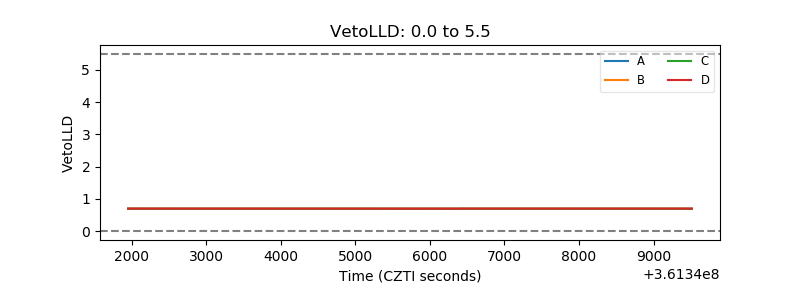 |
| Alpha Counter | 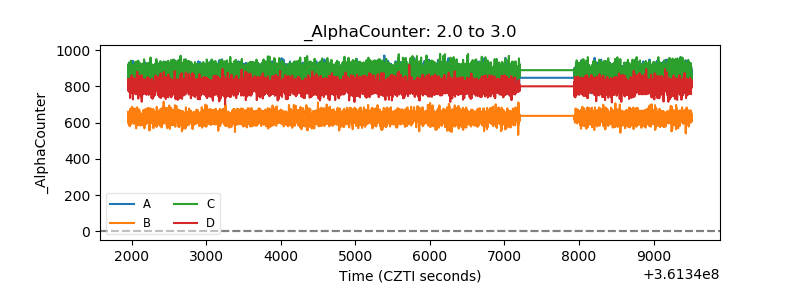 |
| _CPM_Rate | 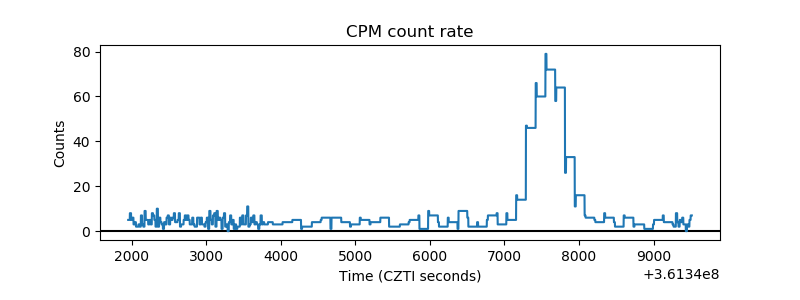 |
| CZT Counter | 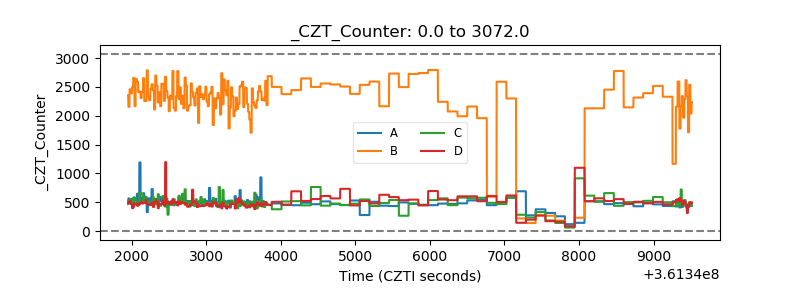 |
| +2.5 Volts monitor | 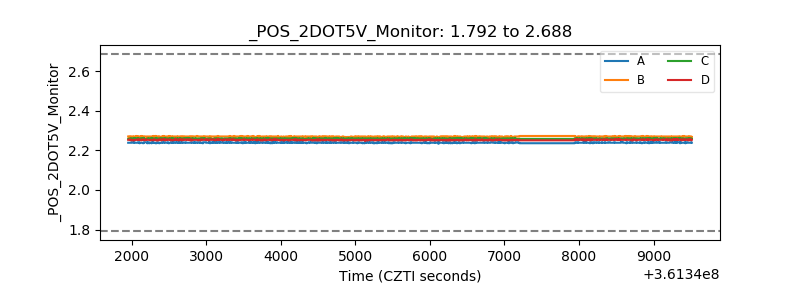 |
| +5 Volts monitor |  |
| _ROLL_ROT | 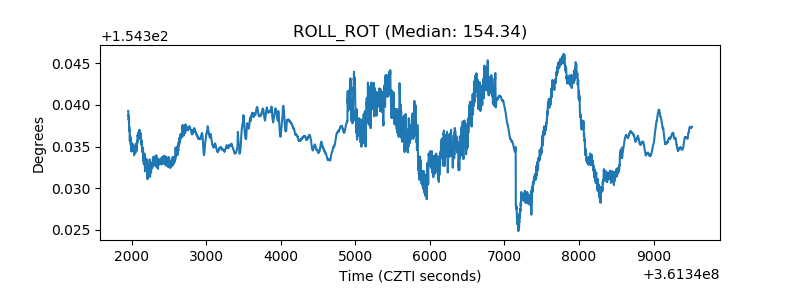 |
| _Roll_DEC | 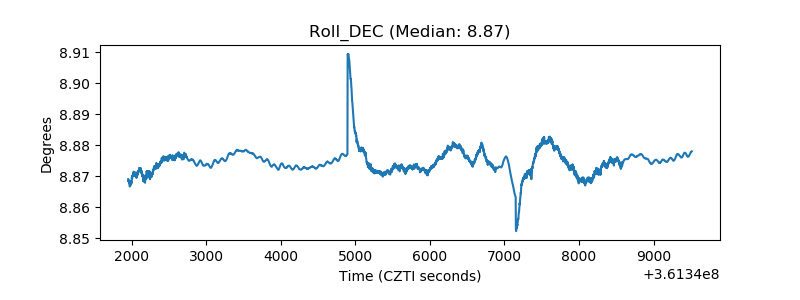 |
| _Roll_RA | 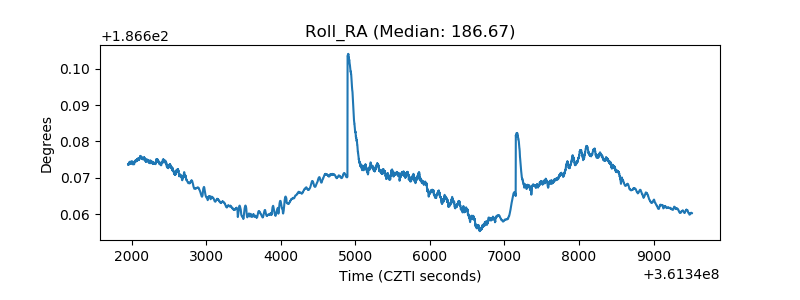 |
| Veto Counter | 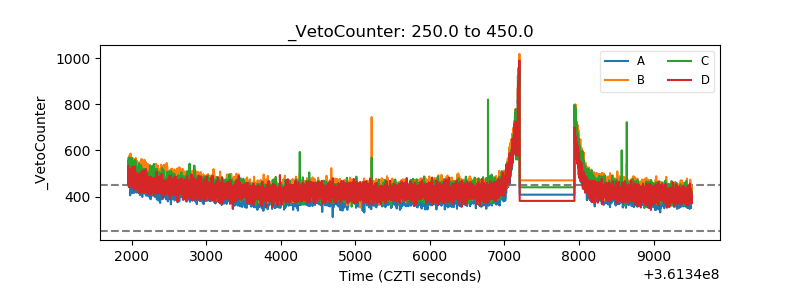 |