| Param | Original file | Final file |
|---|---|---|
| Filename | modeM0/AS1A10_071T49_9000004462_30880cztM0_level2.evt | modeM0/AS1A10_071T49_9000004462_30880cztM0_level2_quad_clean.evt |
| Size (bytes) | 869,952,960 | 85,095,360 |
| Size | 829.7 MB | 81.2 MB |
| Events in quadrant A | 4,514,813 | 565,150 |
| Events in quadrant B | 12,696,148 | 389,087 |
| Events in quadrant C | 3,894,572 | 548,031 |
| Events in quadrant D | 4,722,398 | 540,213 |
| Mode SS | |||
|---|---|---|---|
| Quadrant | BADHDUFLAG | Total packets | Discarded packets |
| A | 0 | 154 | 0 |
| B | 0 | 154 | 0 |
| C | 0 | 154 | 0 |
| D | 0 | 154 | 0 |
| Mode M0 | |||
|---|---|---|---|
| Quadrant | BADHDUFLAG | Total packets | Discarded packets |
| A | 0 | 18276 | 0 |
| B | 0 | 42993 | 0 |
| C | 0 | 16251 | 0 |
| D | 0 | 18699 | 0 |
| Quadrant | Total seconds | Saturated seconds | Saturation percentage |
|---|---|---|---|
| A | 7660 | 475 | 6.201044% |
| B | 7660 | 4292 | 56.031332% |
| C | 7661 | 353 | 4.607754% |
| D | 7661 | 314 | 4.098682% |
Noise dominated data is calculated using 1-second bins in cleaned event files. If a bin has >2000 counts, and if more than 50% of those come from <1% of pixels, then it is considered to be noise-dominated and hence unusable.
| Quadrant | # 1 sec bins | Bins with >0 counts | Bins with >2000 counts | High rate bins dominated by noise | Noise dominated (total time) | Noise dominated (detector-on time) | Marked lightcurve |
|---|---|---|---|---|---|---|---|
| A | 7660 | 7660 | 138 | 138 | 1.80% | 1.80% |  |
| B | 7660 | 7660 | 3332 | 3332 | 43.50% | 43.50% | 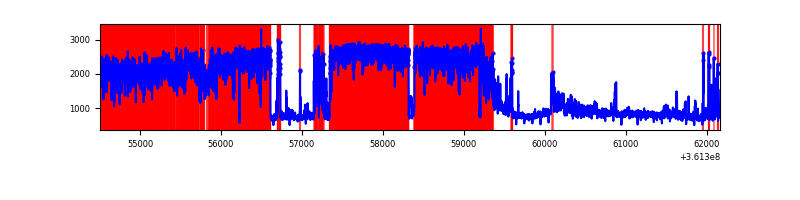 |
| C | 7661 | 7661 | 7 | 7 | 0.09% | 0.09% | 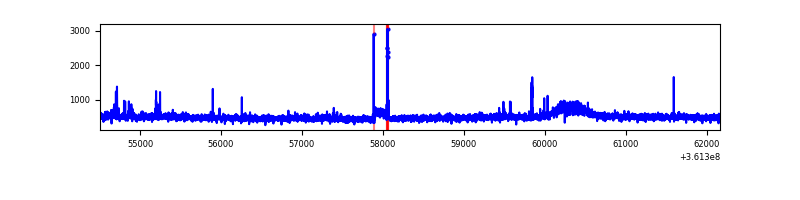 |
| D | 7661 | 7661 | 38 | 38 | 0.50% | 0.50% | 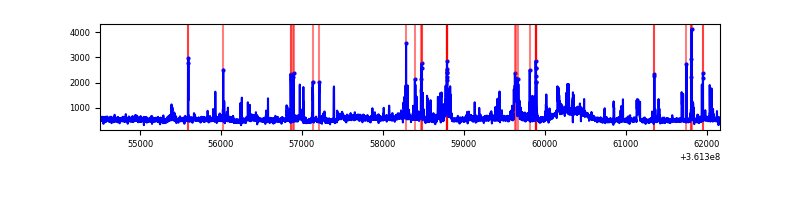 |
Top three noisy pixels from each quadrant. If the there are fewer than three noisy pixels in the level2.evt file, extra rows are filled as -1
| Pixel properties | Quadrant properties | ||||||
|---|---|---|---|---|---|---|---|
| Quadrant | DetID | PixID | Counts | Sigma | Mean | Median | Sigma |
| A | 0 | 13 | 799350 | 4102.55 | 958 | 938 | 194.6 |
| A | 12 | 96 | 16550 | 80.22 | 958 | 938 | 194.6 |
| A | 13 | 254 | 14167 | 67.98 | 958 | 938 | 194.6 |
| B | 6 | 36 | 7629640 | 50368.36 | 765 | 742 | 151.5 |
| B | 6 | 159 | 1722273 | 11366.08 | 765 | 742 | 151.5 |
| B | 5 | 172 | 154236 | 1013.42 | 765 | 742 | 151.5 |
| C | 14 | 238 | 148907 | 680.79 | 920 | 924 | 217.4 |
| C | 0 | 10 | 72539 | 329.46 | 920 | 924 | 217.4 |
| C | 3 | 233 | 56544 | 255.87 | 920 | 924 | 217.4 |
| D | 8 | 195 | 697379 | 3149.47 | 928 | 906 | 221.1 |
| D | 12 | 233 | 329084 | 1484.03 | 928 | 906 | 221.1 |
| D | 2 | 250 | 64335 | 286.83 | 928 | 906 | 221.1 |
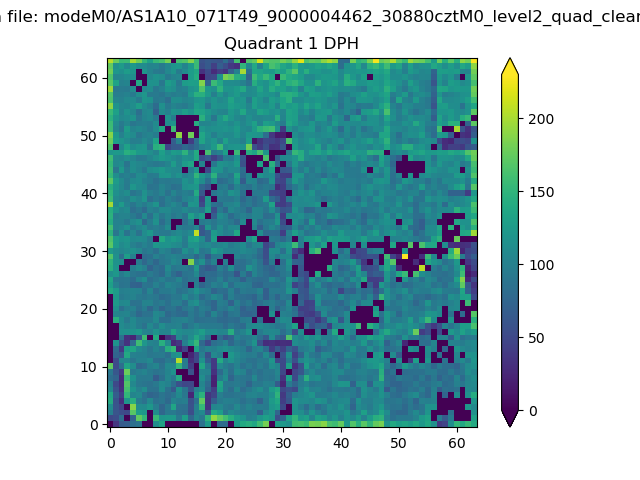
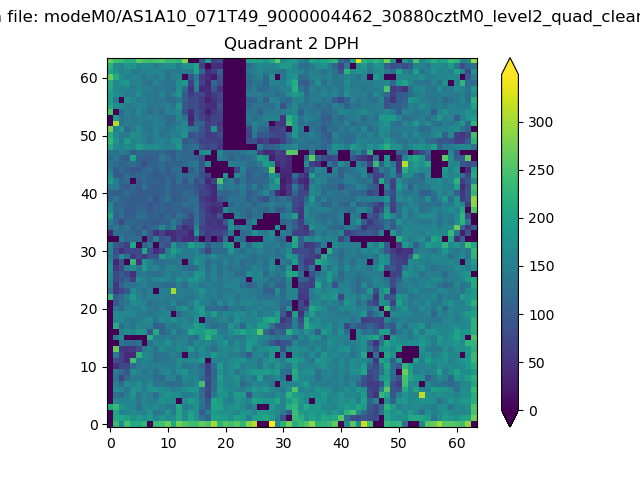
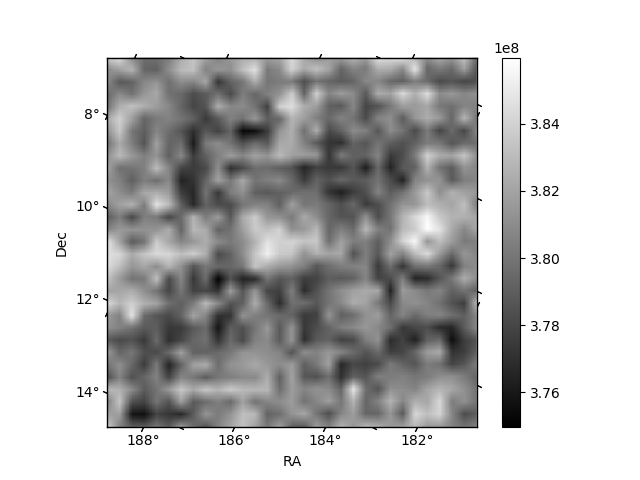
Histogram calculated using DETX and DETY for each event in the final _common_clean file
| Quadrant A | 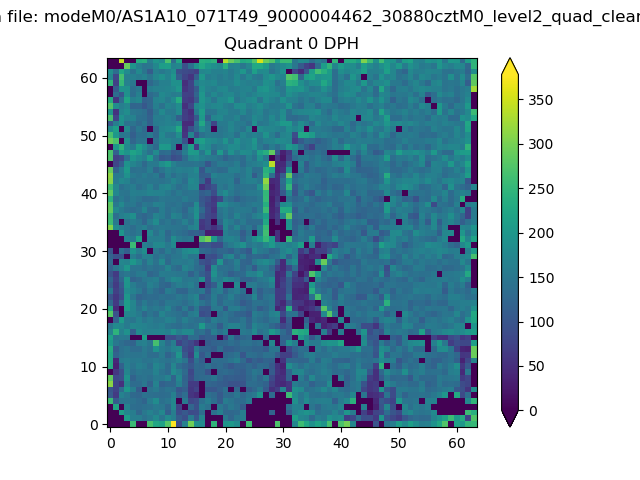 |
 |
Quadrant B |
|---|---|---|---|
| Quadrant D | 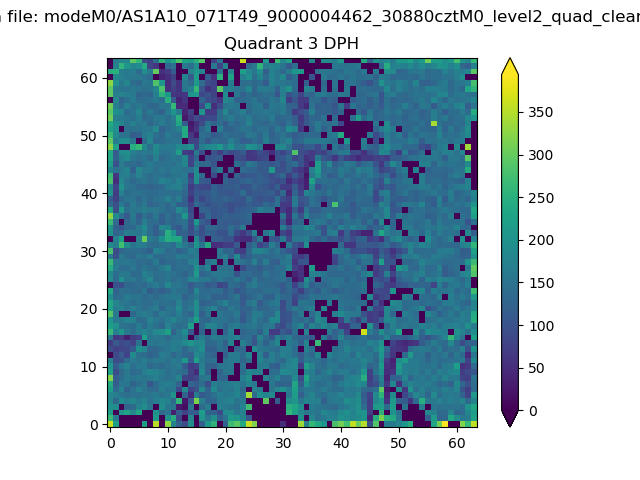 |
 |
Quadrant C |
| Plot type | Count rate plots | Images |
|---|---|---|
| Comparison with Poisson distribution Blue bars denote a histogram of data divided into 1 sec bins. Red curve is a Poisson curve with rate = median count rate of data. |
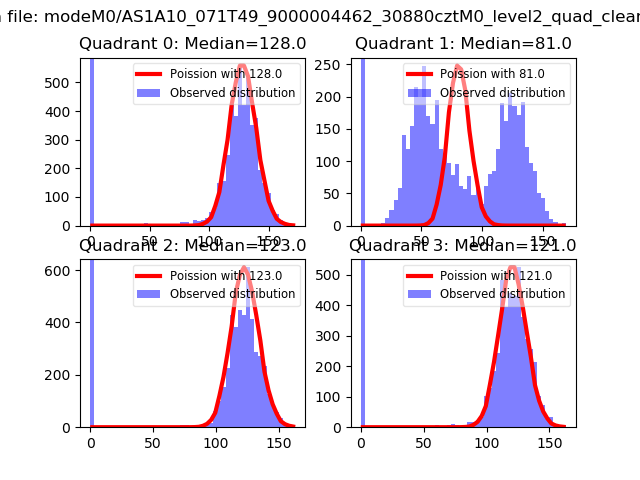 |
 |
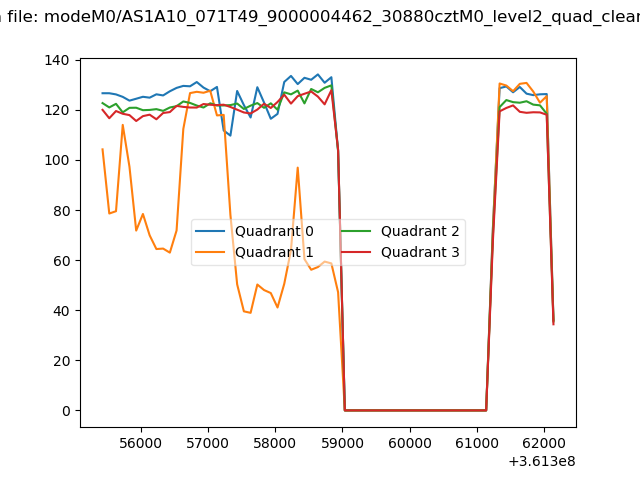
| Quadrant-wise count rates Data is divided into 100 sec bins |
 |
|
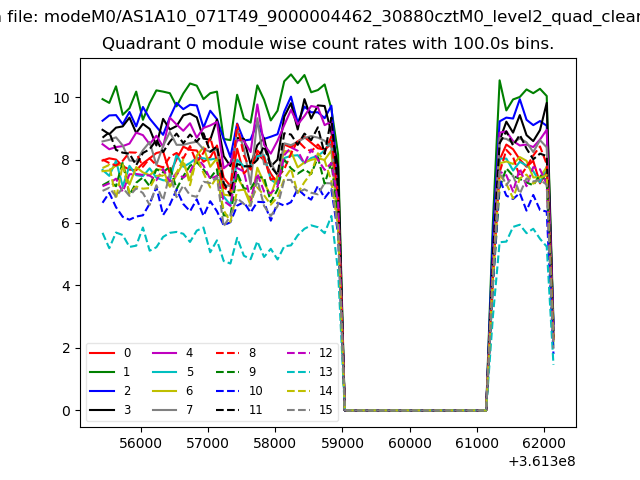
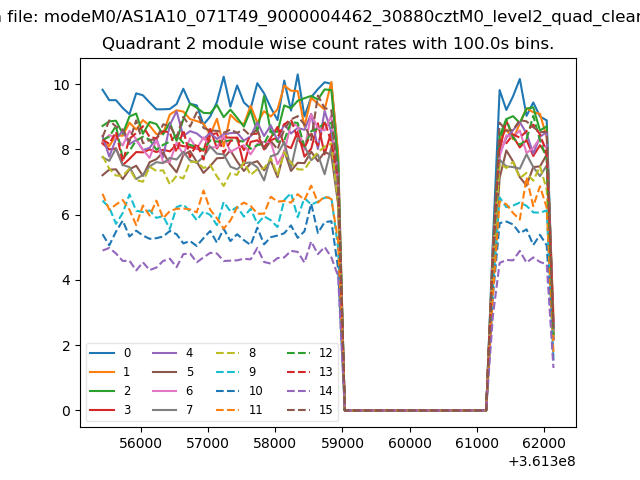
| Module-wise count rates for Quadrant A Data is divided into 100 sec bins |
 |
 |
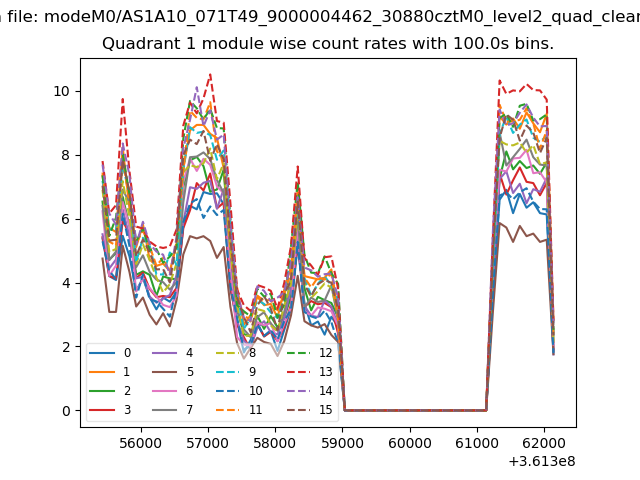
| Module-wise count rates for Quadrant B Data is divided into 100 sec bins |
 |
 |
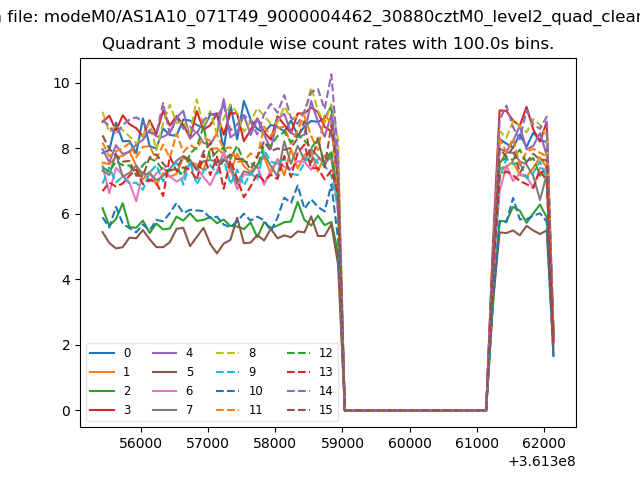
| Module-wise count rates for Quadrant C Data is divided into 100 sec bins |
 |
 |
| Module-wise count rates for Quadrant D Data is divided into 100 sec bins |
 |
 |
| Parameter | Plot |
|---|---|
| CZT HV Monitor | 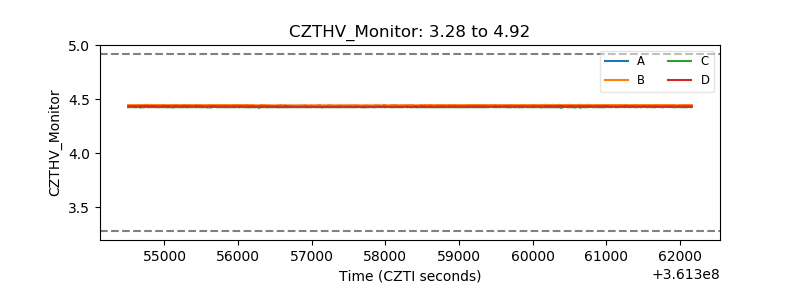 |
| D_VDD | 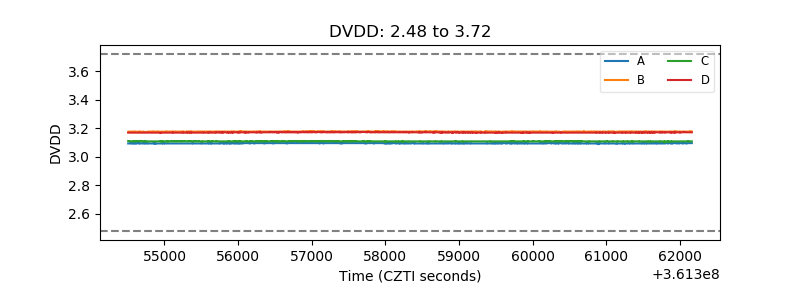 |
| Temperature 1 | 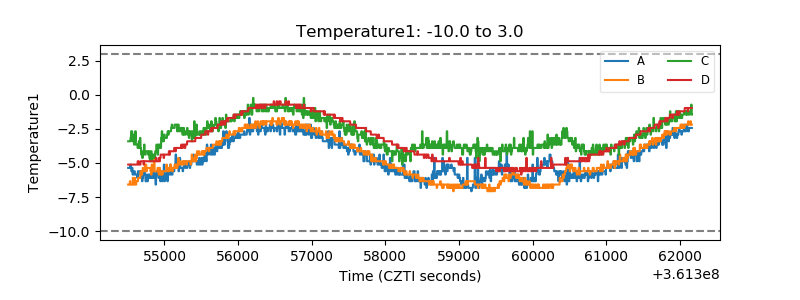 |
| Veto HV Monitor | 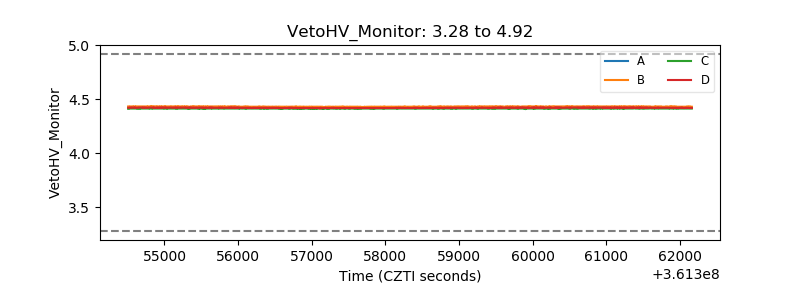 |
| Veto LLD | 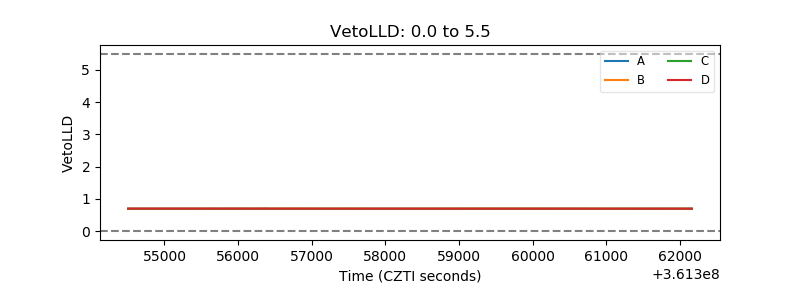 |
| Alpha Counter | 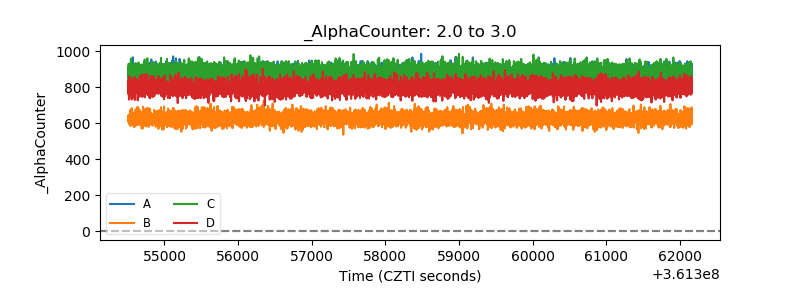 |
| _CPM_Rate | 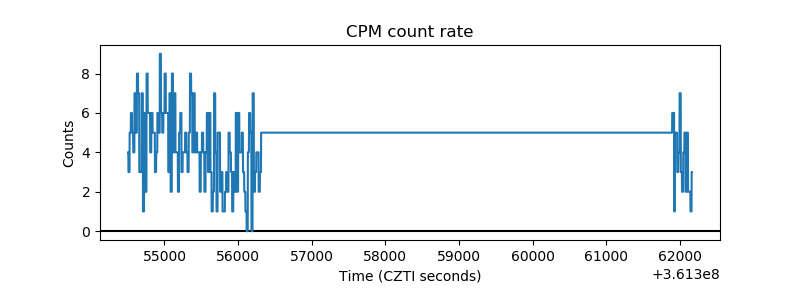 |
| CZT Counter | 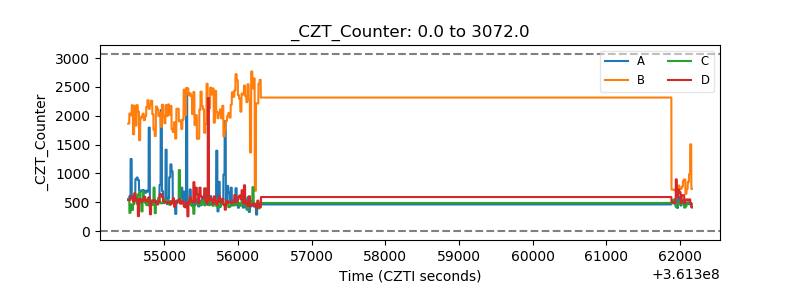 |
| +2.5 Volts monitor |  |
| +5 Volts monitor |  |
| _ROLL_ROT | 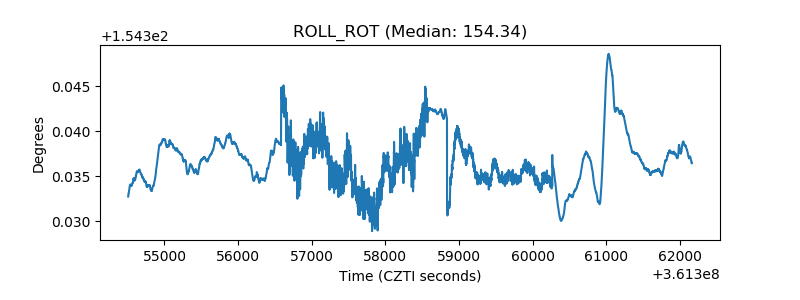 |
| _Roll_DEC | 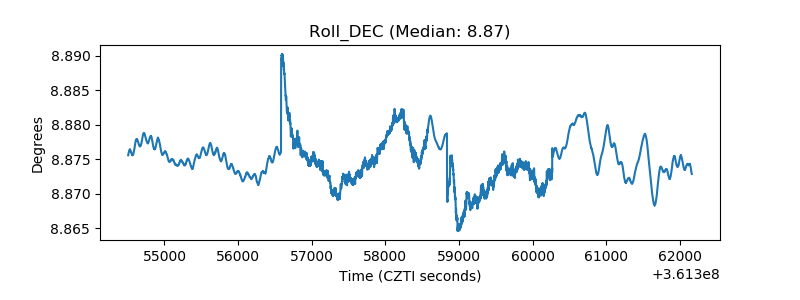 |
| _Roll_RA | 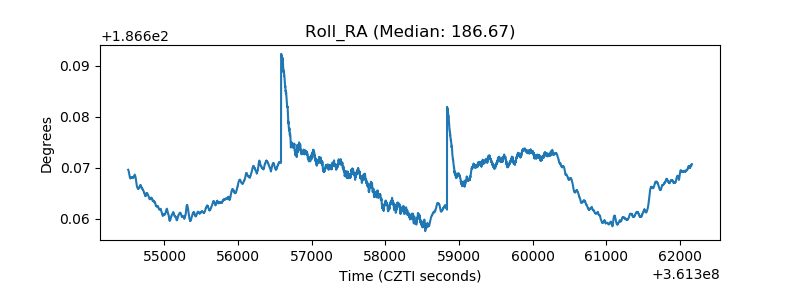 |
| Veto Counter | 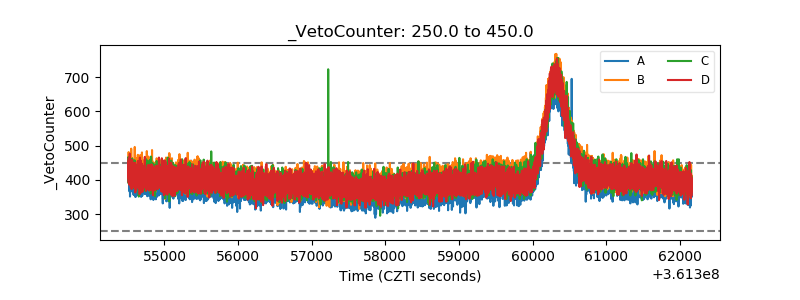 |