| Param | Original file | Final file |
|---|---|---|
| Filename | modeM0/AS1A10_071T49_9000004462_30881cztM0_level2.evt | modeM0/AS1A10_071T49_9000004462_30881cztM0_level2_quad_clean.evt |
| Size (bytes) | 303,845,760 | 63,878,400 |
| Size | 289.8 MB | 60.9 MB |
| Events in quadrant A | 1,781,722 | 427,478 |
| Events in quadrant B | 3,035,630 | 423,945 |
| Events in quadrant C | 1,789,426 | 408,056 |
| Events in quadrant D | 2,330,829 | 400,992 |
| Mode SS | |||
|---|---|---|---|
| Quadrant | BADHDUFLAG | Total packets | Discarded packets |
| A | 0 | 76 | 0 |
| B | 0 | 76 | 0 |
| C | 0 | 76 | 0 |
| D | 0 | 76 | 0 |
| Mode M0 | |||
|---|---|---|---|
| Quadrant | BADHDUFLAG | Total packets | Discarded packets |
| A | 0 | 7853 | 0 |
| B | 0 | 11981 | 0 |
| C | 0 | 7806 | 0 |
| D | 0 | 9310 | 0 |
| Quadrant | Total seconds | Saturated seconds | Saturation percentage |
|---|---|---|---|
| A | 3881 | 2 | 0.051533% |
| B | 3882 | 35 | 0.901597% |
| C | 3882 | 12 | 0.309119% |
| D | 3882 | 47 | 1.210716% |
Noise dominated data is calculated using 1-second bins in cleaned event files. If a bin has >2000 counts, and if more than 50% of those come from <1% of pixels, then it is considered to be noise-dominated and hence unusable.
| Quadrant | # 1 sec bins | Bins with >0 counts | Bins with >2000 counts | High rate bins dominated by noise | Noise dominated (total time) | Noise dominated (detector-on time) | Marked lightcurve |
|---|---|---|---|---|---|---|---|
| A | 3881 | 3881 | 0 | 0 | 0.00% | 0.00% |  |
| B | 3882 | 3882 | 17 | 17 | 0.44% | 0.44% |  |
| C | 3882 | 3882 | 0 | 0 | 0.00% | 0.00% |  |
| D | 3882 | 3882 | 50 | 50 | 1.29% | 1.29% |  |
Top three noisy pixels from each quadrant. If the there are fewer than three noisy pixels in the level2.evt file, extra rows are filled as -1
| Pixel properties | Quadrant properties | ||||||
|---|---|---|---|---|---|---|---|
| Quadrant | DetID | PixID | Counts | Sigma | Mean | Median | Sigma |
| A | 12 | 96 | 14159 | 147.18 | 456 | 447 | 93.2 |
| A | 13 | 254 | 6858 | 68.81 | 456 | 447 | 93.2 |
| A | 8 | 255 | 5582 | 55.12 | 456 | 447 | 93.2 |
| B | 6 | 159 | 1060351 | 12083.57 | 447 | 436 | 87.7 |
| B | 4 | 171 | 57645 | 652.21 | 447 | 436 | 87.7 |
| B | 6 | 36 | 48860 | 552.05 | 447 | 436 | 87.7 |
| C | 14 | 238 | 69397 | 660.51 | 434 | 437 | 104.4 |
| C | 3 | 233 | 10566 | 97.02 | 434 | 437 | 104.4 |
| C | 2 | 114 | 8665 | 78.81 | 434 | 437 | 104.4 |
| D | 8 | 195 | 371923 | 3520.61 | 437 | 427 | 105.5 |
| D | 12 | 233 | 186390 | 1762.34 | 437 | 427 | 105.5 |
| D | 1 | 52 | 37186 | 348.36 | 437 | 427 | 105.5 |
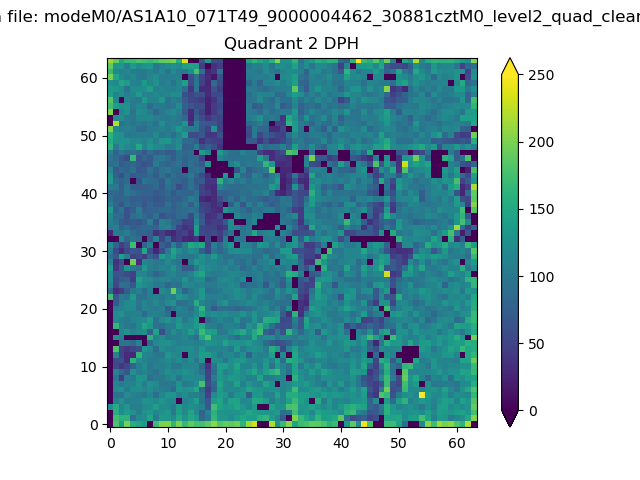
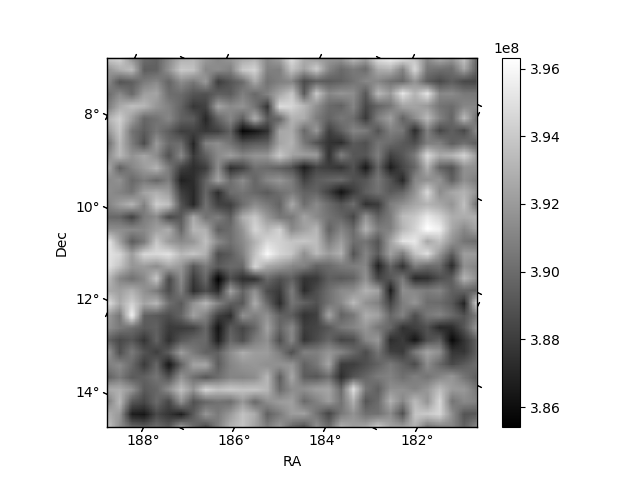
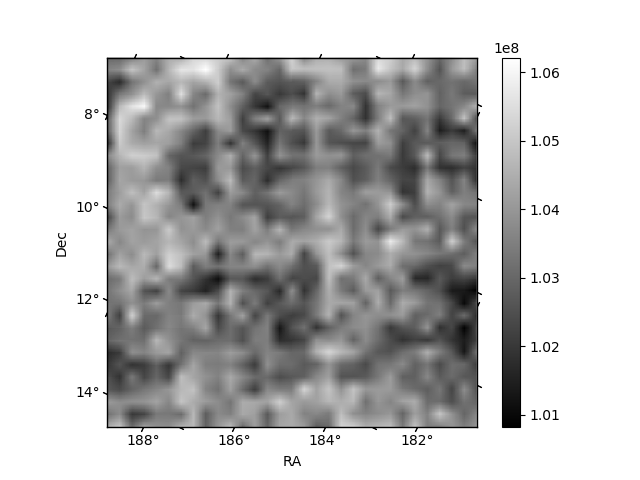
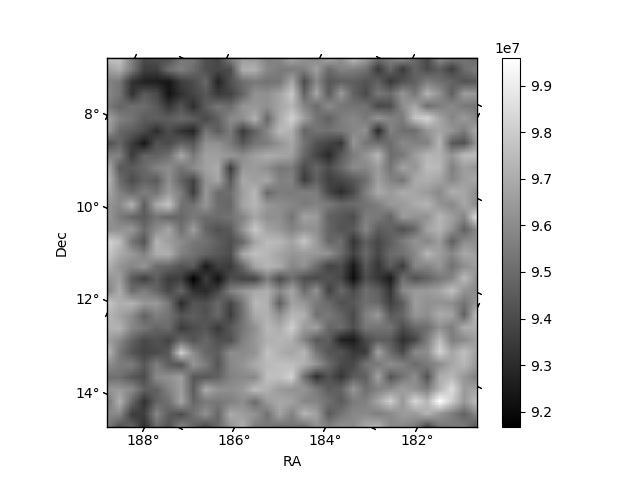
Histogram calculated using DETX and DETY for each event in the final _common_clean file
| Quadrant A |  |
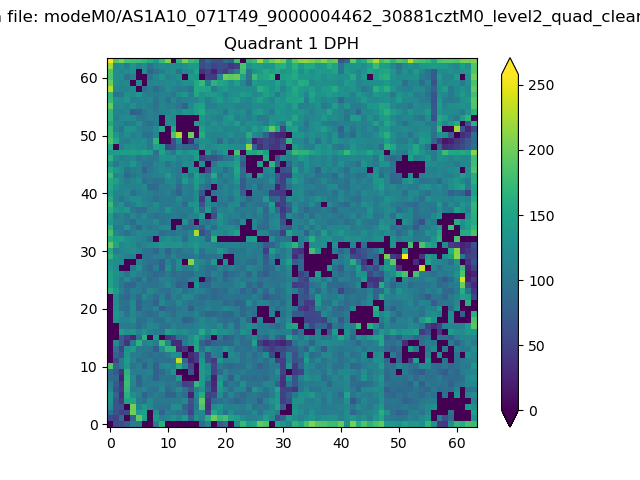 |
Quadrant B |
|---|---|---|---|
| Quadrant D | 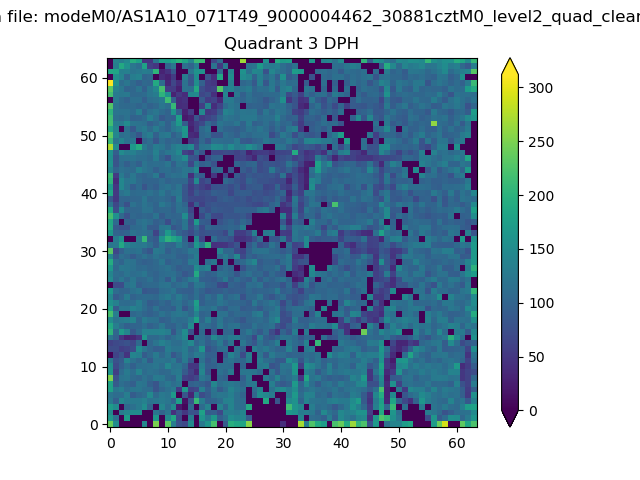 |
 |
Quadrant C |
| Plot type | Count rate plots | Images |
|---|---|---|
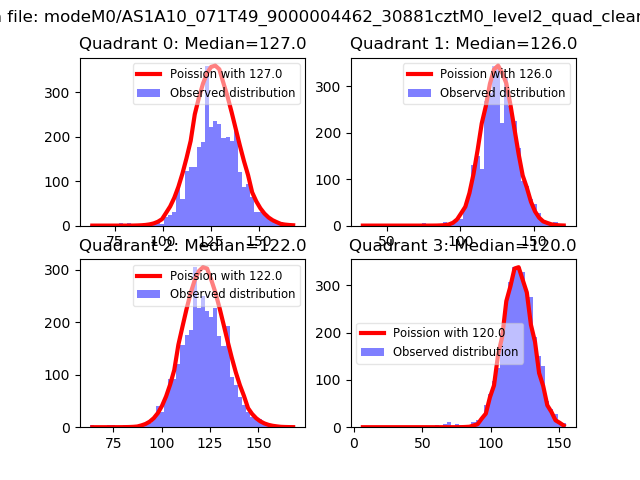
| Comparison with Poisson distribution Blue bars denote a histogram of data divided into 1 sec bins. Red curve is a Poisson curve with rate = median count rate of data. |
 |
 |
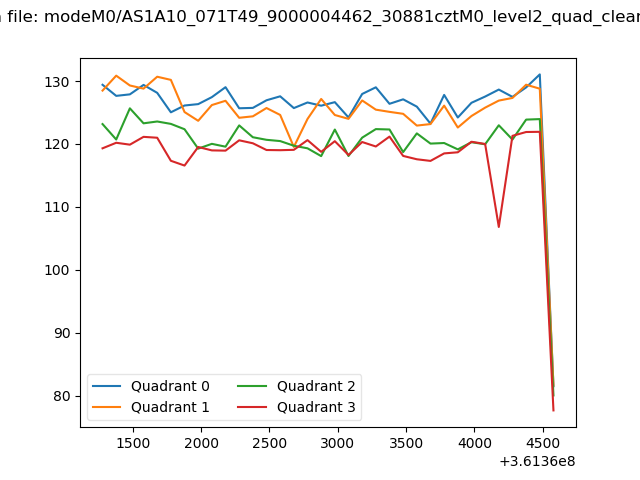
| Quadrant-wise count rates Data is divided into 100 sec bins |
 |
|
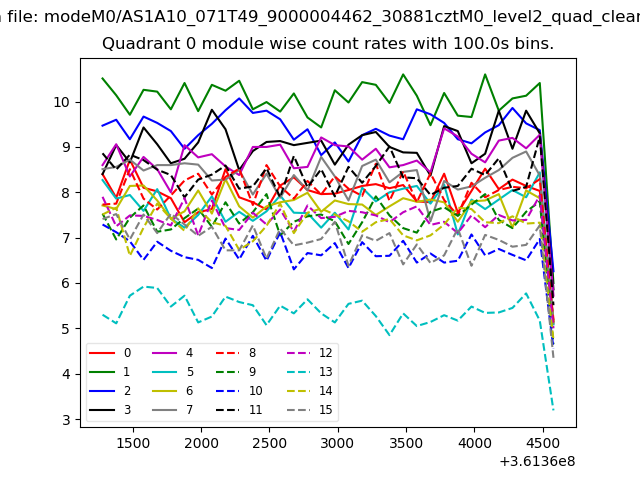
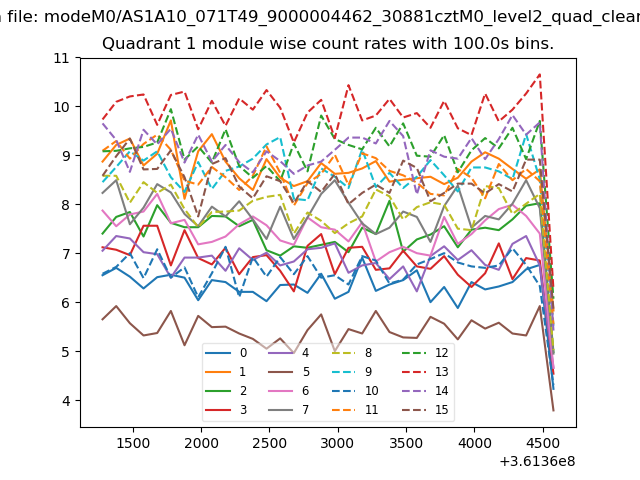
| Module-wise count rates for Quadrant A Data is divided into 100 sec bins |
 |
 |
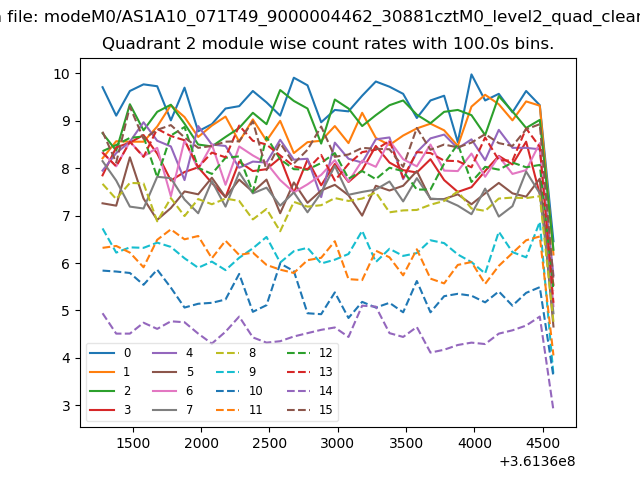
| Module-wise count rates for Quadrant B Data is divided into 100 sec bins |
 |
 |
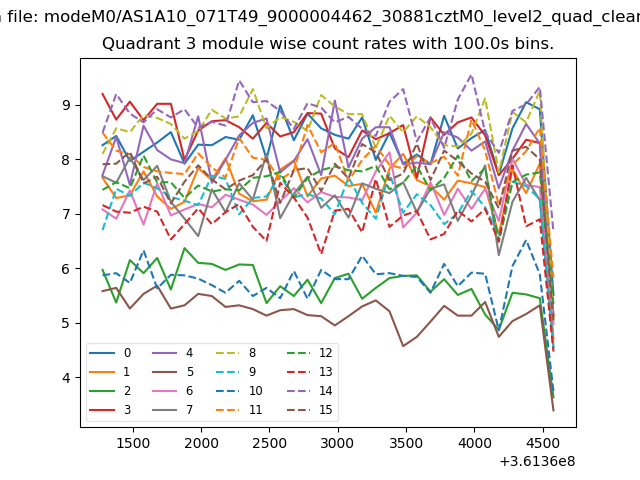
| Module-wise count rates for Quadrant C Data is divided into 100 sec bins |
 |
 |
| Module-wise count rates for Quadrant D Data is divided into 100 sec bins |
 |
 |
| Parameter | Plot |
|---|---|
| CZT HV Monitor | 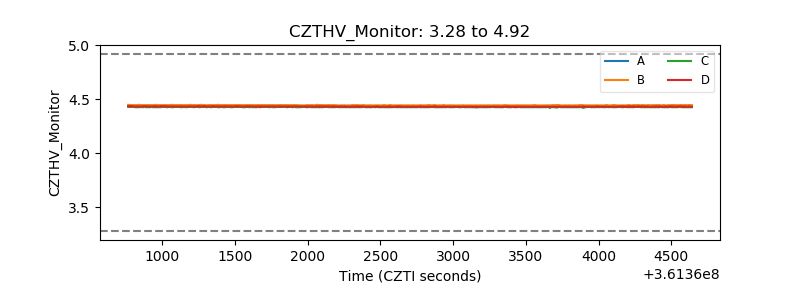 |
| D_VDD | 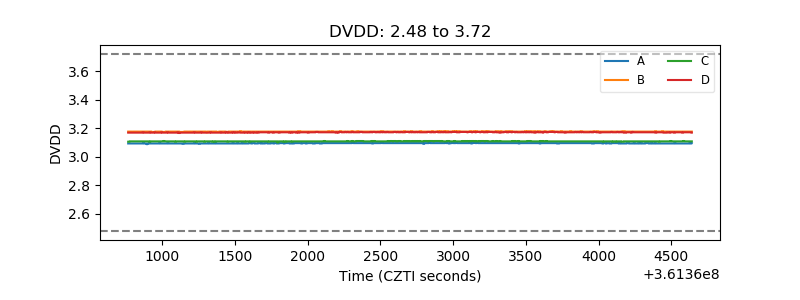 |
| Temperature 1 | 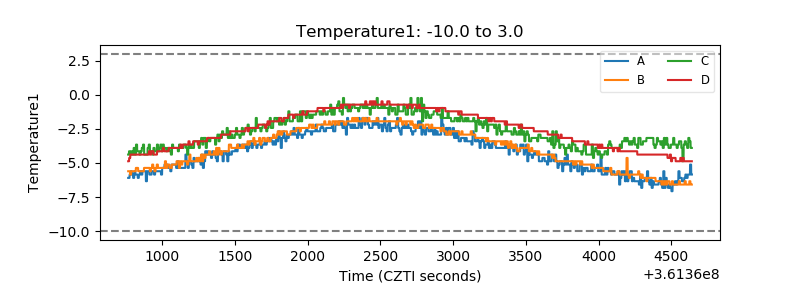 |
| Veto HV Monitor | 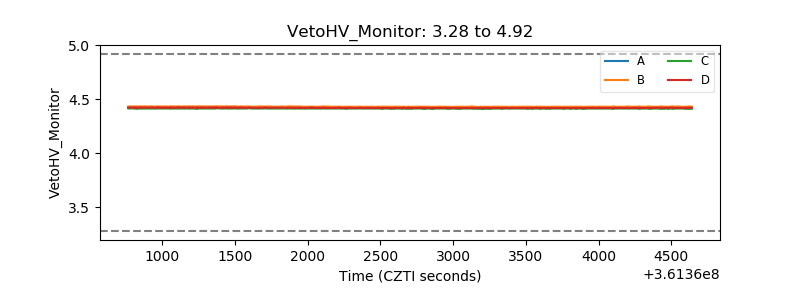 |
| Veto LLD | 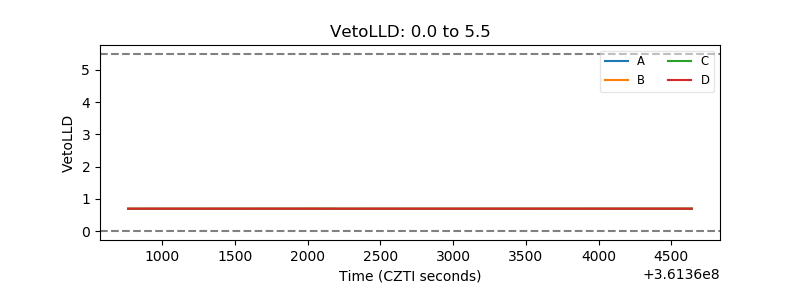 |
| Alpha Counter |  |
| _CPM_Rate |  |
| CZT Counter | 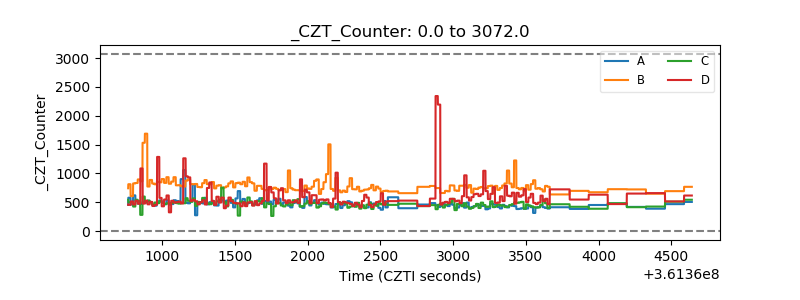 |
| +2.5 Volts monitor |  |
| +5 Volts monitor | 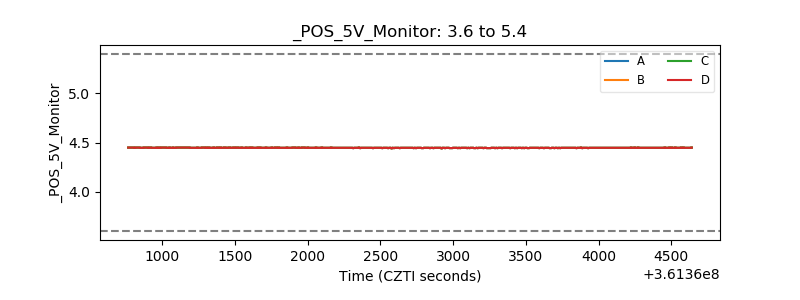 |
| _ROLL_ROT | 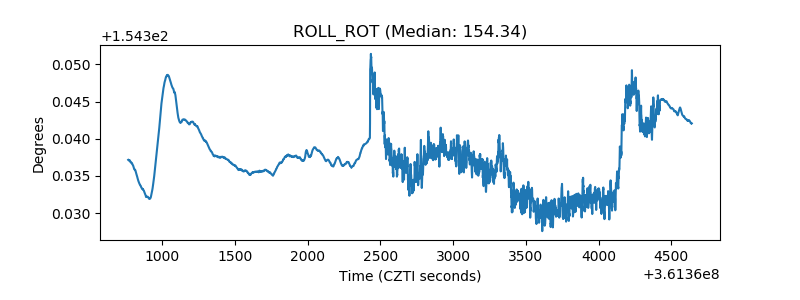 |
| _Roll_DEC | 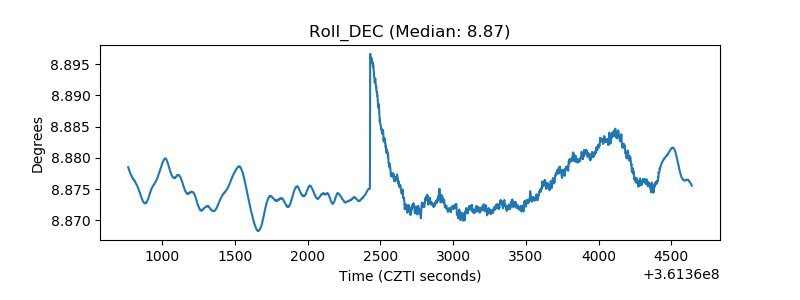 |
| _Roll_RA | 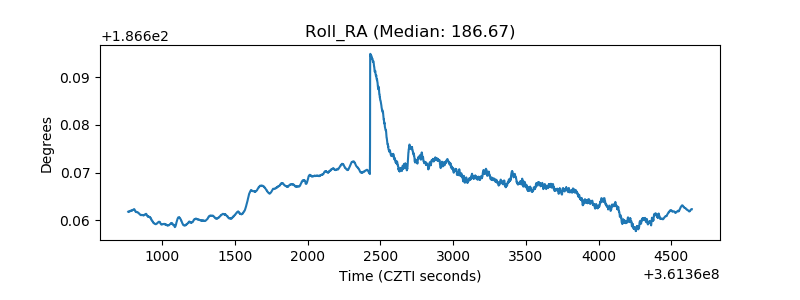 |
| Veto Counter | 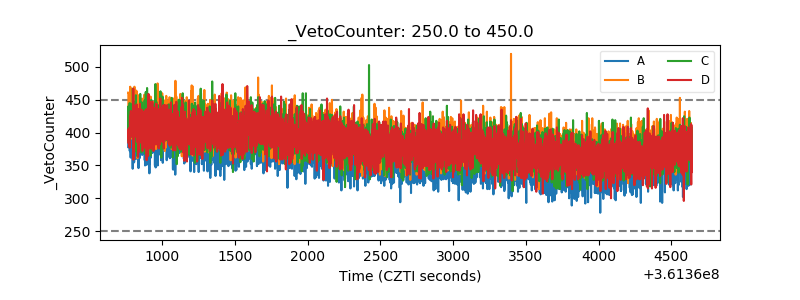 |