| Param | Original file | Final file |
|---|---|---|
| Filename | modeM0/AS1A10_071T28_9000004464cztM0_level2.fits | modeM0/AS1A10_071T28_9000004464cztM0_level2_quad_clean.evt |
| Size (bytes) | 701,049,600 | 518,636,160 |
| Size | 668.6 MB | 494.6 MB |
| Events in quadrant A | 4,433,662 | 2,914,760 |
| Events in quadrant B | 4,137,772 | 2,828,317 |
| Events in quadrant C | 4,200,970 | 2,706,287 |
| Events in quadrant D | 3,660,736 | 2,458,427 |
| Mode M9 | |||
|---|---|---|---|
| Quadrant | BADHDUFLAG | Total packets | Discarded packets |
| A | 0 | 112 | 0 |
| B | 0 | 112 | 0 |
| C | 0 | 112 | 0 |
| D | 0 | 112 | 0 |
| Mode M0 | |||
|---|---|---|---|
| Quadrant | BADHDUFLAG | Total packets | Discarded packets |
| A | 0 | 146292 | 0 |
| B | 0 | 229928 | 0 |
| C | 0 | 152775 | 0 |
| D | 0 | 187063 | 0 |
| Mode SS | |||
|---|---|---|---|
| Quadrant | BADHDUFLAG | Total packets | Discarded packets |
| A | 0 | 1430 | 0 |
| B | 0 | 1430 | 0 |
| C | 0 | 1430 | 0 |
| D | 0 | 1430 | 0 |
| Quadrant | Total seconds | Saturated seconds | Saturation percentage |
|---|---|---|---|
| A | 69932 | 972 | 1.389922% |
| B | 69932 | 2935 | 4.196934% |
| C | 69932 | 2116 | 3.025796% |
| D | 69931 | 2144 | 3.065879% |
Noise dominated data is calculated using 1-second bins in cleaned event files. If a bin has >2000 counts, and if more than 50% of those come from <1% of pixels, then it is considered to be noise-dominated and hence unusable.
| Quadrant | # 1 sec bins | Bins with >0 counts | Bins with >2000 counts | High rate bins dominated by noise | Noise dominated (total time) | Noise dominated (detector-on time) | Marked lightcurve |
|---|---|---|---|---|---|---|---|
| A | 81397 | 69922 | 0 | 0 | 0.00% | 0.00% | 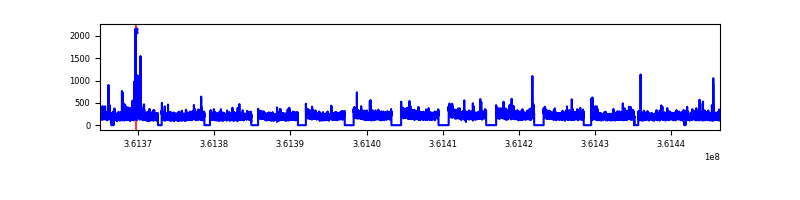 |
| B | 81397 | 69917 | 0 | 0 | 0.00% | 0.00% |  |
| C | 81397 | 69911 | 0 | 0 | 0.00% | 0.00% | 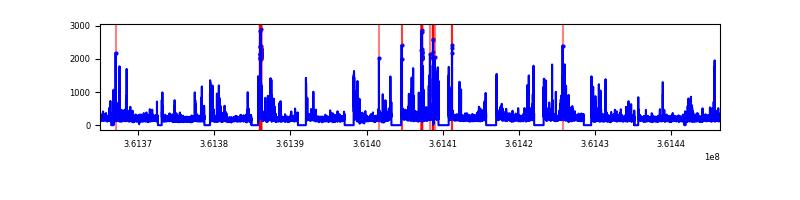 |
| D | 81397 | 69906 | 0 | 0 | 0.00% | 0.00% |  |
Top three noisy pixels from each quadrant. If the there are fewer than three noisy pixels in the level2.evt file, extra rows are filled as -1
| Pixel properties | Quadrant properties | ||||||
|---|---|---|---|---|---|---|---|
| Quadrant | DetID | PixID | Counts | Sigma | Mean | Median | Sigma |
| A | 0 | 29 | 3634 | 9.05 | 1156 | 1089 | 281.1 |
| A | 7 | 110 | 3500 | 8.58 | 1156 | 1089 | 281.1 |
| A | 9 | 19 | 3202 | 7.52 | 1156 | 1089 | 281.1 |
| B | 2 | 9 | 3192 | 10.14 | 1093 | 1045 | 211.7 |
| B | 5 | 225 | 2766 | 8.13 | 1093 | 1045 | 211.7 |
| B | 5 | 128 | 2750 | 8.05 | 1093 | 1045 | 211.7 |
| C | 9 | 209 | 2932 | 6.66 | 1112 | 1041 | 283.8 |
| C | 12 | 241 | 2869 | 6.44 | 1112 | 1041 | 283.8 |
| C | 3 | 187 | 2844 | 6.35 | 1112 | 1041 | 283.8 |
| D | 7 | 3 | 2584 | 5.79 | 1047 | 953 | 281.6 |
| D | 15 | 46 | 2565 | 5.72 | 1047 | 953 | 281.6 |
| D | 6 | 67 | 2548 | 5.66 | 1047 | 953 | 281.6 |
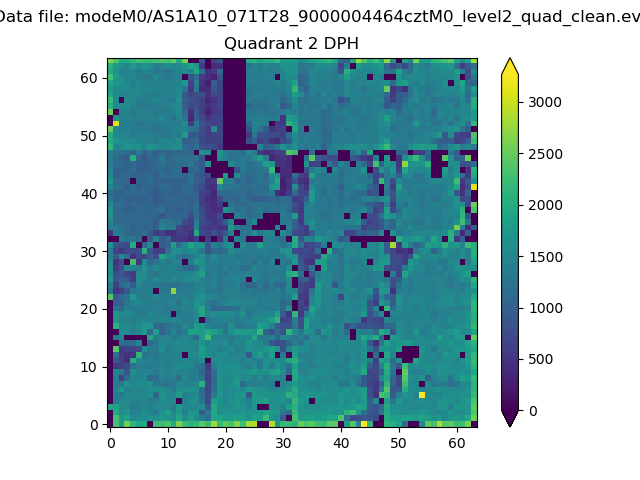
Histogram calculated using DETX and DETY for each event in the final _common_clean file
| Quadrant A | 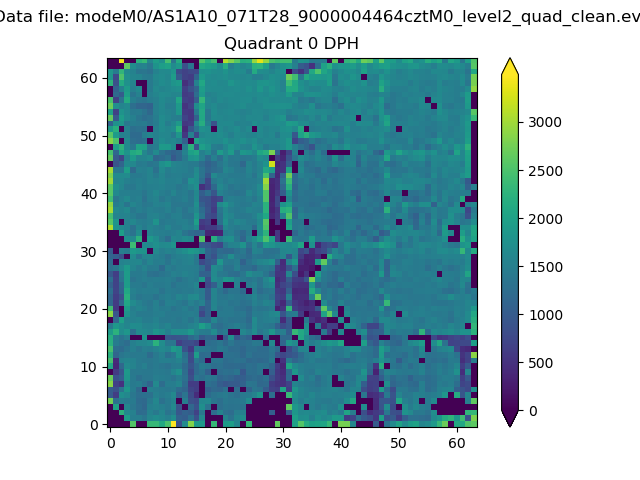 |
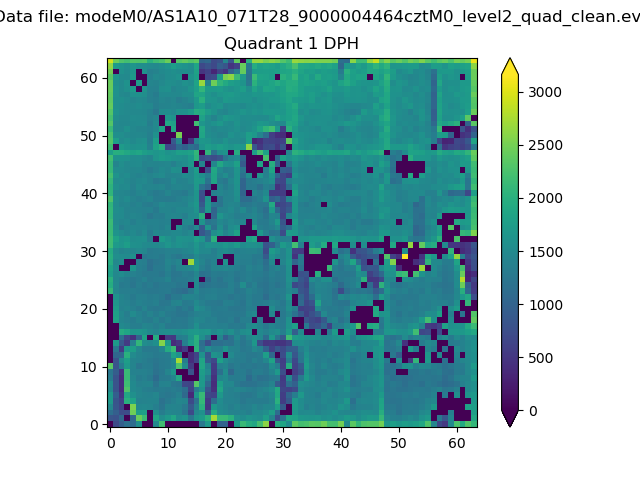 |
Quadrant B |
|---|---|---|---|
| Quadrant D |  |
 |
Quadrant C |
| Plot type | Count rate plots | Images |
|---|---|---|
| Comparison with Poisson distribution Blue bars denote a histogram of data divided into 1 sec bins. Red curve is a Poisson curve with rate = median count rate of data. |
 |
 |
| Quadrant-wise count rates Data is divided into 100 sec bins |
 |
|
| Module-wise count rates for Quadrant A Data is divided into 100 sec bins |
 |
 |
| Module-wise count rates for Quadrant B Data is divided into 100 sec bins |
 |
 |
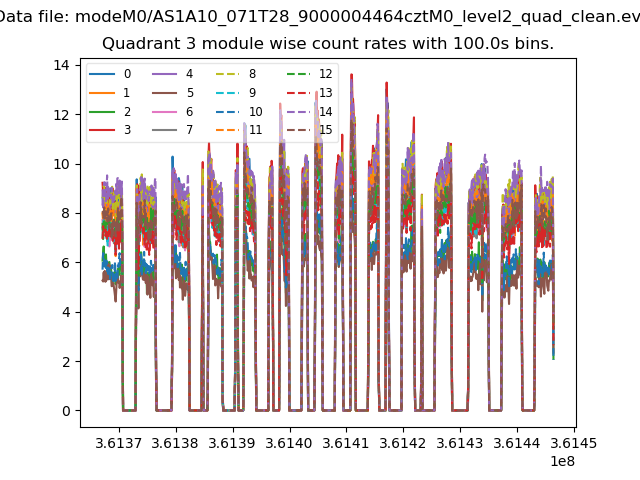
| Module-wise count rates for Quadrant C Data is divided into 100 sec bins |
 |
 |
| Module-wise count rates for Quadrant D Data is divided into 100 sec bins |
 |
 |
| Parameter | Plot |
|---|---|
| CZT HV Monitor |  |
| D_VDD |  |
| Temperature 1 |  |
| Veto HV Monitor |  |
| Veto LLD |  |
| Alpha Counter |  |
| _CPM_Rate |  |
| CZT Counter | 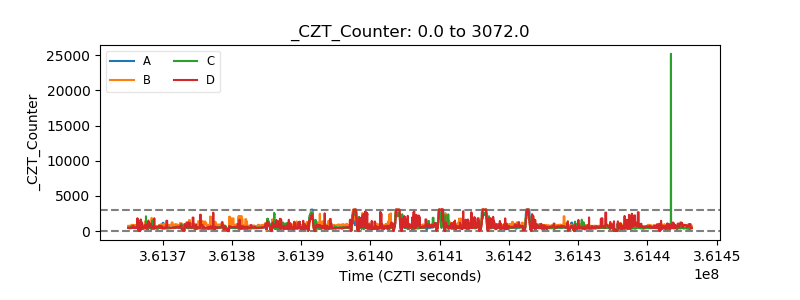 |
| +2.5 Volts monitor |  |
| +5 Volts monitor |  |
| _ROLL_ROT | 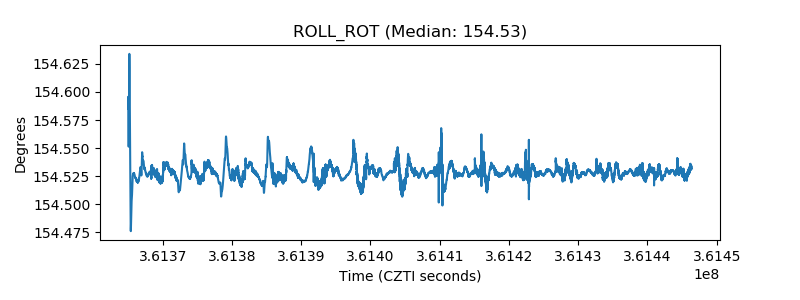 |
| _Roll_DEC |  |
| _Roll_RA |  |
| Veto Counter | 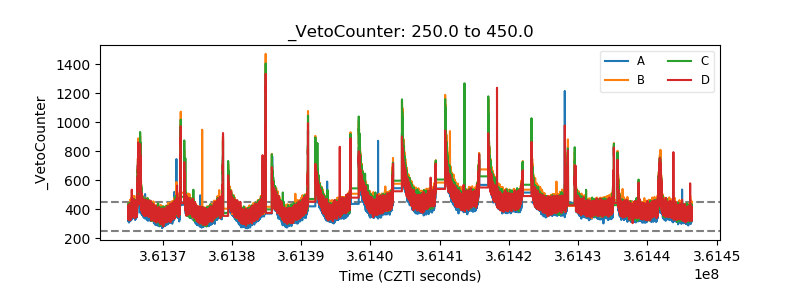 |