| Param | Original file | Final file |
|---|---|---|
| Filename | modeM0/AS1A10_071T28_9000004464_30883cztM0_level2.evt | modeM0/AS1A10_071T28_9000004464_30883cztM0_level2_quad_clean.evt |
| Size (bytes) | 891,247,680 | 138,015,360 |
| Size | 850.0 MB | 131.6 MB |
| Events in quadrant A | 5,051,663 | 895,431 |
| Events in quadrant B | 9,484,320 | 881,589 |
| Events in quadrant C | 4,944,683 | 851,658 |
| Events in quadrant D | 6,815,631 | 837,595 |
| Mode M9 | |||
|---|---|---|---|
| Quadrant | BADHDUFLAG | Total packets | Discarded packets |
| A | 0 | 5 | 0 |
| B | 0 | 5 | 0 |
| C | 0 | 5 | 0 |
| D | 0 | 5 | 0 |
| Mode M0 | |||
|---|---|---|---|
| Quadrant | BADHDUFLAG | Total packets | Discarded packets |
| A | 0 | 21696 | 1 |
| B | 0 | 35505 | 1 |
| C | 0 | 21256 | 1 |
| D | 0 | 26797 | 1 |
| Mode SS | |||
|---|---|---|---|
| Quadrant | BADHDUFLAG | Total packets | Discarded packets |
| A | 0 | 208 | 0 |
| B | 0 | 208 | 0 |
| C | 0 | 208 | 0 |
| D | 0 | 208 | 0 |
| Quadrant | Total seconds | Saturated seconds | Saturation percentage |
|---|---|---|---|
| A | 10300 | 104 | 1.009709% |
| B | 10301 | 324 | 3.145326% |
| C | 10301 | 149 | 1.446462% |
| D | 10301 | 304 | 2.951170% |
Noise dominated data is calculated using 1-second bins in cleaned event files. If a bin has >2000 counts, and if more than 50% of those come from <1% of pixels, then it is considered to be noise-dominated and hence unusable.
| Quadrant | # 1 sec bins | Bins with >0 counts | Bins with >2000 counts | High rate bins dominated by noise | Noise dominated (total time) | Noise dominated (detector-on time) | Marked lightcurve |
|---|---|---|---|---|---|---|---|
| A | 10805 | 10300 | 14 | 14 | 0.13% | 0.14% | 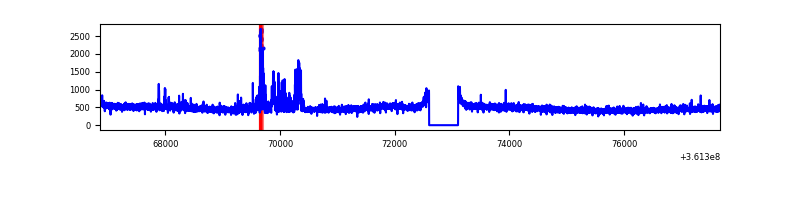 |
| B | 10806 | 10301 | 57 | 57 | 0.53% | 0.55% | 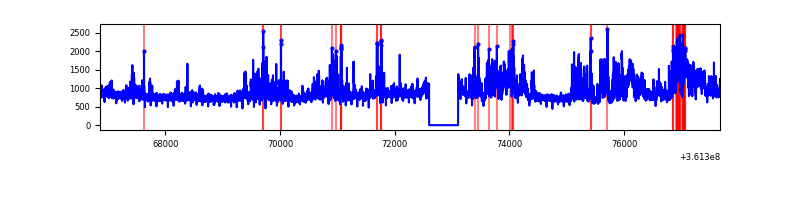 |
| C | 10806 | 10301 | 3 | 3 | 0.03% | 0.03% | 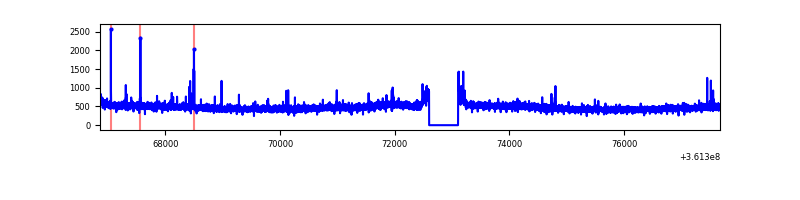 |
| D | 10806 | 10301 | 190 | 190 | 1.76% | 1.84% | 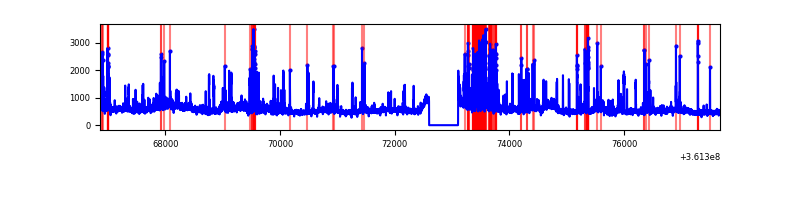 |
Top three noisy pixels from each quadrant. If the there are fewer than three noisy pixels in the level2.evt file, extra rows are filled as -1
| Pixel properties | Quadrant properties | ||||||
|---|---|---|---|---|---|---|---|
| Quadrant | DetID | PixID | Counts | Sigma | Mean | Median | Sigma |
| A | 0 | 31 | 274501 | 1097.59 | 1237 | 1212 | 249.0 |
| A | 13 | 254 | 18584 | 69.77 | 1237 | 1212 | 249.0 |
| A | 3 | 137 | 12919 | 47.02 | 1237 | 1212 | 249.0 |
| B | 6 | 159 | 2851894 | 12142.83 | 1216 | 1186 | 234.8 |
| B | 6 | 36 | 1591777 | 6775.26 | 1216 | 1186 | 234.8 |
| B | 0 | 190 | 99858 | 420.3 | 1216 | 1186 | 234.8 |
| C | 14 | 238 | 197281 | 701.95 | 1179 | 1185 | 279.4 |
| C | 0 | 10 | 42905 | 149.34 | 1179 | 1185 | 279.4 |
| C | 3 | 233 | 42871 | 149.22 | 1179 | 1185 | 279.4 |
| D | 8 | 195 | 1073290 | 3828.14 | 1183 | 1154 | 280.1 |
| D | 12 | 233 | 673245 | 2399.75 | 1183 | 1154 | 280.1 |
| D | 1 | 52 | 329523 | 1172.47 | 1183 | 1154 | 280.1 |
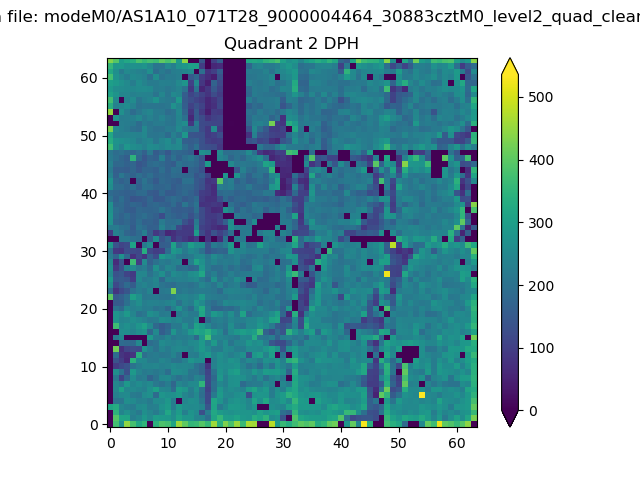
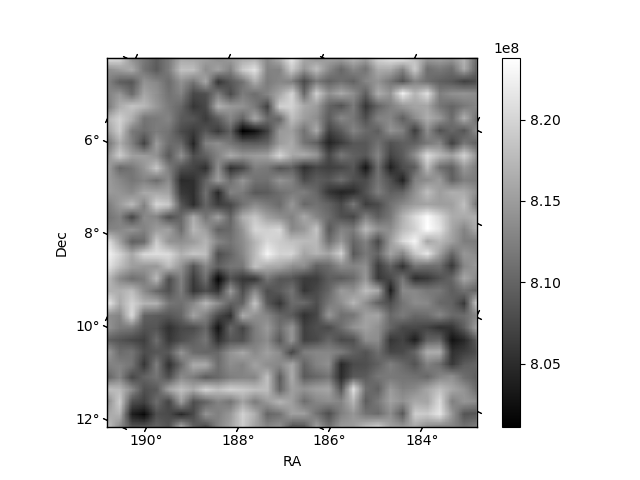
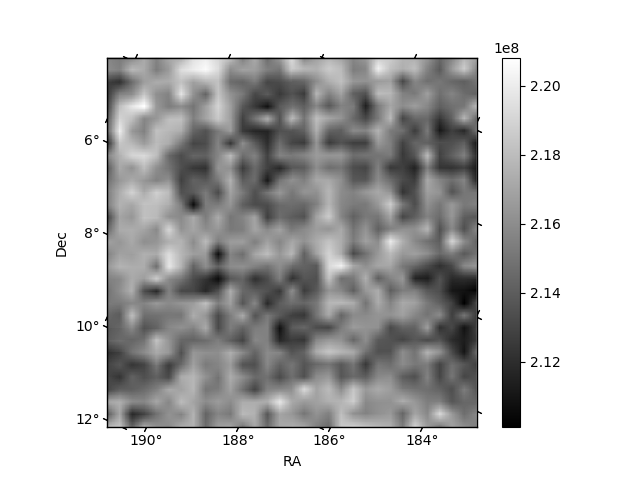
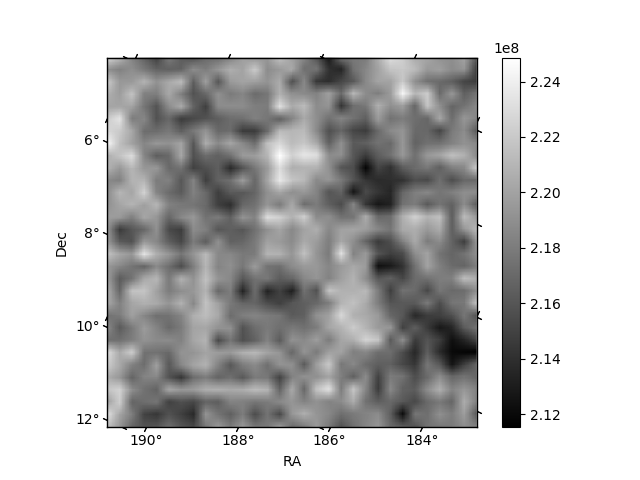
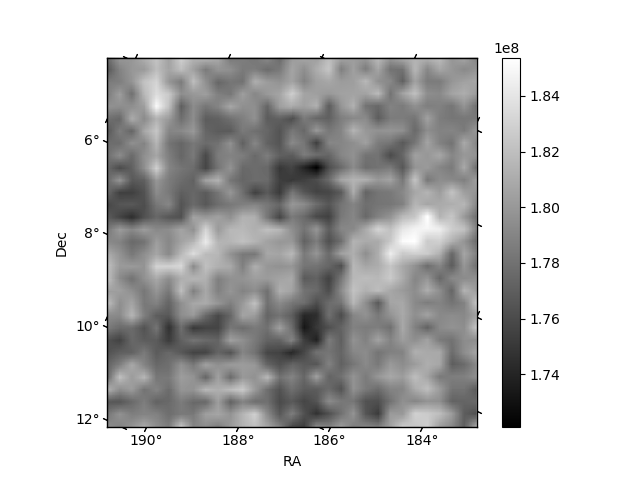
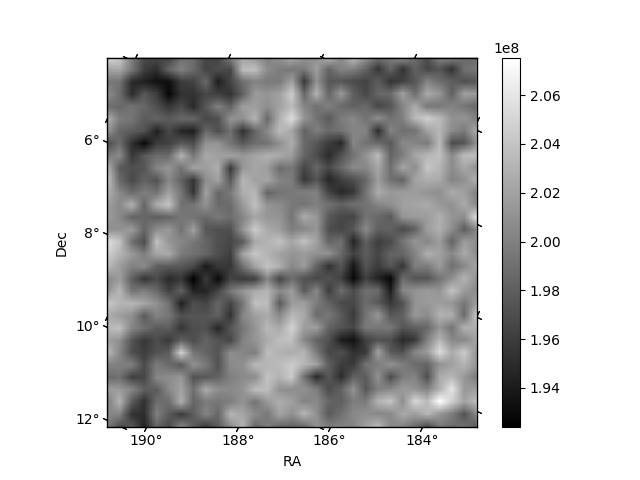
Histogram calculated using DETX and DETY for each event in the final _common_clean file
| Quadrant A | 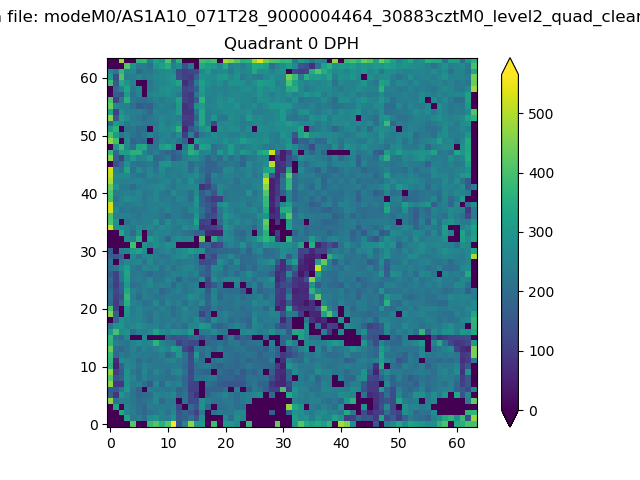 |
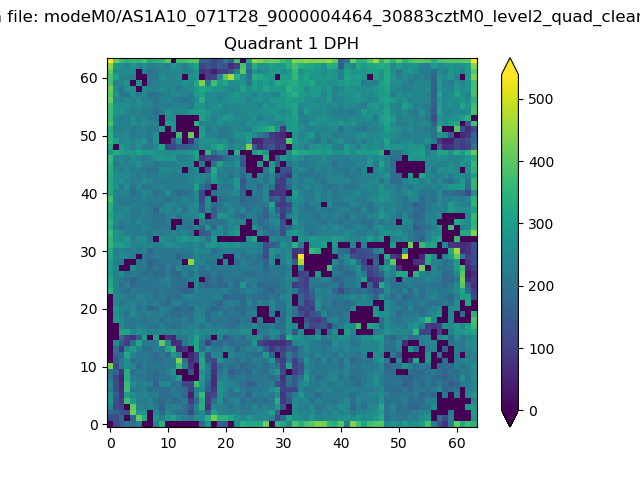 |
Quadrant B |
|---|---|---|---|
| Quadrant D | 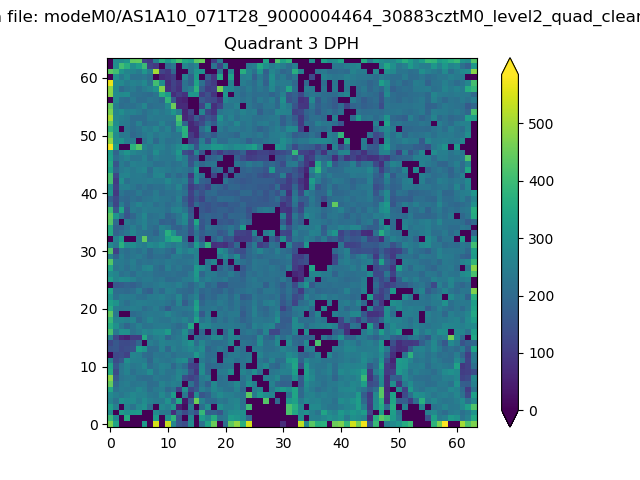 |
 |
Quadrant C |
| Plot type | Count rate plots | Images |
|---|---|---|
| Comparison with Poisson distribution Blue bars denote a histogram of data divided into 1 sec bins. Red curve is a Poisson curve with rate = median count rate of data. |
 |
 |
| Quadrant-wise count rates Data is divided into 100 sec bins |
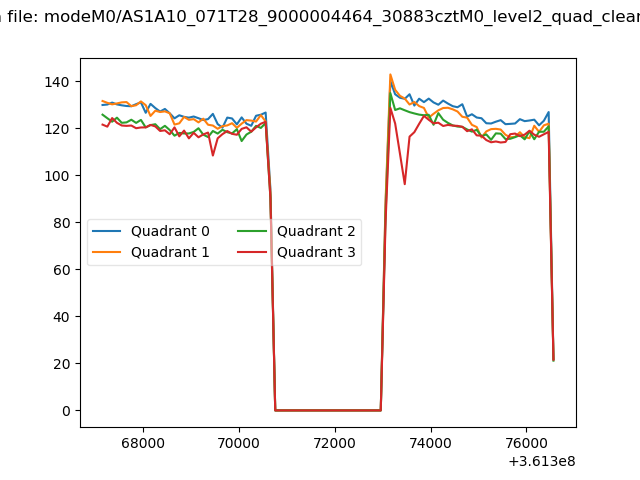 |
|
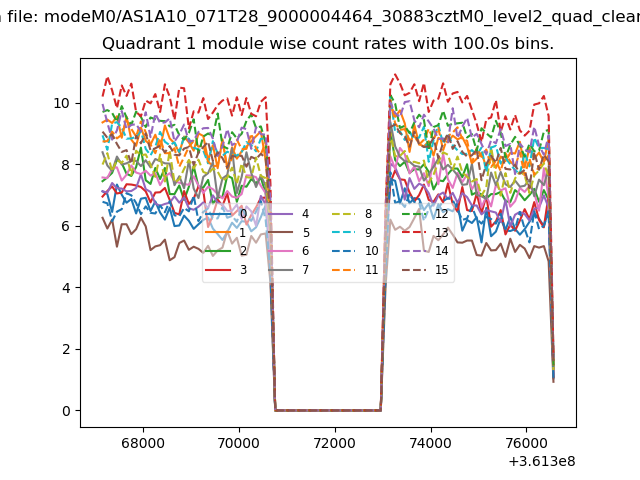
| Module-wise count rates for Quadrant A Data is divided into 100 sec bins |
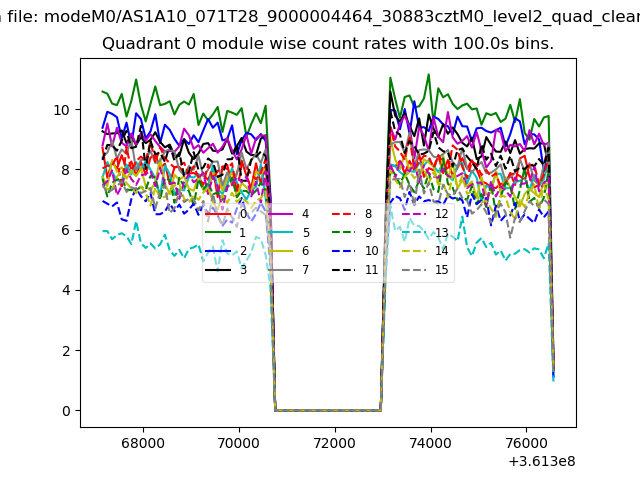 |
 |
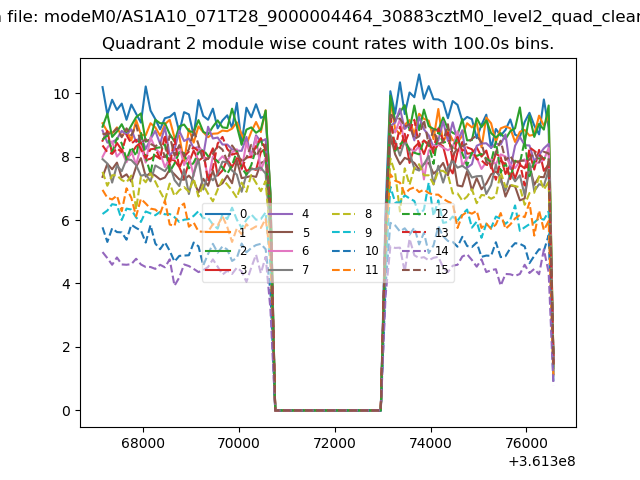
| Module-wise count rates for Quadrant B Data is divided into 100 sec bins |
 |
 |
| Module-wise count rates for Quadrant C Data is divided into 100 sec bins |
 |
 |
| Module-wise count rates for Quadrant D Data is divided into 100 sec bins |
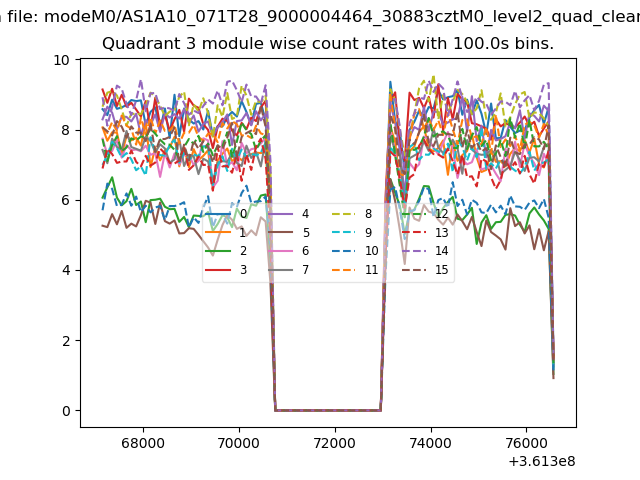 |
 |
| Parameter | Plot |
|---|---|
| CZT HV Monitor | 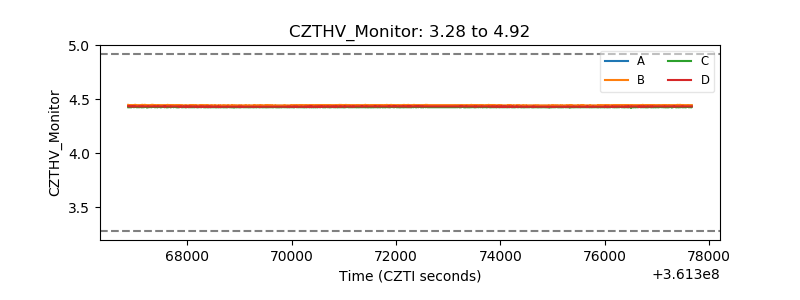 |
| D_VDD | 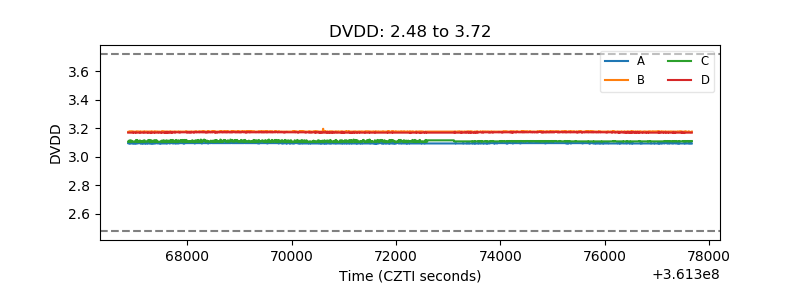 |
| Temperature 1 | 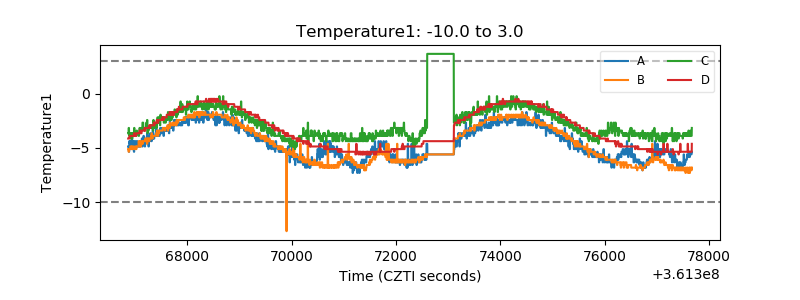 |
| Veto HV Monitor | 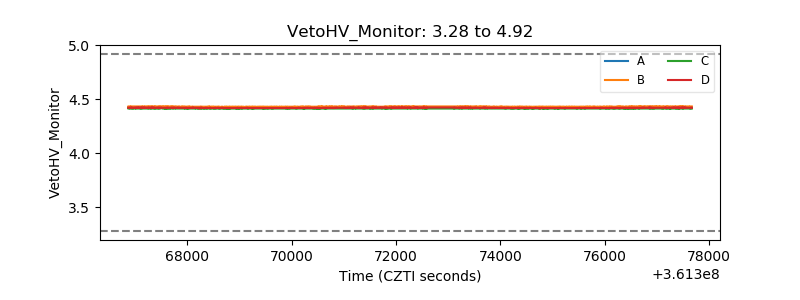 |
| Veto LLD | 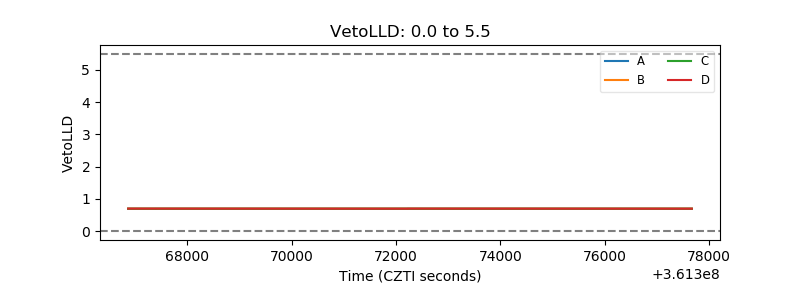 |
| Alpha Counter | 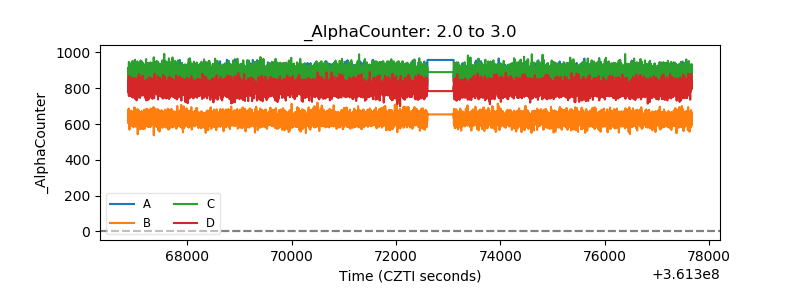 |
| _CPM_Rate | 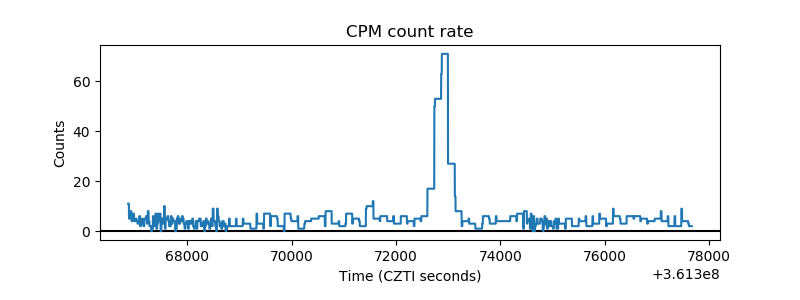 |
| CZT Counter | 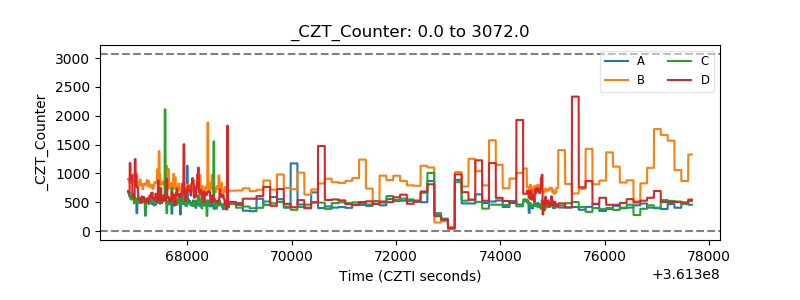 |
| +2.5 Volts monitor | 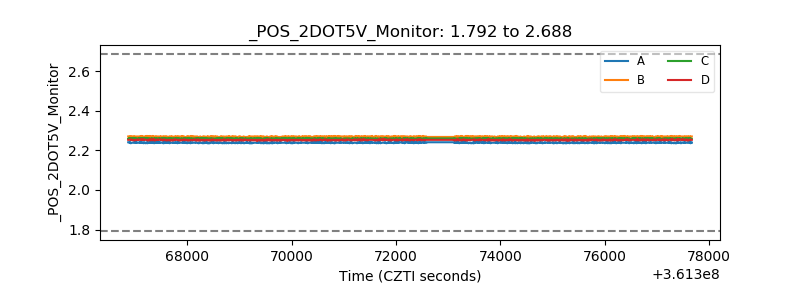 |
| +5 Volts monitor |  |
| _ROLL_ROT | 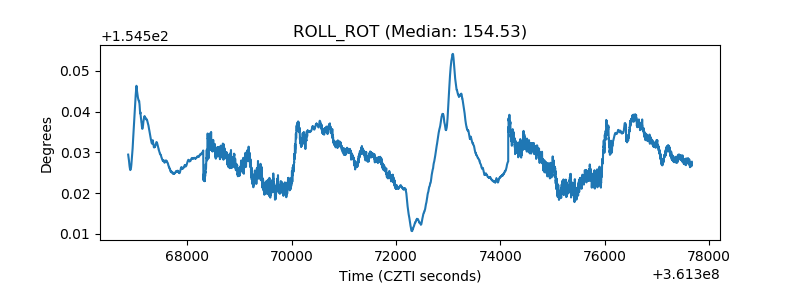 |
| _Roll_DEC | 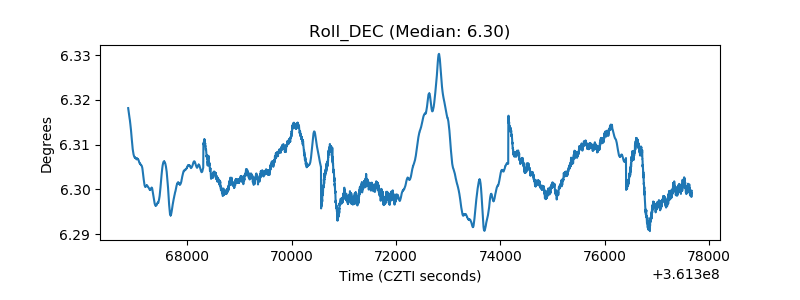 |
| _Roll_RA | 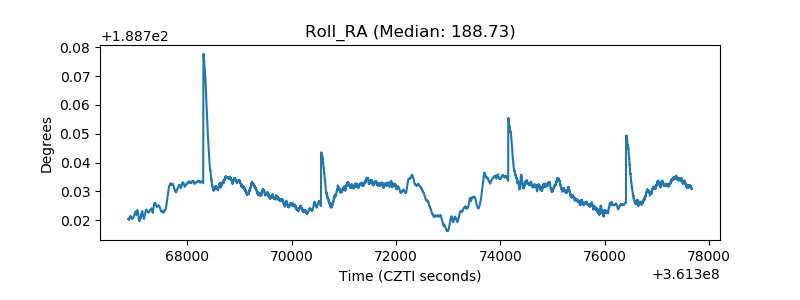 |
| Veto Counter | 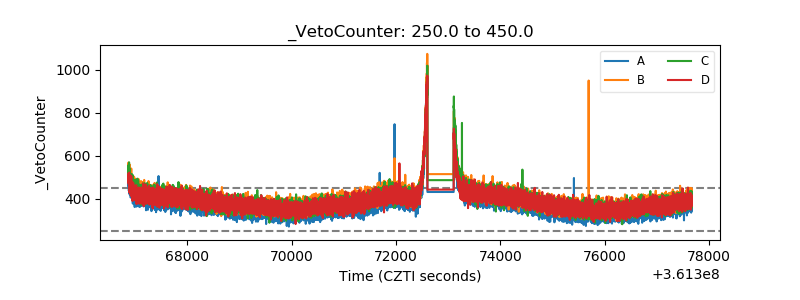 |