| Param | Original file | Final file |
|---|---|---|
| Filename | modeM0/AS1A10_071T28_9000004464_30885cztM0_level2.evt | modeM0/AS1A10_071T28_9000004464_30885cztM0_level2_quad_clean.evt |
| Size (bytes) | 555,793,920 | 91,872,000 |
| Size | 530.0 MB | 87.6 MB |
| Events in quadrant A | 3,154,534 | 600,824 |
| Events in quadrant B | 5,461,100 | 595,336 |
| Events in quadrant C | 3,611,061 | 566,400 |
| Events in quadrant D | 4,160,556 | 561,293 |
| Mode M9 | |||
|---|---|---|---|
| Quadrant | BADHDUFLAG | Total packets | Discarded packets |
| A | 0 | 11 | 0 |
| B | 0 | 12 | 0 |
| C | 0 | 12 | 0 |
| D | 0 | 12 | 0 |
| Mode M0 | |||
|---|---|---|---|
| Quadrant | BADHDUFLAG | Total packets | Discarded packets |
| A | 0 | 13615 | 2 |
| B | 0 | 20706 | 2 |
| C | 0 | 14866 | 2 |
| D | 0 | 16750 | 2 |
| Mode SS | |||
|---|---|---|---|
| Quadrant | BADHDUFLAG | Total packets | Discarded packets |
| A | 0 | 134 | 0 |
| B | 0 | 134 | 0 |
| C | 0 | 134 | 0 |
| D | 0 | 134 | 0 |
| Quadrant | Total seconds | Saturated seconds | Saturation percentage |
|---|---|---|---|
| A | 6571 | 40 | 0.608735% |
| B | 6570 | 130 | 1.978691% |
| C | 6570 | 169 | 2.572298% |
| D | 6570 | 48 | 0.730594% |
Noise dominated data is calculated using 1-second bins in cleaned event files. If a bin has >2000 counts, and if more than 50% of those come from <1% of pixels, then it is considered to be noise-dominated and hence unusable.
| Quadrant | # 1 sec bins | Bins with >0 counts | Bins with >2000 counts | High rate bins dominated by noise | Noise dominated (total time) | Noise dominated (detector-on time) | Marked lightcurve |
|---|---|---|---|---|---|---|---|
| A | 7626 | 6571 | 0 | 0 | 0.00% | 0.00% | 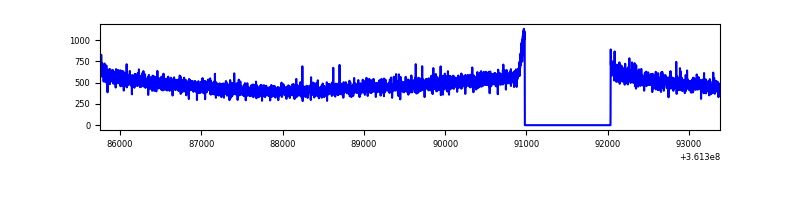 |
| B | 7625 | 6570 | 30 | 30 | 0.39% | 0.46% | 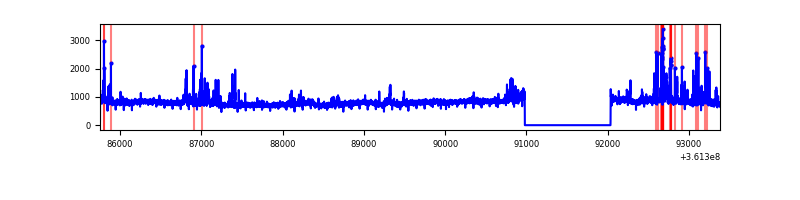 |
| C | 7625 | 6570 | 54 | 54 | 0.71% | 0.82% | 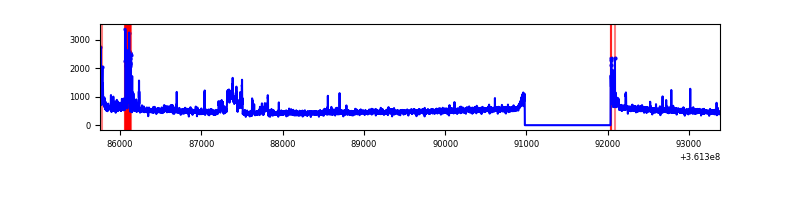 |
| D | 7625 | 6570 | 14 | 14 | 0.18% | 0.21% | 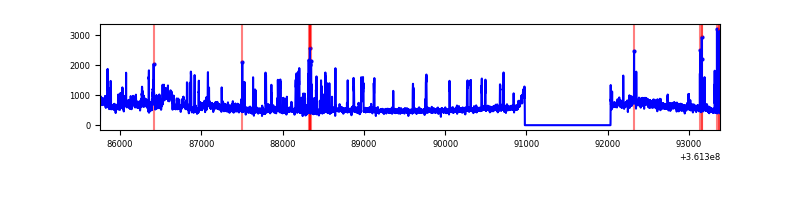 |
Top three noisy pixels from each quadrant. If the there are fewer than three noisy pixels in the level2.evt file, extra rows are filled as -1
| Pixel properties | Quadrant properties | ||||||
|---|---|---|---|---|---|---|---|
| Quadrant | DetID | PixID | Counts | Sigma | Mean | Median | Sigma |
| A | 13 | 254 | 12481 | 71.13 | 817 | 801 | 164.2 |
| A | 3 | 137 | 8276 | 45.52 | 817 | 801 | 164.2 |
| A | 0 | 226 | 6859 | 36.89 | 817 | 801 | 164.2 |
| B | 6 | 159 | 1868524 | 12047.33 | 807 | 785 | 155.0 |
| B | 4 | 171 | 138043 | 885.34 | 807 | 785 | 155.0 |
| B | 6 | 36 | 136000 | 872.17 | 807 | 785 | 155.0 |
| C | 0 | 10 | 348309 | 1897.49 | 777 | 784 | 183.2 |
| C | 14 | 238 | 123751 | 671.4 | 777 | 784 | 183.2 |
| C | 3 | 233 | 59902 | 322.78 | 777 | 784 | 183.2 |
| D | 8 | 195 | 726746 | 3866.37 | 786 | 768 | 187.8 |
| D | 7 | 238 | 126231 | 668.18 | 786 | 768 | 187.8 |
| D | 13 | 243 | 90003 | 475.24 | 786 | 768 | 187.8 |
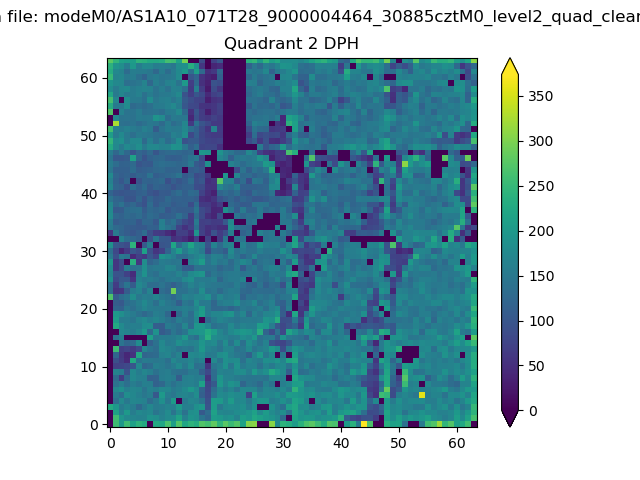
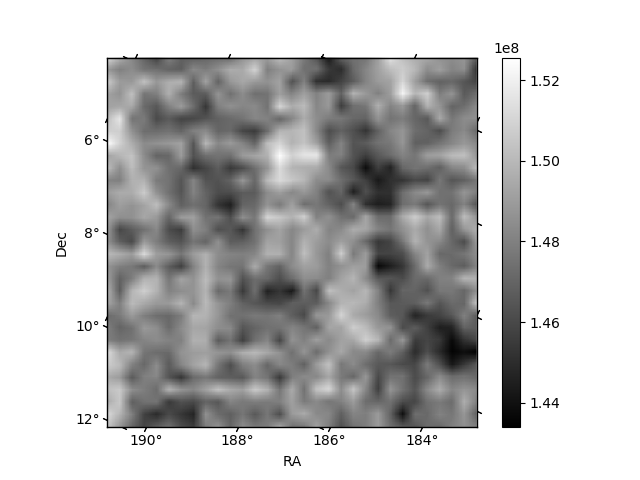
Histogram calculated using DETX and DETY for each event in the final _common_clean file
| Quadrant A | 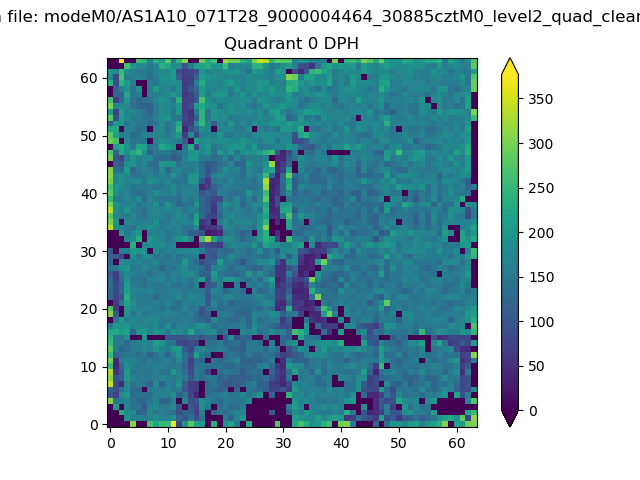 |
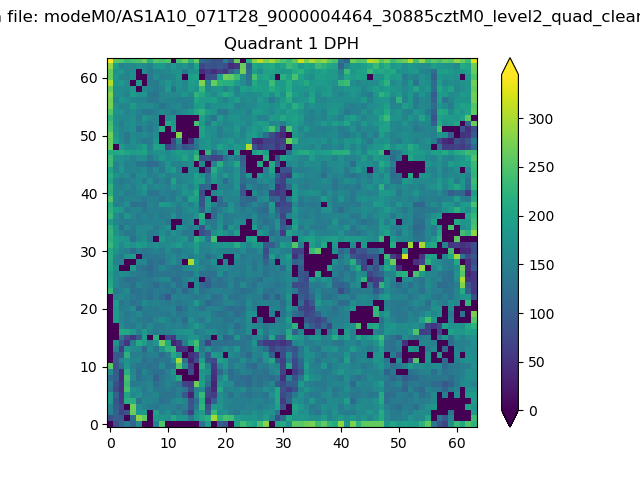 |
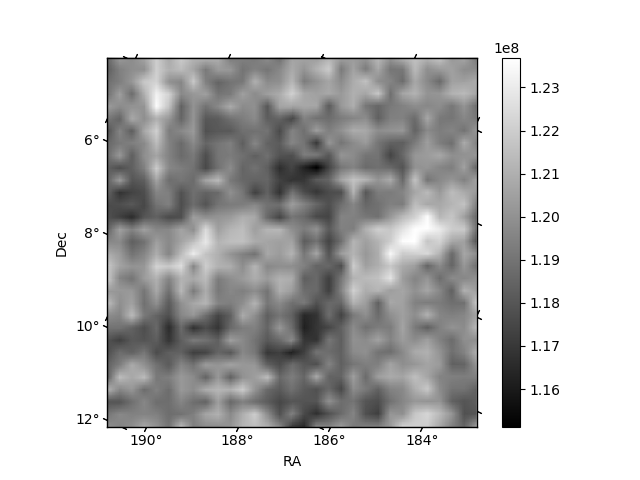
Quadrant B |
|---|---|---|---|
| Quadrant D | 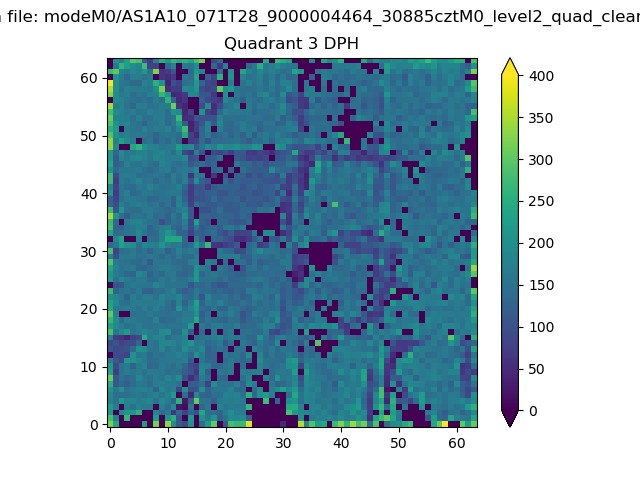 |
 |
Quadrant C |
| Plot type | Count rate plots | Images |
|---|---|---|
| Comparison with Poisson distribution Blue bars denote a histogram of data divided into 1 sec bins. Red curve is a Poisson curve with rate = median count rate of data. |
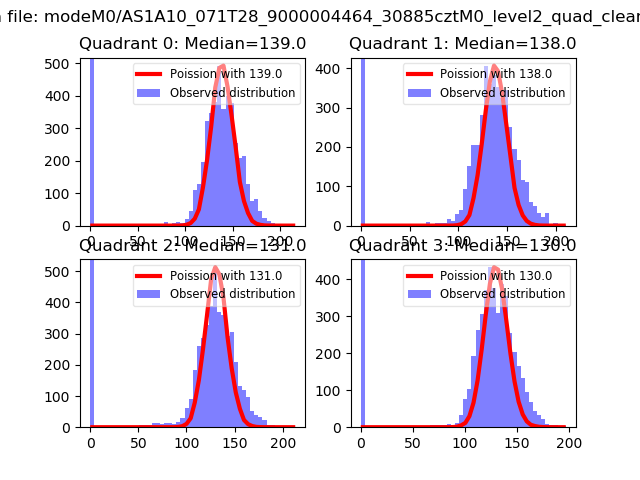 |
 |
| Quadrant-wise count rates Data is divided into 100 sec bins |
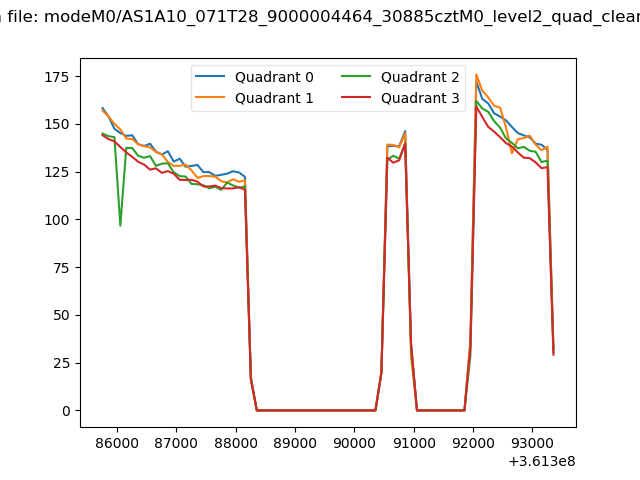 |
|
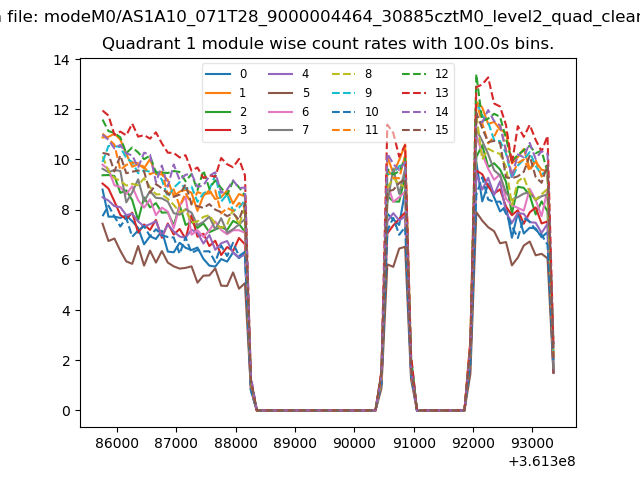
| Module-wise count rates for Quadrant A Data is divided into 100 sec bins |
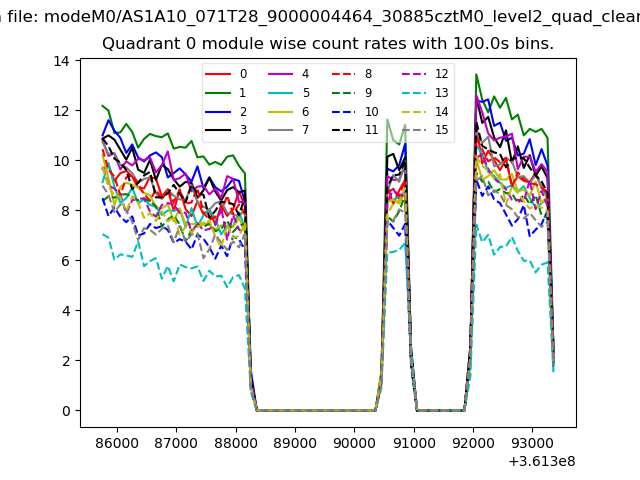 |
 |
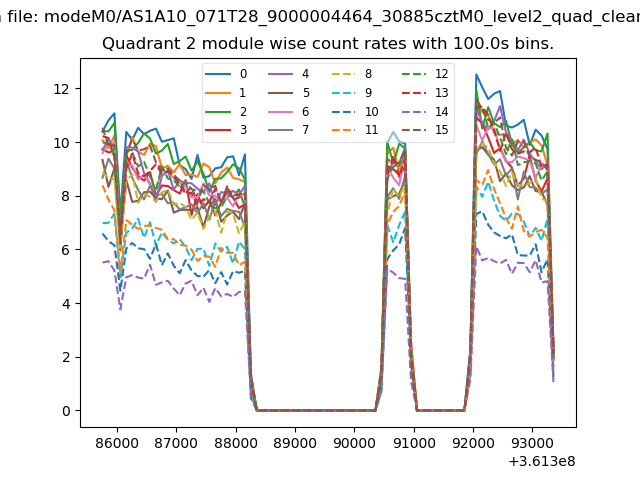
| Module-wise count rates for Quadrant B Data is divided into 100 sec bins |
 |
 |
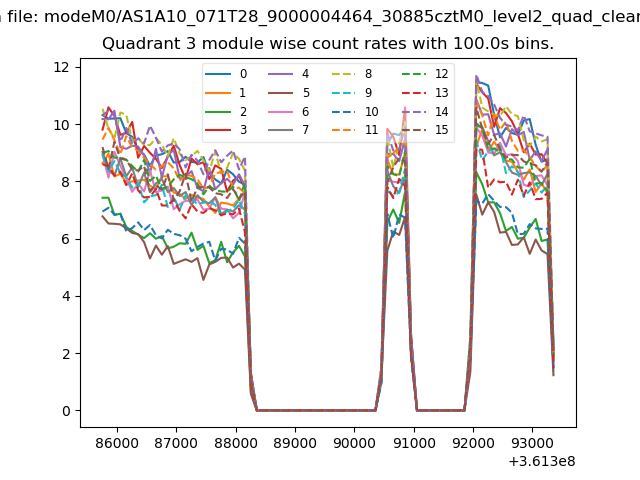
| Module-wise count rates for Quadrant C Data is divided into 100 sec bins |
 |
 |
| Module-wise count rates for Quadrant D Data is divided into 100 sec bins |
 |
 |
| Parameter | Plot |
|---|---|
| CZT HV Monitor | 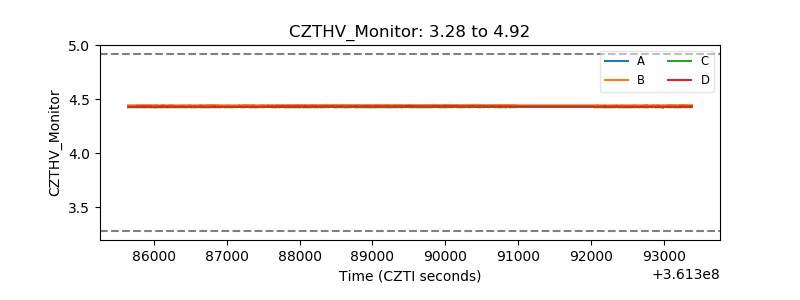 |
| D_VDD |  |
| Temperature 1 | 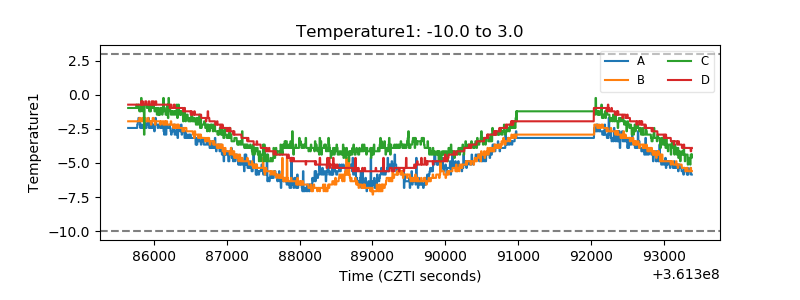 |
| Veto HV Monitor |  |
| Veto LLD | 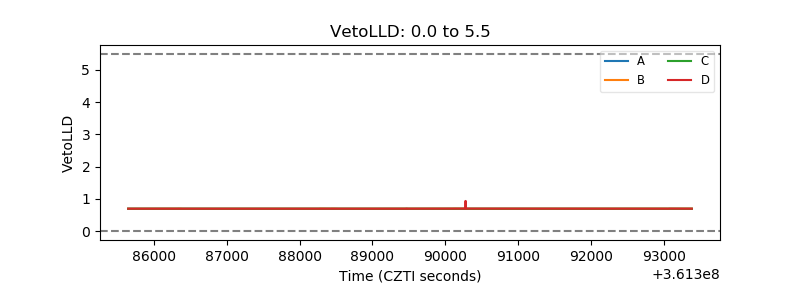 |
| Alpha Counter | 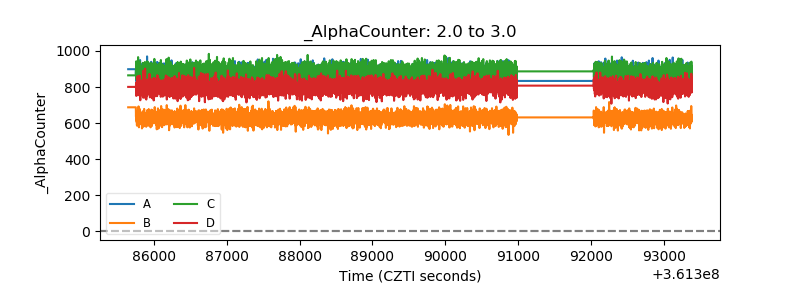 |
| _CPM_Rate | 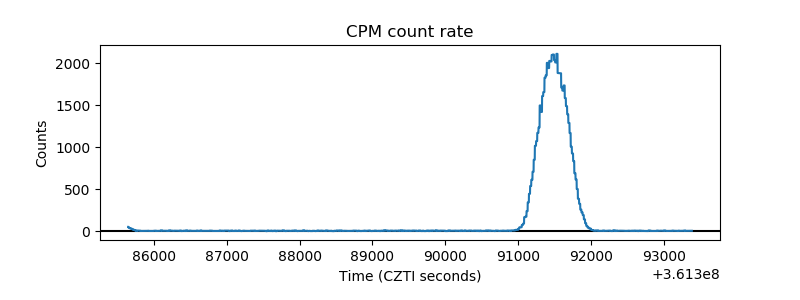 |
| CZT Counter | 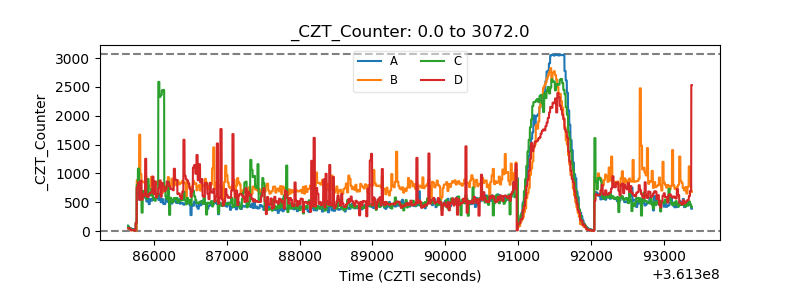 |
| +2.5 Volts monitor |  |
| +5 Volts monitor |  |
| _ROLL_ROT | 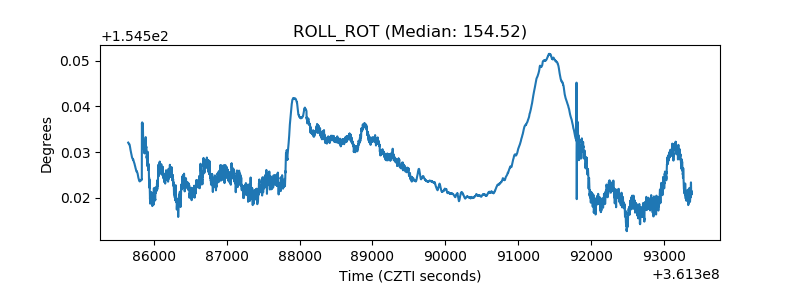 |
| _Roll_DEC | 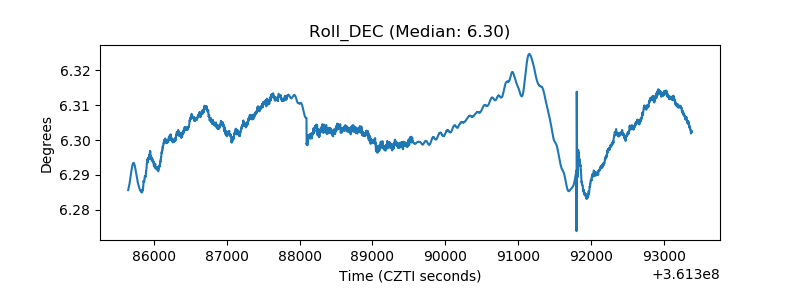 |
| _Roll_RA |  |
| Veto Counter | 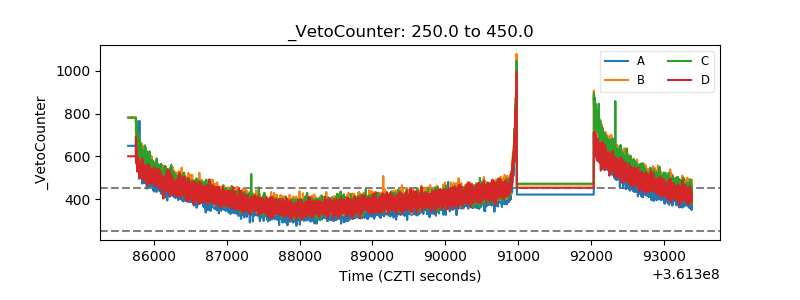 |