| Param | Original file | Final file |
|---|---|---|
| Filename | modeM0/AS1A10_071T28_9000004464_30887cztM0_level2.evt | modeM0/AS1A10_071T28_9000004464_30887cztM0_level2_quad_clean.evt |
| Size (bytes) | 563,215,680 | 92,520,000 |
| Size | 537.1 MB | 88.2 MB |
| Events in quadrant A | 3,137,377 | 613,592 |
| Events in quadrant B | 5,589,793 | 612,507 |
| Events in quadrant C | 3,362,141 | 577,801 |
| Events in quadrant D | 4,536,405 | 553,155 |
| Mode M9 | |||
|---|---|---|---|
| Quadrant | BADHDUFLAG | Total packets | Discarded packets |
| A | 0 | 13 | 0 |
| B | 0 | 14 | 0 |
| C | 0 | 14 | 0 |
| D | 0 | 14 | 0 |
| Mode M0 | |||
|---|---|---|---|
| Quadrant | BADHDUFLAG | Total packets | Discarded packets |
| A | 0 | 13353 | 2 |
| B | 0 | 20792 | 2 |
| C | 0 | 13928 | 2 |
| D | 0 | 17795 | 3 |
| Mode SS | |||
|---|---|---|---|
| Quadrant | BADHDUFLAG | Total packets | Discarded packets |
| A | 0 | 130 | 0 |
| B | 0 | 130 | 0 |
| C | 0 | 130 | 0 |
| D | 0 | 130 | 0 |
| Quadrant | Total seconds | Saturated seconds | Saturation percentage |
|---|---|---|---|
| A | 6369 | 38 | 0.596640% |
| B | 6369 | 177 | 2.779086% |
| C | 6369 | 173 | 2.716282% |
| D | 6368 | 265 | 4.161432% |
Noise dominated data is calculated using 1-second bins in cleaned event files. If a bin has >2000 counts, and if more than 50% of those come from <1% of pixels, then it is considered to be noise-dominated and hence unusable.
| Quadrant | # 1 sec bins | Bins with >0 counts | Bins with >2000 counts | High rate bins dominated by noise | Noise dominated (total time) | Noise dominated (detector-on time) | Marked lightcurve |
|---|---|---|---|---|---|---|---|
| A | 7554 | 6369 | 0 | 0 | 0.00% | 0.00% | 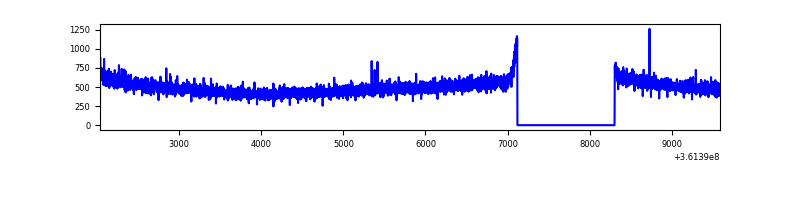 |
| B | 7554 | 6369 | 54 | 54 | 0.71% | 0.85% | 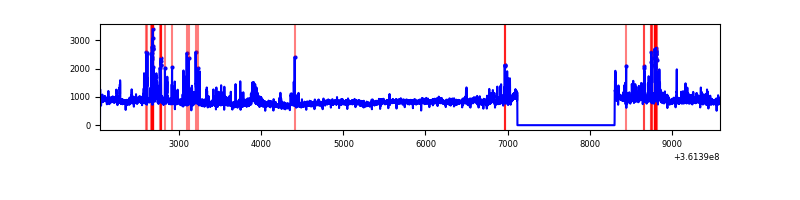 |
| C | 7554 | 6369 | 29 | 29 | 0.38% | 0.46% | 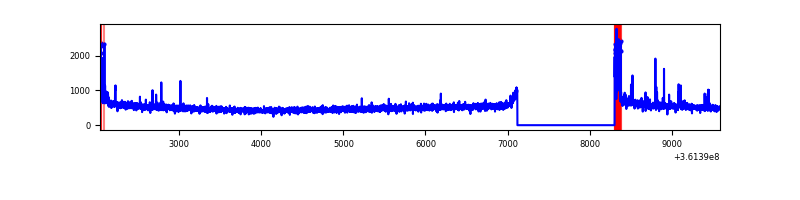 |
| D | 7553 | 6369 | 214 | 214 | 2.83% | 3.36% | 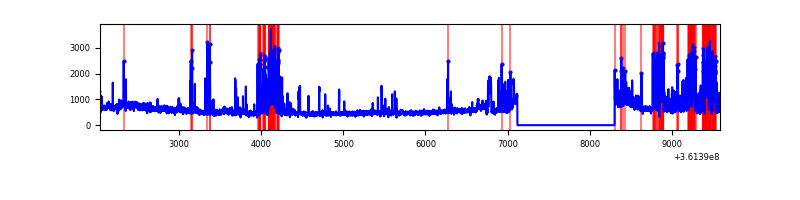 |
Top three noisy pixels from each quadrant. If the there are fewer than three noisy pixels in the level2.evt file, extra rows are filled as -1
| Pixel properties | Quadrant properties | ||||||
|---|---|---|---|---|---|---|---|
| Quadrant | DetID | PixID | Counts | Sigma | Mean | Median | Sigma |
| A | 13 | 254 | 12052 | 68.84 | 813 | 797 | 163.5 |
| A | 3 | 137 | 7998 | 44.05 | 813 | 797 | 163.5 |
| A | 0 | 226 | 6694 | 36.07 | 813 | 797 | 163.5 |
| B | 6 | 159 | 1844024 | 12110.08 | 806 | 789 | 152.2 |
| B | 6 | 36 | 218878 | 1432.85 | 806 | 789 | 152.2 |
| B | 4 | 171 | 116437 | 759.81 | 806 | 789 | 152.2 |
| C | 14 | 238 | 137217 | 752.13 | 771 | 776 | 181.4 |
| C | 0 | 10 | 118669 | 649.88 | 771 | 776 | 181.4 |
| C | 3 | 233 | 42746 | 231.36 | 771 | 776 | 181.4 |
| D | 8 | 195 | 547864 | 3024.75 | 764 | 747 | 180.9 |
| D | 12 | 218 | 299123 | 1649.58 | 764 | 747 | 180.9 |
| D | 12 | 233 | 287385 | 1584.68 | 764 | 747 | 180.9 |
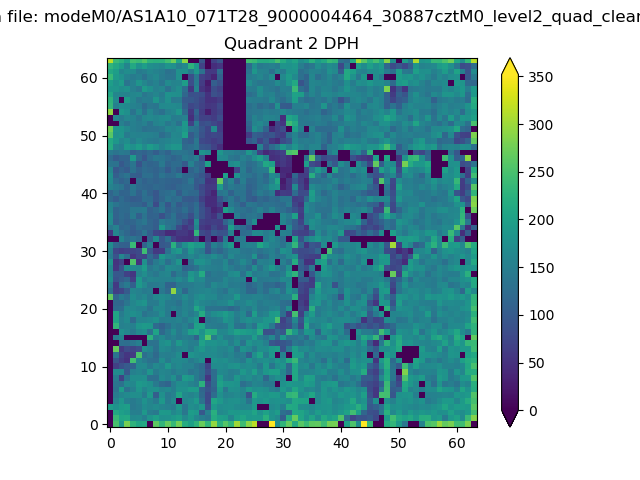
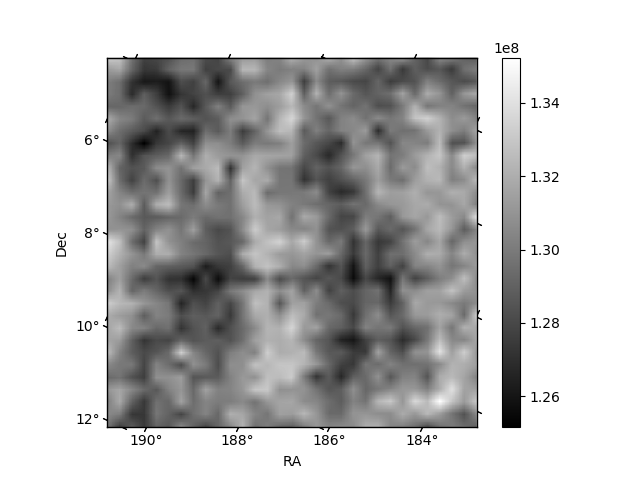
Histogram calculated using DETX and DETY for each event in the final _common_clean file
| Quadrant A | 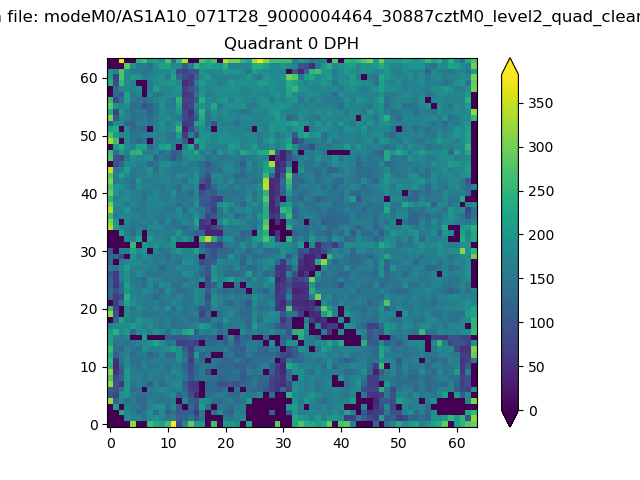 |
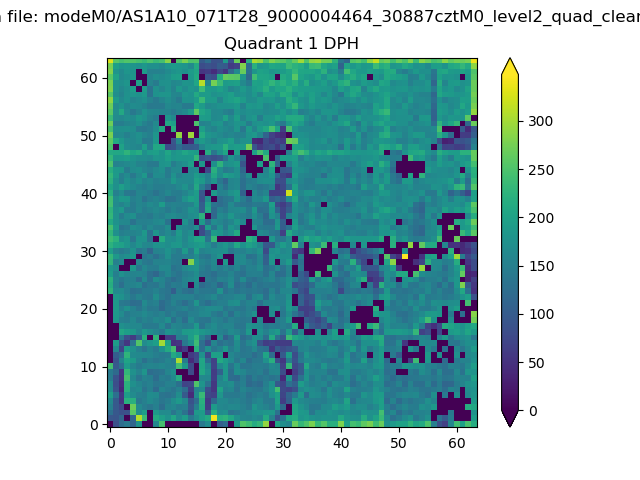 |
Quadrant B |
|---|---|---|---|
| Quadrant D | 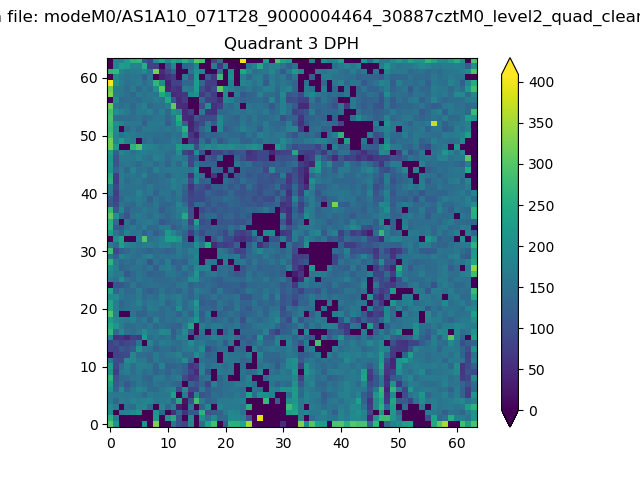 |
 |
Quadrant C |
| Plot type | Count rate plots | Images |
|---|---|---|
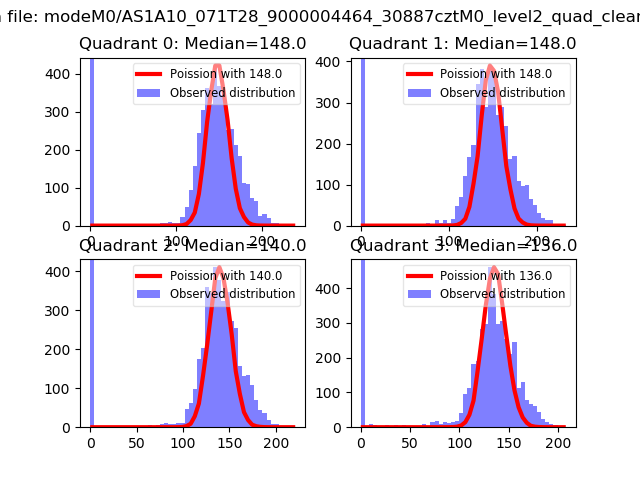
| Comparison with Poisson distribution Blue bars denote a histogram of data divided into 1 sec bins. Red curve is a Poisson curve with rate = median count rate of data. |
 |
 |
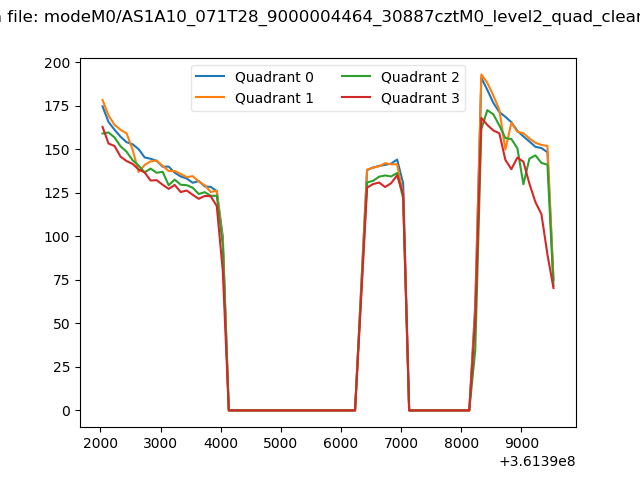
| Quadrant-wise count rates Data is divided into 100 sec bins |
 |
|
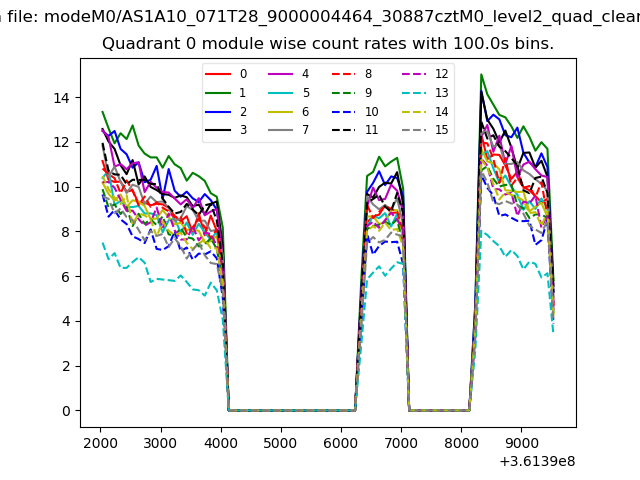
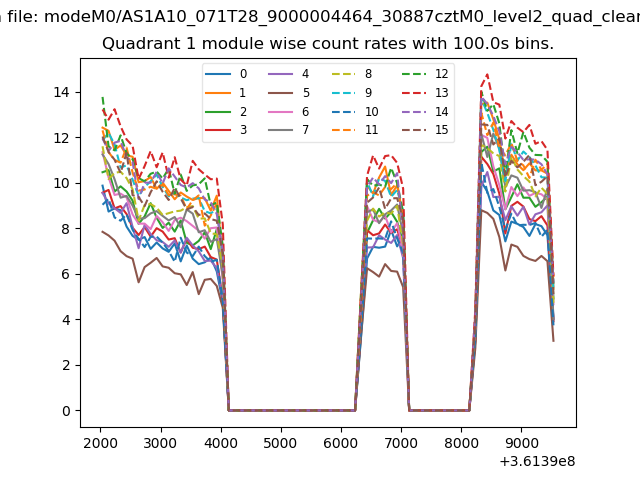
| Module-wise count rates for Quadrant A Data is divided into 100 sec bins |
 |
 |
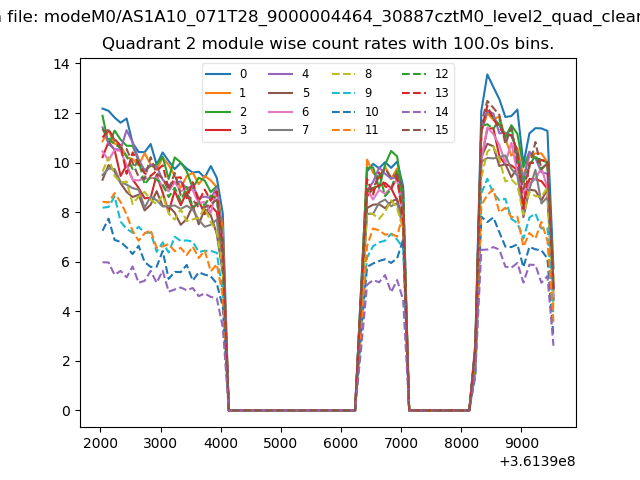
| Module-wise count rates for Quadrant B Data is divided into 100 sec bins |
 |
 |
| Module-wise count rates for Quadrant C Data is divided into 100 sec bins |
 |
 |
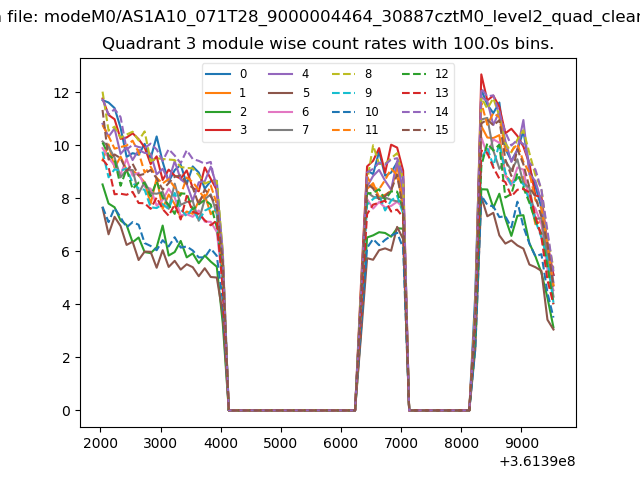
| Module-wise count rates for Quadrant D Data is divided into 100 sec bins |
 |
 |
| Parameter | Plot |
|---|---|
| CZT HV Monitor | 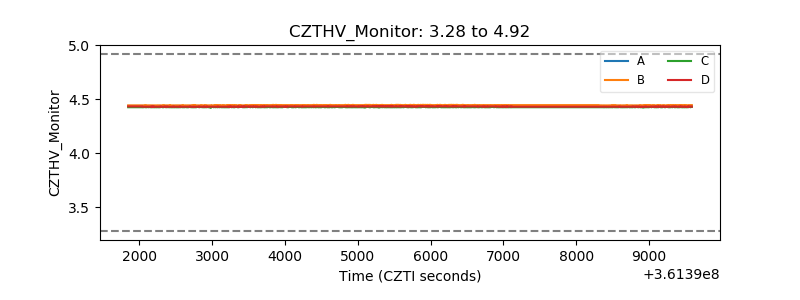 |
| D_VDD |  |
| Temperature 1 | 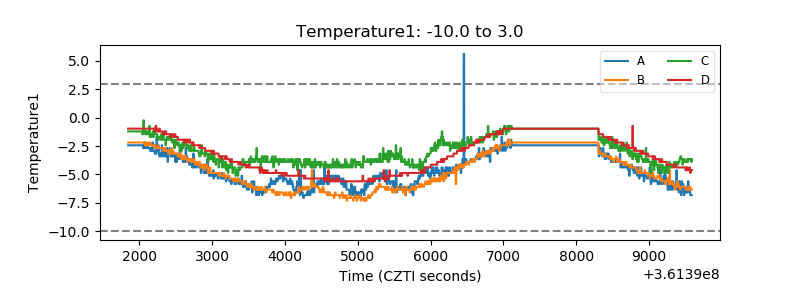 |
| Veto HV Monitor | 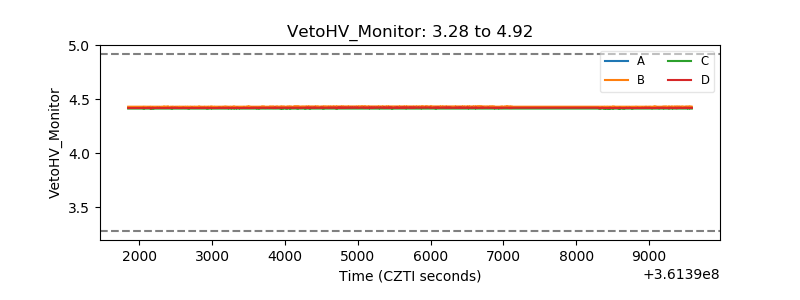 |
| Veto LLD | 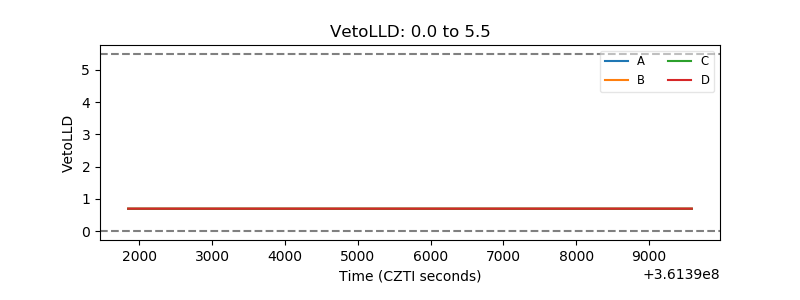 |
| Alpha Counter | 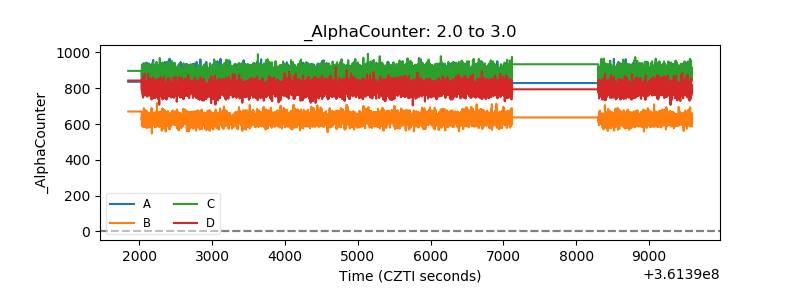 |
| _CPM_Rate | 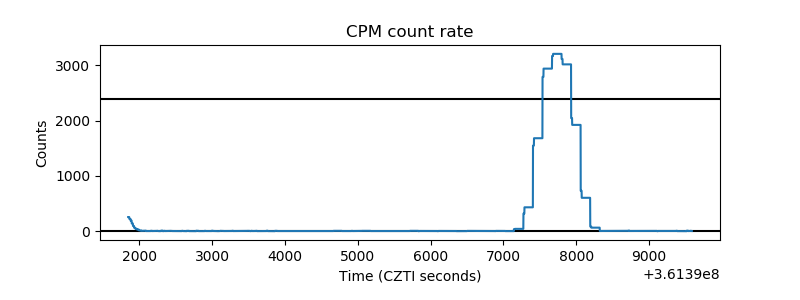 |
| CZT Counter | 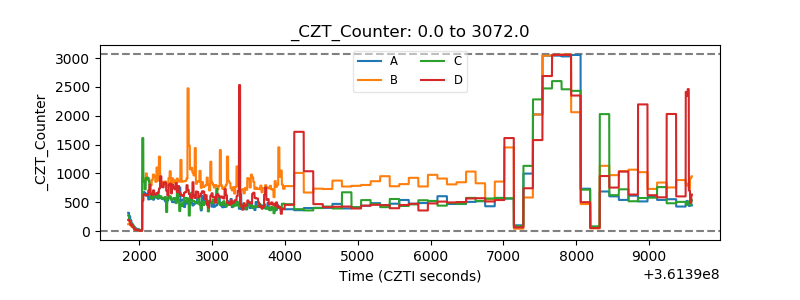 |
| +2.5 Volts monitor |  |
| +5 Volts monitor |  |
| _ROLL_ROT | 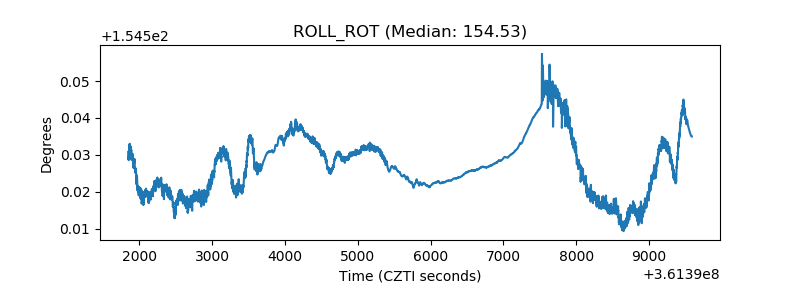 |
| _Roll_DEC | 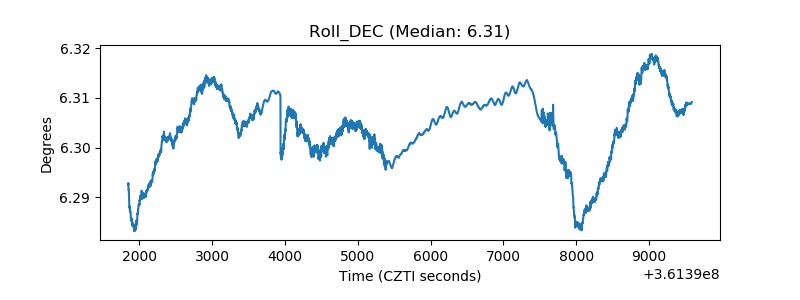 |
| _Roll_RA | 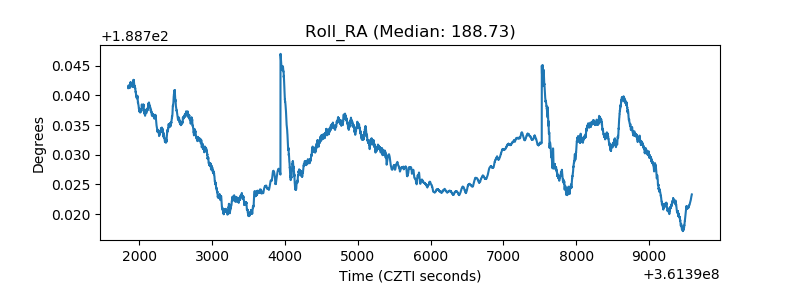 |
| Veto Counter | 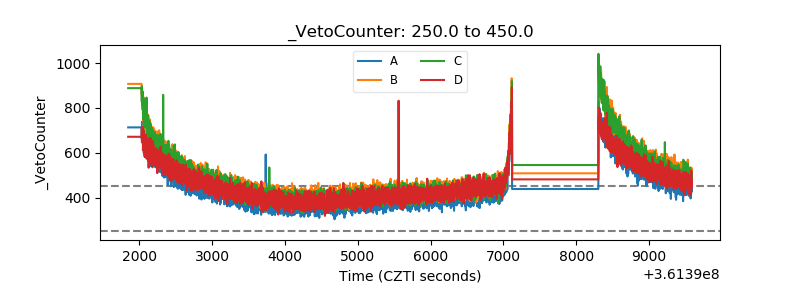 |