| Param | Original file | Final file |
|---|---|---|
| Filename | modeM0/AS1A10_071T28_9000004464_30889cztM0_level2.evt | modeM0/AS1A10_071T28_9000004464_30889cztM0_level2_quad_clean.evt |
| Size (bytes) | 622,552,320 | 88,156,800 |
| Size | 593.7 MB | 84.1 MB |
| Events in quadrant A | 3,290,200 | 591,286 |
| Events in quadrant B | 5,895,251 | 589,537 |
| Events in quadrant C | 4,061,085 | 532,149 |
| Events in quadrant D | 5,189,743 | 524,537 |
| Mode M9 | |||
|---|---|---|---|
| Quadrant | BADHDUFLAG | Total packets | Discarded packets |
| A | 0 | 23 | 0 |
| B | 0 | 24 | 0 |
| C | 0 | 24 | 0 |
| D | 0 | 24 | 0 |
| Mode M0 | |||
|---|---|---|---|
| Quadrant | BADHDUFLAG | Total packets | Discarded packets |
| A | 0 | 13367 | 2 |
| B | 0 | 21549 | 2 |
| C | 0 | 15935 | 2 |
| D | 0 | 19735 | 2 |
| Mode SS | |||
|---|---|---|---|
| Quadrant | BADHDUFLAG | Total packets | Discarded packets |
| A | 0 | 126 | 0 |
| B | 0 | 126 | 0 |
| C | 0 | 126 | 0 |
| D | 0 | 126 | 0 |
| Quadrant | Total seconds | Saturated seconds | Saturation percentage |
|---|---|---|---|
| A | 6184 | 16 | 0.258732% |
| B | 6184 | 234 | 3.783959% |
| C | 6184 | 450 | 7.276843% |
| D | 6184 | 411 | 6.646184% |
Noise dominated data is calculated using 1-second bins in cleaned event files. If a bin has >2000 counts, and if more than 50% of those come from <1% of pixels, then it is considered to be noise-dominated and hence unusable.
| Quadrant | # 1 sec bins | Bins with >0 counts | Bins with >2000 counts | High rate bins dominated by noise | Noise dominated (total time) | Noise dominated (detector-on time) | Marked lightcurve |
|---|---|---|---|---|---|---|---|
| A | 7529 | 6185 | 0 | 0 | 0.00% | 0.00% | 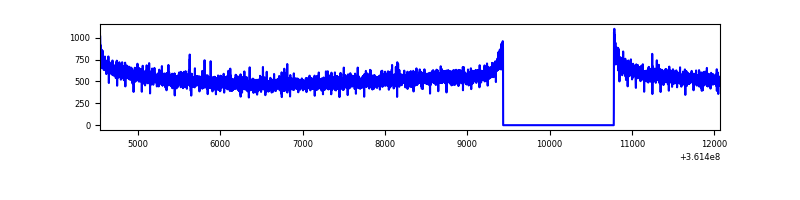 |
| B | 7529 | 6184 | 70 | 70 | 0.93% | 1.13% | 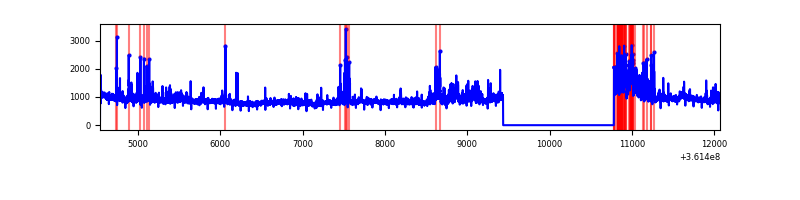 |
| C | 7529 | 6185 | 124 | 124 | 1.65% | 2.00% | 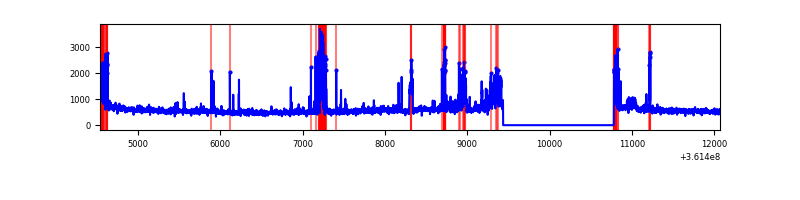 |
| D | 7529 | 6184 | 321 | 321 | 4.26% | 5.19% | 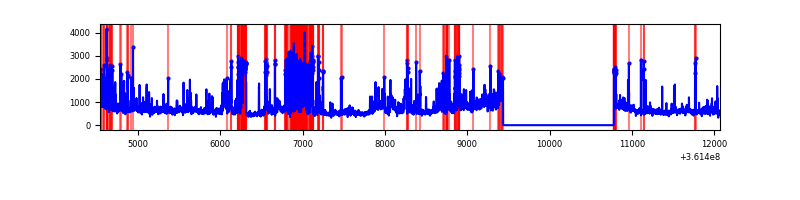 |
Top three noisy pixels from each quadrant. If the there are fewer than three noisy pixels in the level2.evt file, extra rows are filled as -1
| Pixel properties | Quadrant properties | ||||||
|---|---|---|---|---|---|---|---|
| Quadrant | DetID | PixID | Counts | Sigma | Mean | Median | Sigma |
| A | 13 | 254 | 10557 | 57.4 | 853 | 839 | 169.3 |
| A | 3 | 137 | 7873 | 41.55 | 853 | 839 | 169.3 |
| A | 0 | 226 | 7325 | 38.31 | 853 | 839 | 169.3 |
| B | 6 | 159 | 1783898 | 11356.65 | 846 | 829 | 157.0 |
| B | 6 | 36 | 531584 | 3380.46 | 846 | 829 | 157.0 |
| B | 0 | 229 | 126024 | 797.39 | 846 | 829 | 157.0 |
| C | 0 | 10 | 648302 | 3576.15 | 783 | 792 | 181.1 |
| C | 14 | 238 | 181890 | 1000.19 | 783 | 792 | 181.1 |
| C | 14 | 254 | 71718 | 391.72 | 783 | 792 | 181.1 |
| D | 12 | 218 | 1114469 | 6070.4 | 777 | 760 | 183.5 |
| D | 8 | 195 | 499257 | 2717.12 | 777 | 760 | 183.5 |
| D | 12 | 227 | 198486 | 1077.73 | 777 | 760 | 183.5 |
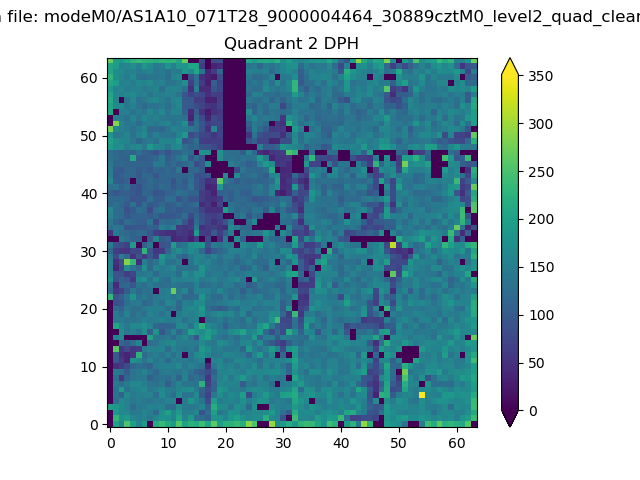
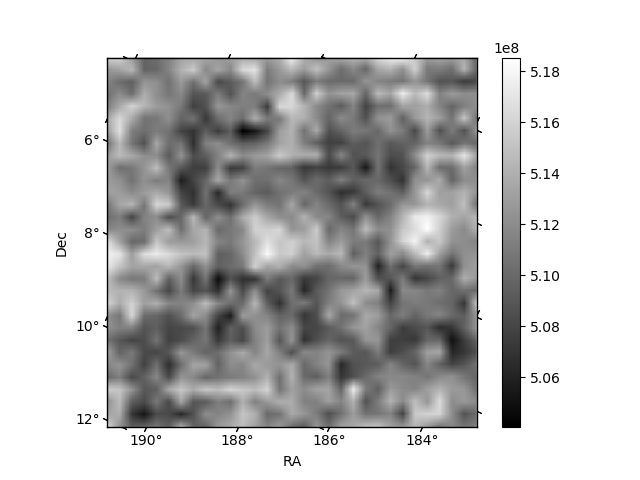
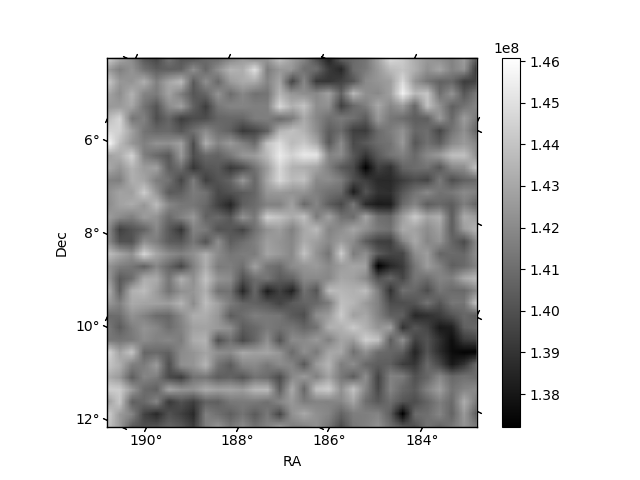
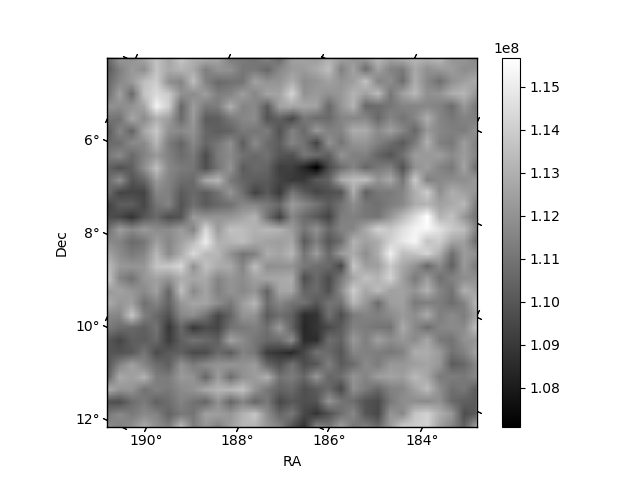
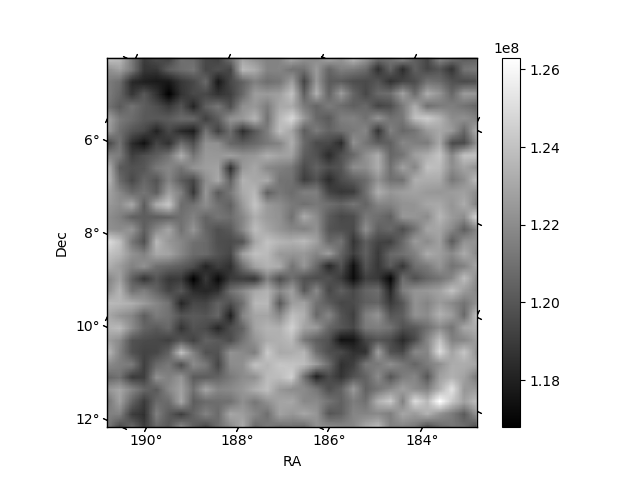
Histogram calculated using DETX and DETY for each event in the final _common_clean file
| Quadrant A | 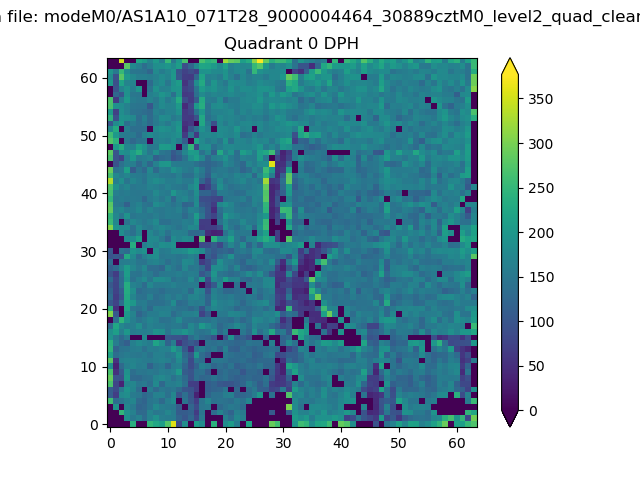 |
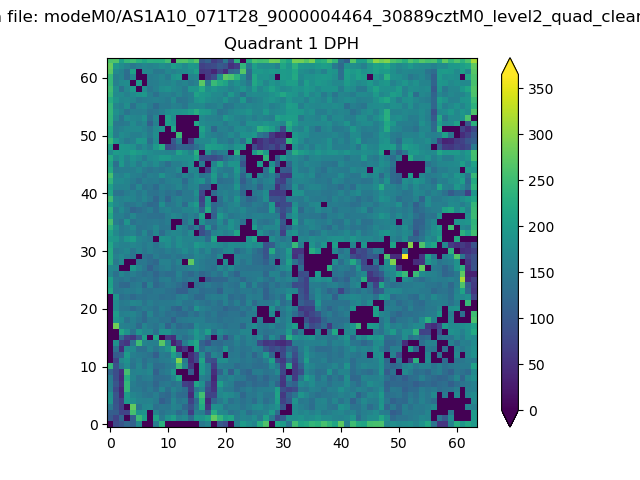 |
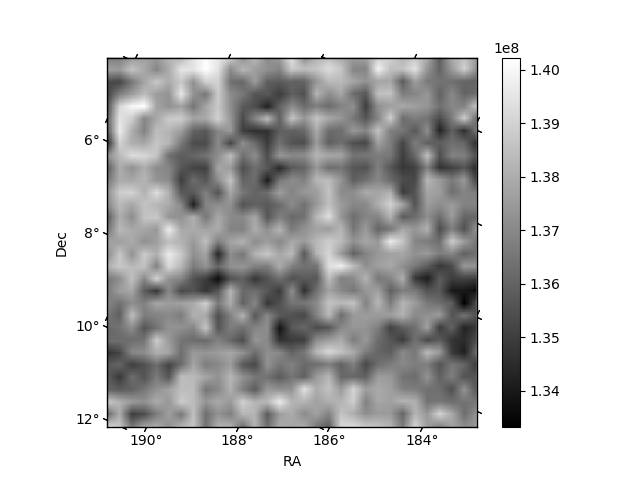
Quadrant B |
|---|---|---|---|
| Quadrant D | 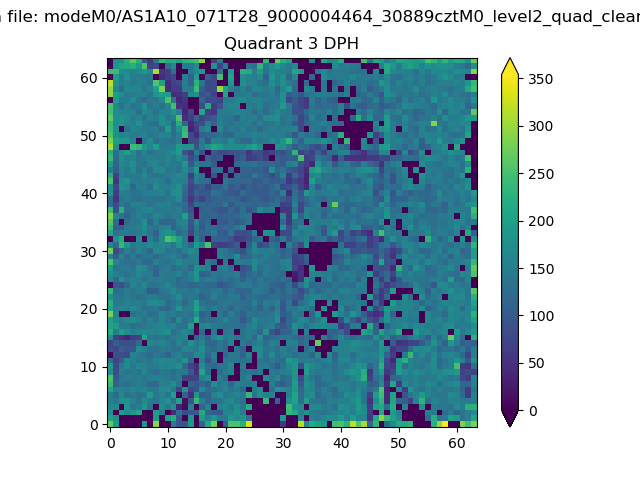 |
 |
Quadrant C |
| Plot type | Count rate plots | Images |
|---|---|---|
| Comparison with Poisson distribution Blue bars denote a histogram of data divided into 1 sec bins. Red curve is a Poisson curve with rate = median count rate of data. |
 |
 |
| Quadrant-wise count rates Data is divided into 100 sec bins |
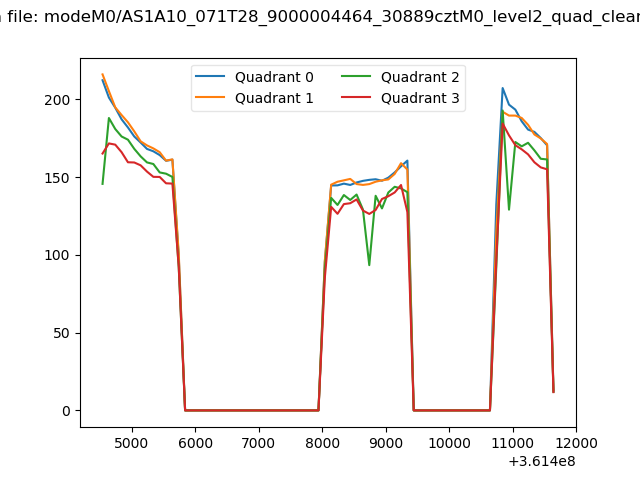 |
|
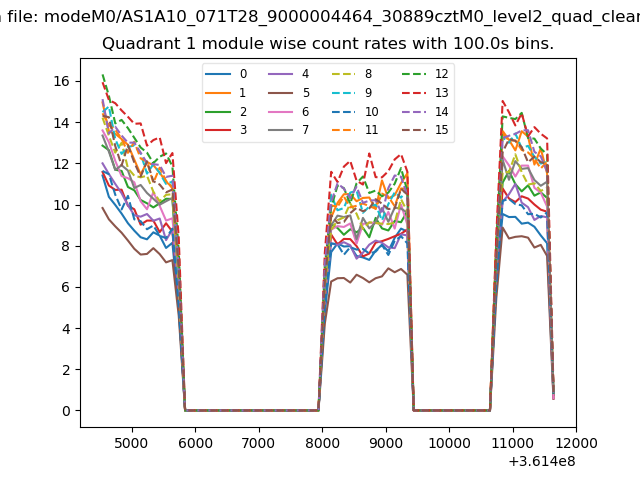
| Module-wise count rates for Quadrant A Data is divided into 100 sec bins |
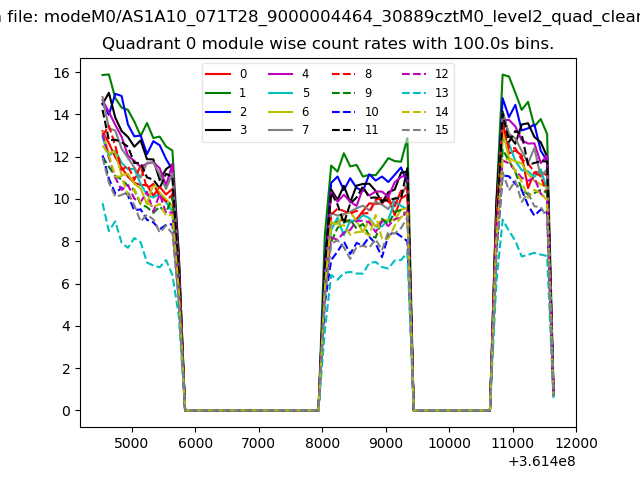 |
 |
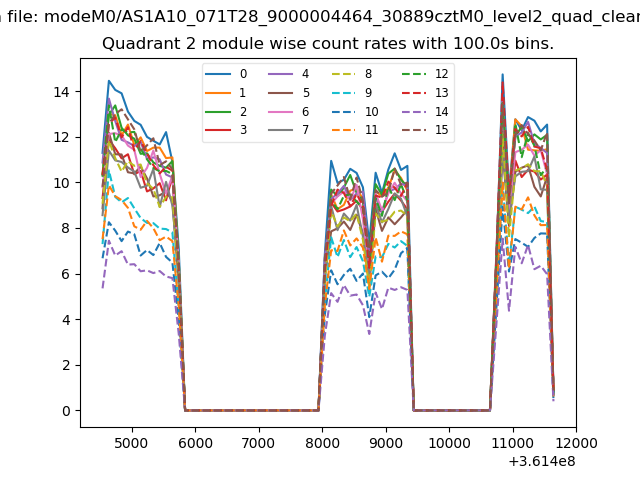
| Module-wise count rates for Quadrant B Data is divided into 100 sec bins |
 |
 |
| Module-wise count rates for Quadrant C Data is divided into 100 sec bins |
 |
 |
| Module-wise count rates for Quadrant D Data is divided into 100 sec bins |
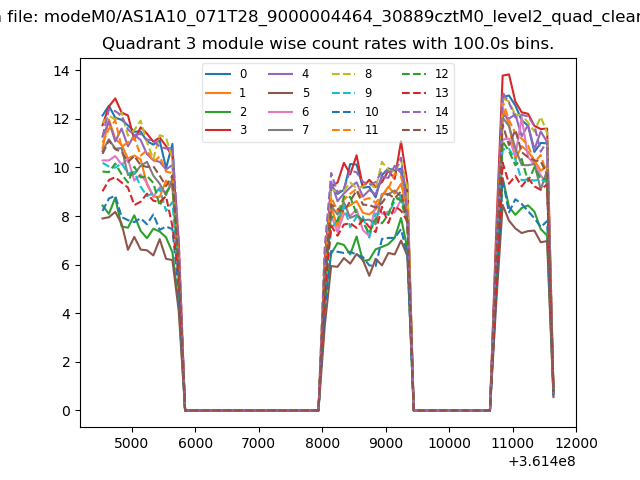 |
 |
| Parameter | Plot |
|---|---|
| CZT HV Monitor | 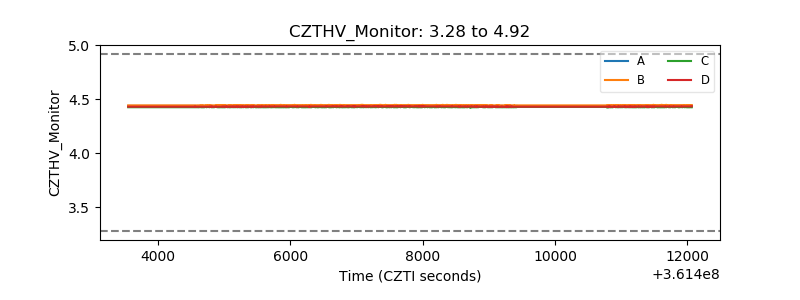 |
| D_VDD | 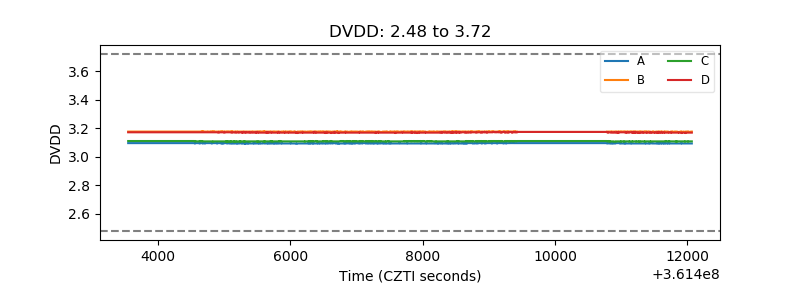 |
| Temperature 1 | 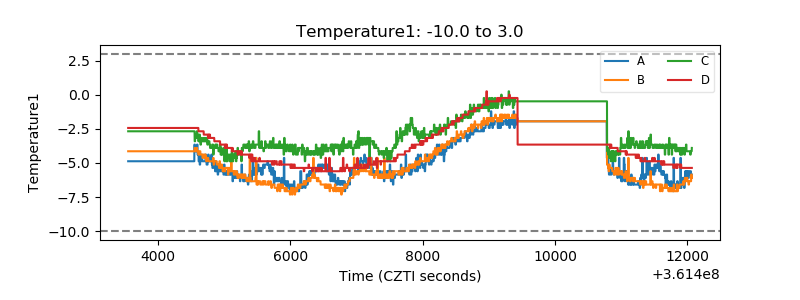 |
| Veto HV Monitor | 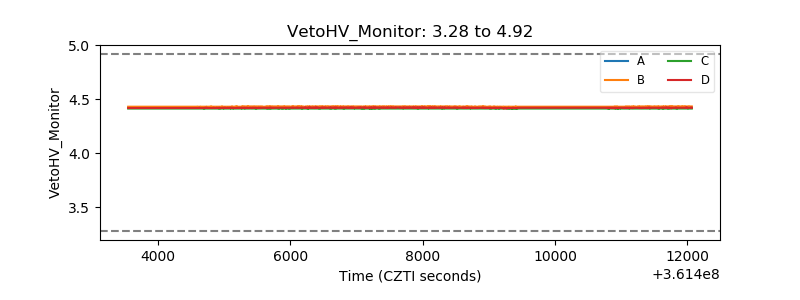 |
| Veto LLD | 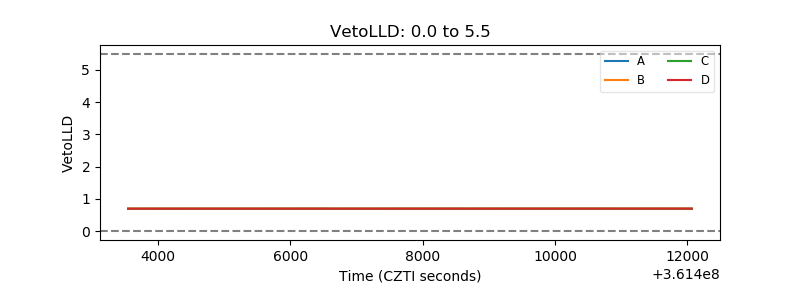 |
| Alpha Counter | 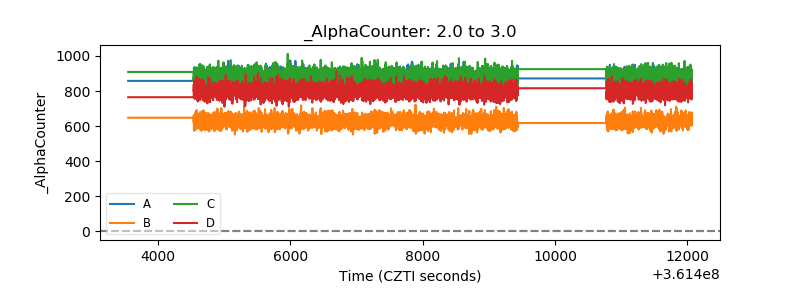 |
| _CPM_Rate | 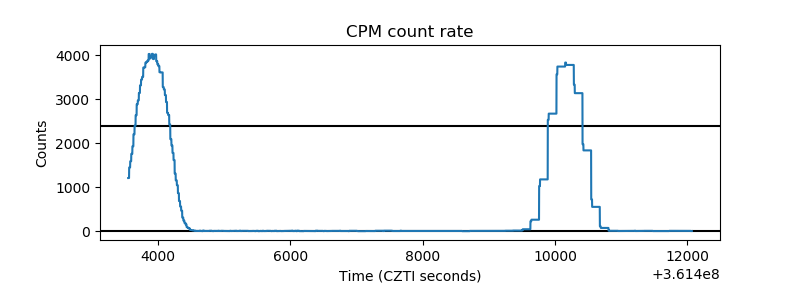 |
| CZT Counter | 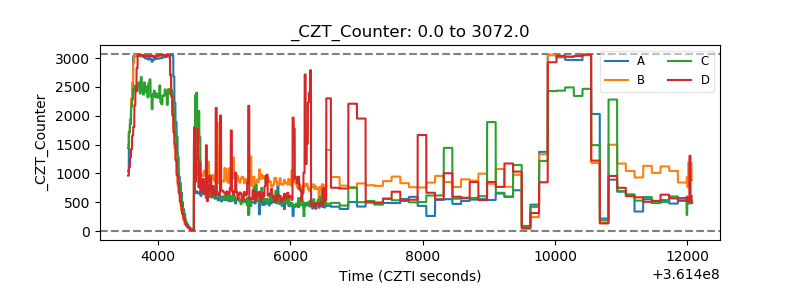 |
| +2.5 Volts monitor | 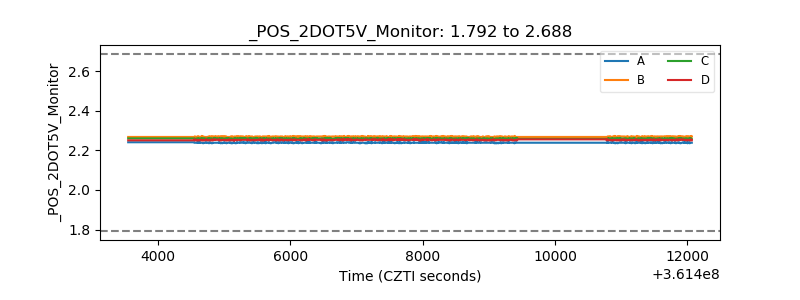 |
| +5 Volts monitor |  |
| _ROLL_ROT | 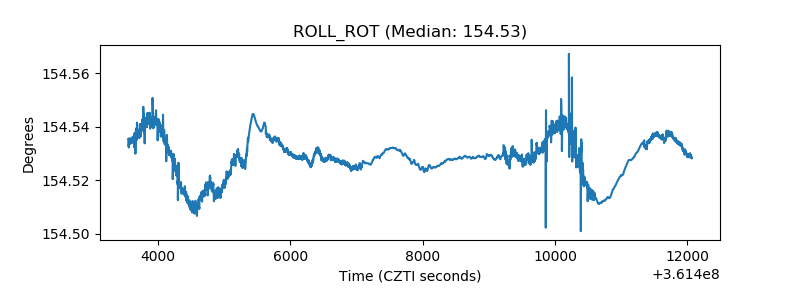 |
| _Roll_DEC | 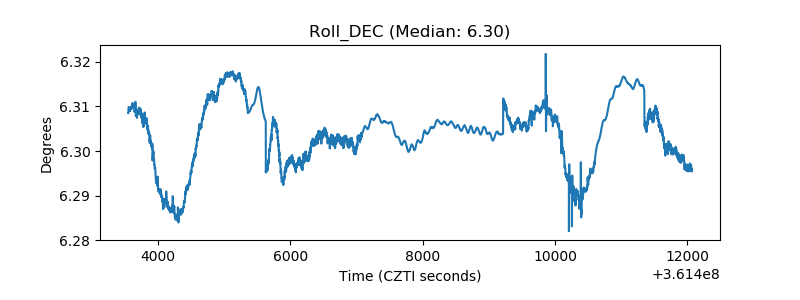 |
| _Roll_RA | 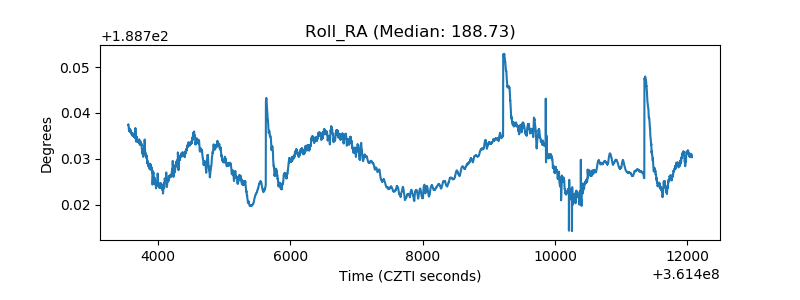 |
| Veto Counter | 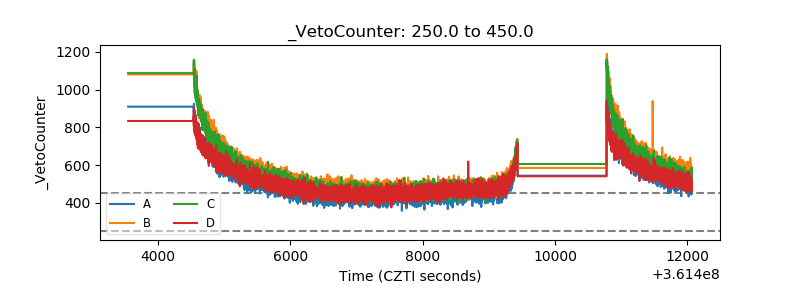 |