| Param | Original file | Final file |
|---|---|---|
| Filename | modeM0/AS1A10_071T28_9000004464_30892cztM0_level2.evt | modeM0/AS1A10_071T28_9000004464_30892cztM0_level2_quad_clean.evt |
| Size (bytes) | 576,636,480 | 70,643,520 |
| Size | 549.9 MB | 67.4 MB |
| Events in quadrant A | 3,451,902 | 431,151 |
| Events in quadrant B | 5,579,143 | 427,287 |
| Events in quadrant C | 3,741,673 | 404,548 |
| Events in quadrant D | 4,230,772 | 402,262 |
| Mode M9 | |||
|---|---|---|---|
| Quadrant | BADHDUFLAG | Total packets | Discarded packets |
| A | 0 | 12 | 0 |
| B | 0 | 13 | 0 |
| C | 0 | 13 | 0 |
| D | 0 | 13 | 0 |
| Mode M0 | |||
|---|---|---|---|
| Quadrant | BADHDUFLAG | Total packets | Discarded packets |
| A | 0 | 14151 | 2 |
| B | 0 | 21207 | 2 |
| C | 0 | 15009 | 2 |
| D | 0 | 17044 | 2 |
| Mode SS | |||
|---|---|---|---|
| Quadrant | BADHDUFLAG | Total packets | Discarded packets |
| A | 0 | 138 | 0 |
| B | 0 | 138 | 0 |
| C | 0 | 138 | 0 |
| D | 0 | 138 | 0 |
| Quadrant | Total seconds | Saturated seconds | Saturation percentage |
|---|---|---|---|
| A | 6795 | 74 | 1.089036% |
| B | 6795 | 205 | 3.016924% |
| C | 6795 | 174 | 2.560706% |
| D | 6794 | 82 | 1.206947% |
Noise dominated data is calculated using 1-second bins in cleaned event files. If a bin has >2000 counts, and if more than 50% of those come from <1% of pixels, then it is considered to be noise-dominated and hence unusable.
| Quadrant | # 1 sec bins | Bins with >0 counts | Bins with >2000 counts | High rate bins dominated by noise | Noise dominated (total time) | Noise dominated (detector-on time) | Marked lightcurve |
|---|---|---|---|---|---|---|---|
| A | 7770 | 6795 | 0 | 0 | 0.00% | 0.00% | 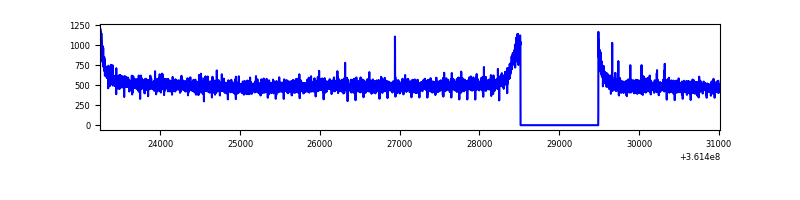 |
| B | 7770 | 6795 | 10 | 10 | 0.13% | 0.15% | 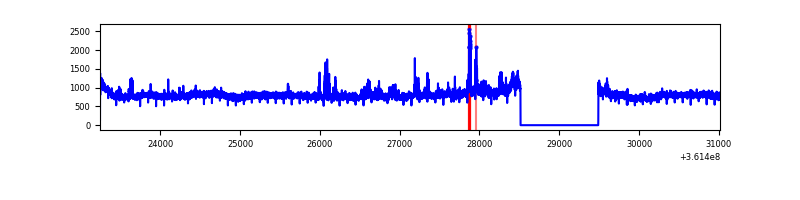 |
| C | 7770 | 6795 | 18 | 18 | 0.23% | 0.26% | 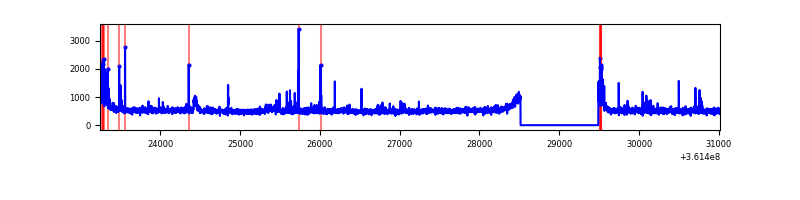 |
| D | 7769 | 6795 | 40 | 40 | 0.51% | 0.59% | 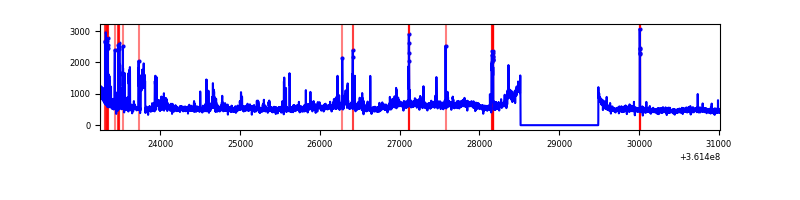 |
Top three noisy pixels from each quadrant. If the there are fewer than three noisy pixels in the level2.evt file, extra rows are filled as -1
| Pixel properties | Quadrant properties | ||||||
|---|---|---|---|---|---|---|---|
| Quadrant | DetID | PixID | Counts | Sigma | Mean | Median | Sigma |
| A | 13 | 254 | 11243 | 57.79 | 894 | 877 | 179.4 |
| A | 3 | 137 | 8799 | 44.17 | 894 | 877 | 179.4 |
| A | 0 | 226 | 7526 | 37.07 | 894 | 877 | 179.4 |
| B | 6 | 159 | 1836037 | 10778.13 | 883 | 863 | 170.3 |
| B | 6 | 36 | 149980 | 875.78 | 883 | 863 | 170.3 |
| B | 0 | 190 | 63690 | 368.99 | 883 | 863 | 170.3 |
| C | 0 | 10 | 204344 | 1032.15 | 841 | 849 | 197.2 |
| C | 14 | 238 | 136163 | 686.33 | 841 | 849 | 197.2 |
| C | 1 | 16 | 73659 | 369.3 | 841 | 849 | 197.2 |
| D | 8 | 195 | 754395 | 3752.35 | 848 | 829 | 200.8 |
| D | 2 | 250 | 100692 | 497.26 | 848 | 829 | 200.8 |
| D | 12 | 218 | 100652 | 497.06 | 848 | 829 | 200.8 |
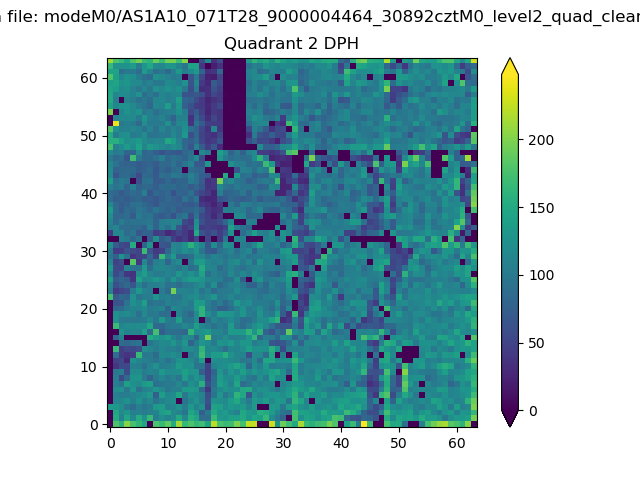
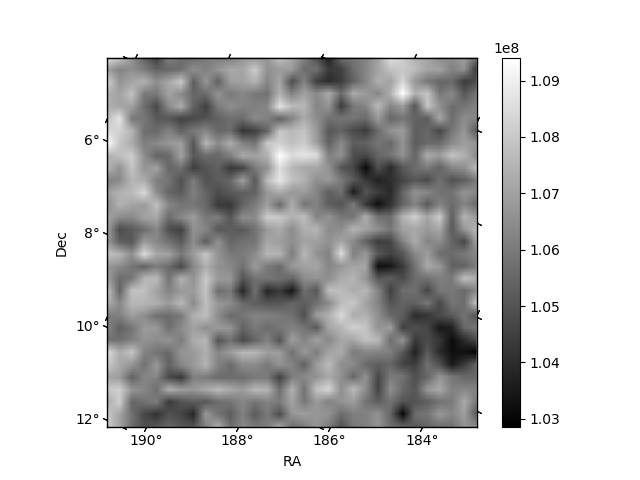
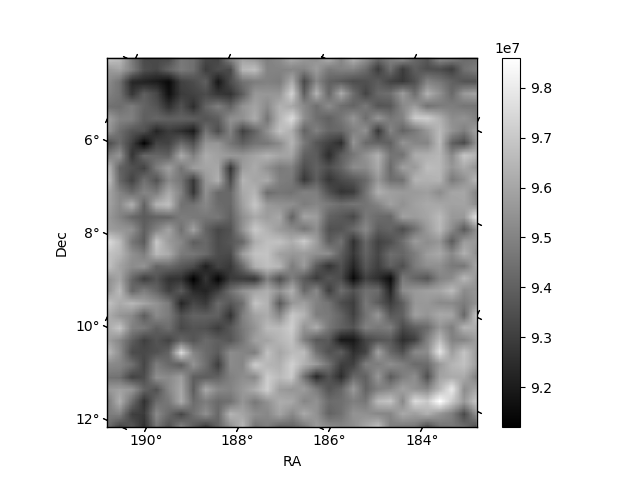
Histogram calculated using DETX and DETY for each event in the final _common_clean file
| Quadrant A | 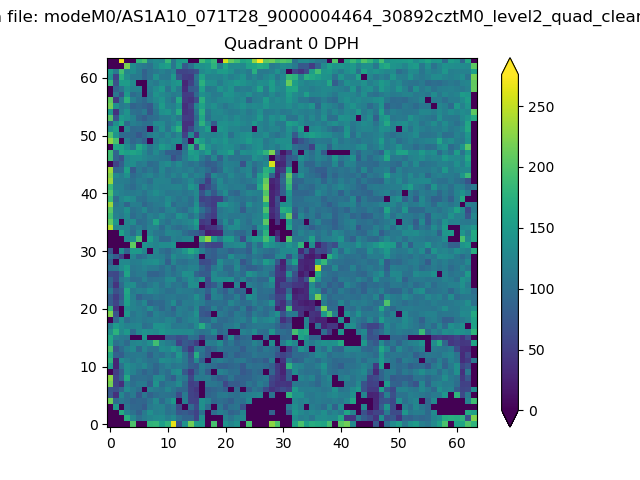 |
 |
Quadrant B |
|---|---|---|---|
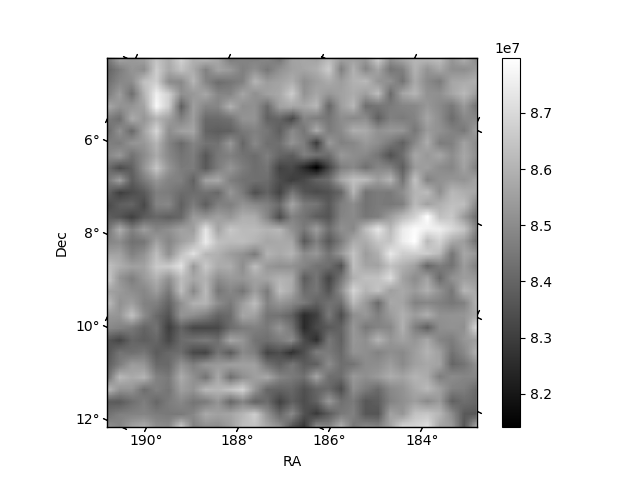
| Quadrant D |  |
 |
Quadrant C |
| Plot type | Count rate plots | Images |
|---|---|---|
| Comparison with Poisson distribution Blue bars denote a histogram of data divided into 1 sec bins. Red curve is a Poisson curve with rate = median count rate of data. |
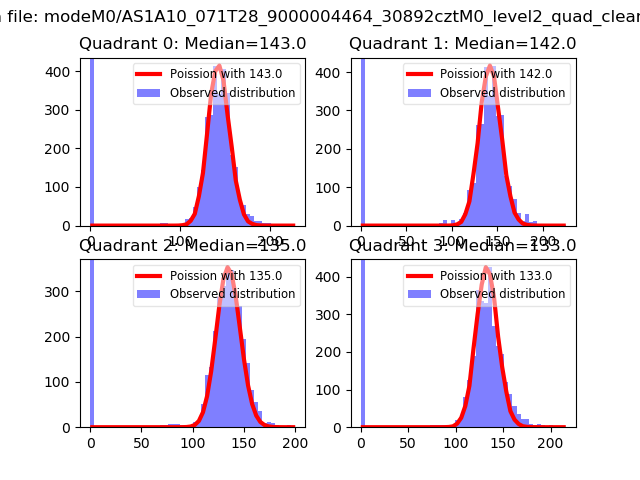 |
 |
| Quadrant-wise count rates Data is divided into 100 sec bins |
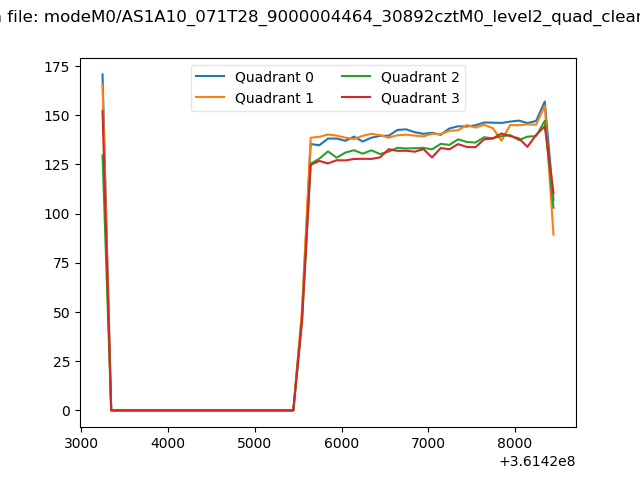 |
|
| Module-wise count rates for Quadrant A Data is divided into 100 sec bins |
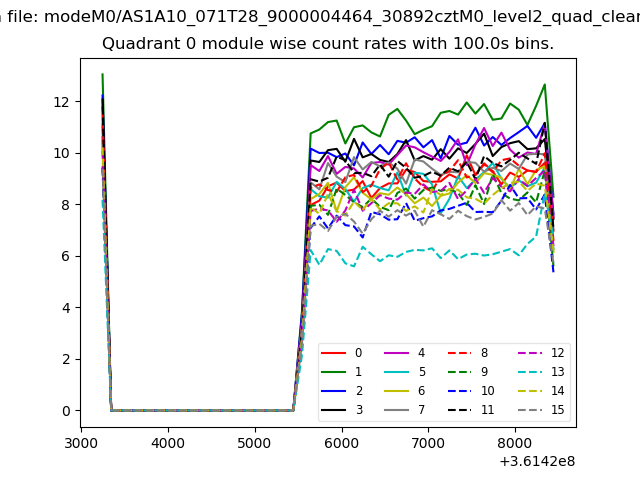 |
 |
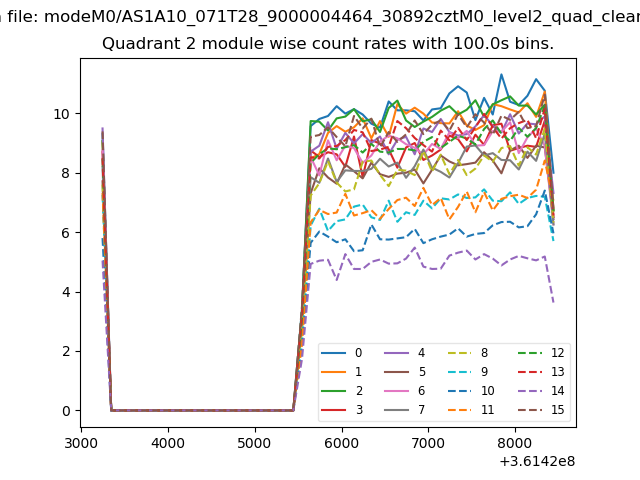
| Module-wise count rates for Quadrant B Data is divided into 100 sec bins |
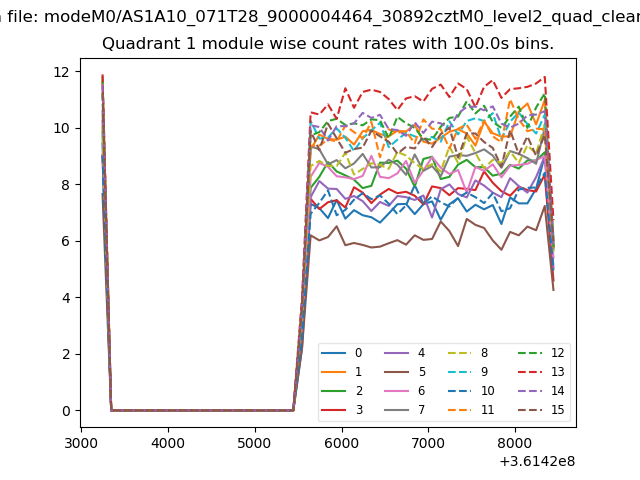 |
 |
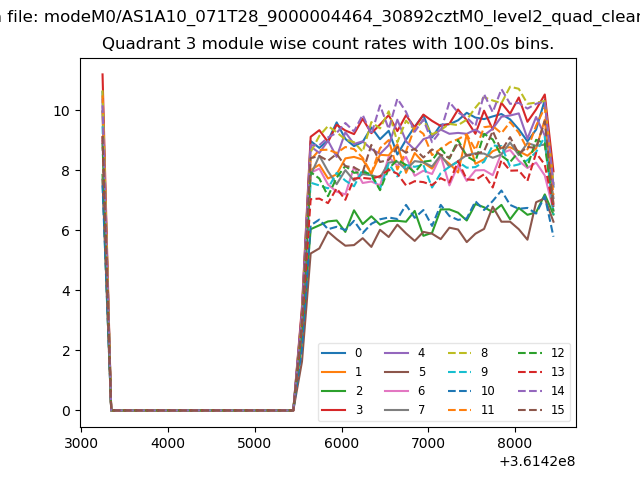
| Module-wise count rates for Quadrant C Data is divided into 100 sec bins |
 |
 |
| Module-wise count rates for Quadrant D Data is divided into 100 sec bins |
 |
 |
| Parameter | Plot |
|---|---|
| CZT HV Monitor | 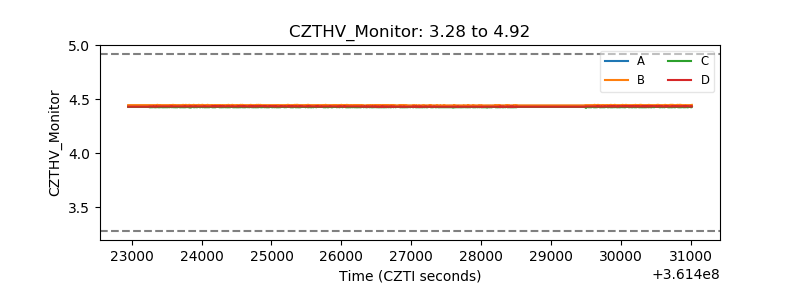 |
| D_VDD | 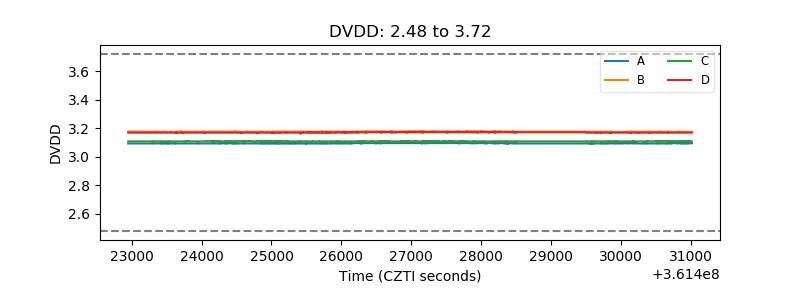 |
| Temperature 1 | 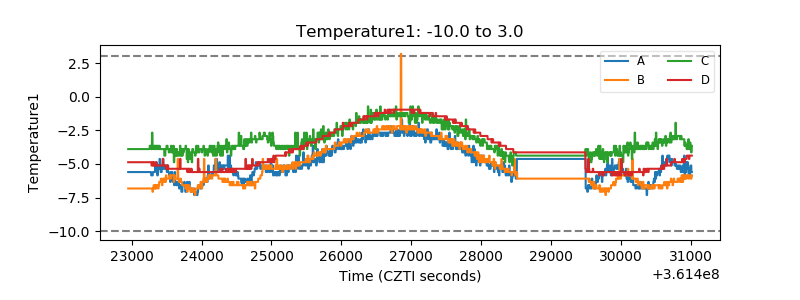 |
| Veto HV Monitor | 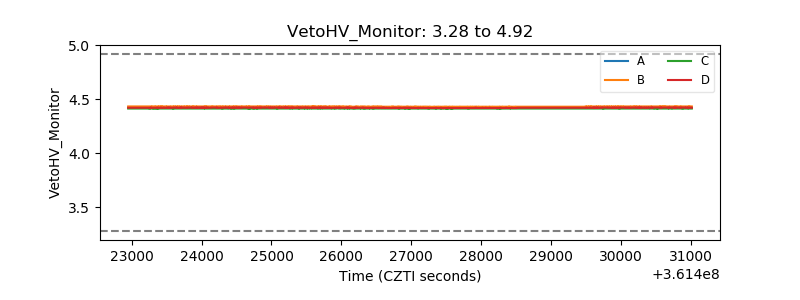 |
| Veto LLD | 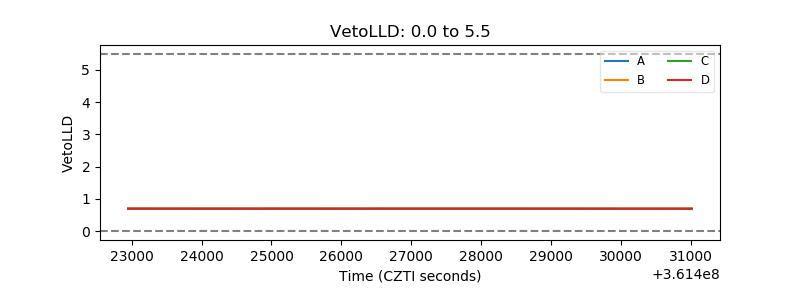 |
| Alpha Counter | 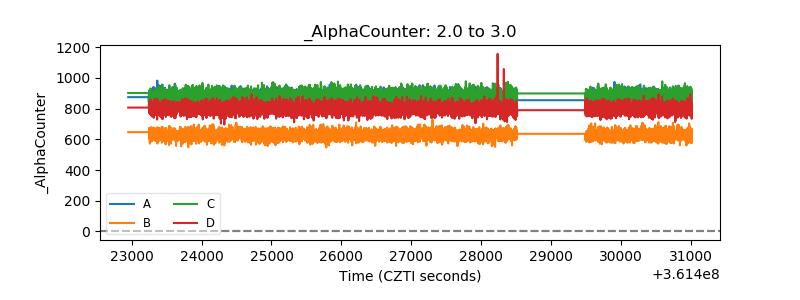 |
| _CPM_Rate | 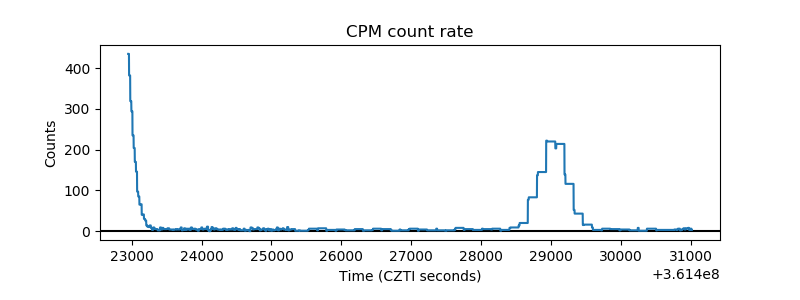 |
| CZT Counter | 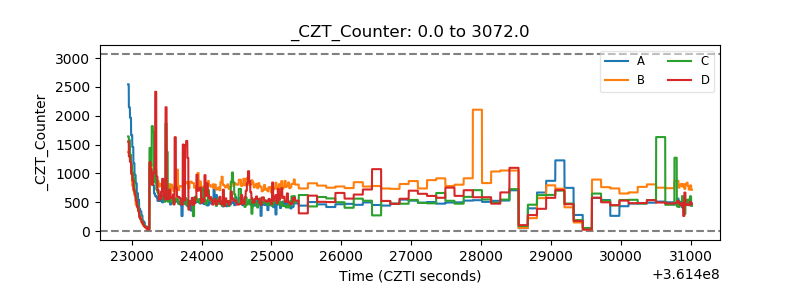 |
| +2.5 Volts monitor |  |
| +5 Volts monitor |  |
| _ROLL_ROT | 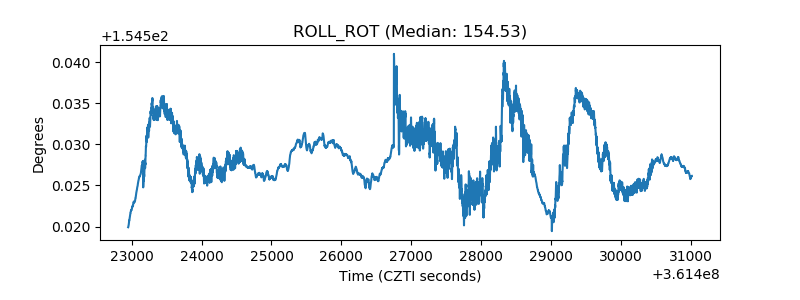 |
| _Roll_DEC | 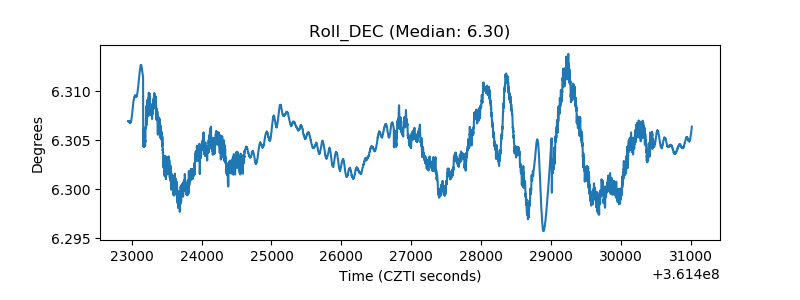 |
| _Roll_RA | 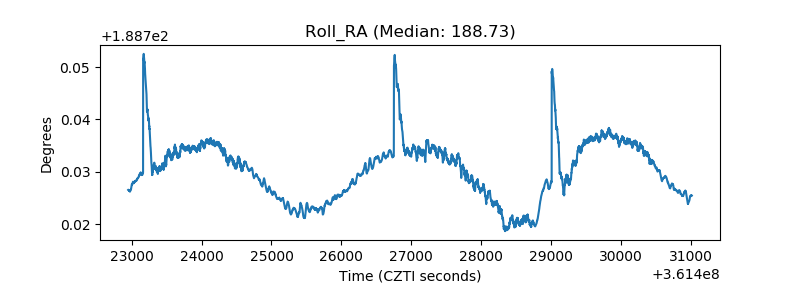 |
| Veto Counter | 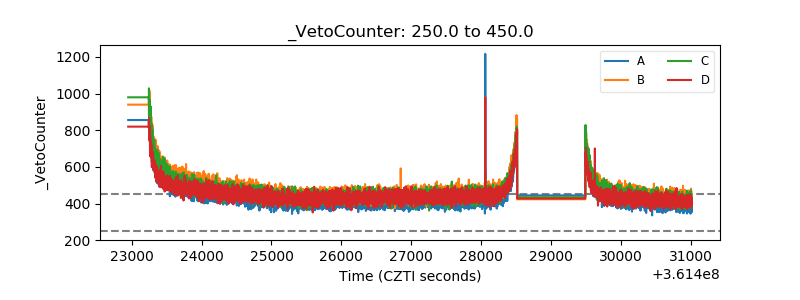 |