| Param | Original file | Final file |
|---|---|---|
| Filename | modeM0/AS1A10_071T28_9000004464_30894cztM0_level2.evt | modeM0/AS1A10_071T28_9000004464_30894cztM0_level2_quad_clean.evt |
| Size (bytes) | 669,412,800 | 82,877,760 |
| Size | 638.4 MB | 79.0 MB |
| Events in quadrant A | 3,862,048 | 510,513 |
| Events in quadrant B | 6,192,550 | 506,260 |
| Events in quadrant C | 3,937,574 | 483,841 |
| Events in quadrant D | 5,754,210 | 467,657 |
| Mode M9 | |||
|---|---|---|---|
| Quadrant | BADHDUFLAG | Total packets | Discarded packets |
| A | 0 | 6 | 0 |
| B | 0 | 6 | 0 |
| C | 0 | 6 | 0 |
| D | 0 | 6 | 0 |
| Mode M0 | |||
|---|---|---|---|
| Quadrant | BADHDUFLAG | Total packets | Discarded packets |
| A | 0 | 16323 | 4 |
| B | 0 | 24011 | 4 |
| C | 0 | 16445 | 4 |
| D | 0 | 22201 | 4 |
| Mode SS | |||
|---|---|---|---|
| Quadrant | BADHDUFLAG | Total packets | Discarded packets |
| A | 0 | 160 | 0 |
| B | 0 | 160 | 0 |
| C | 0 | 160 | 0 |
| D | 0 | 160 | 0 |
| Quadrant | Total seconds | Saturated seconds | Saturation percentage |
|---|---|---|---|
| A | 7782 | 353 | 4.536109% |
| B | 7782 | 524 | 6.733488% |
| C | 7782 | 385 | 4.947314% |
| D | 7782 | 463 | 5.949627% |
Noise dominated data is calculated using 1-second bins in cleaned event files. If a bin has >2000 counts, and if more than 50% of those come from <1% of pixels, then it is considered to be noise-dominated and hence unusable.
| Quadrant | # 1 sec bins | Bins with >0 counts | Bins with >2000 counts | High rate bins dominated by noise | Noise dominated (total time) | Noise dominated (detector-on time) | Marked lightcurve |
|---|---|---|---|---|---|---|---|
| A | 8417 | 7783 | 0 | 0 | 0.00% | 0.00% | 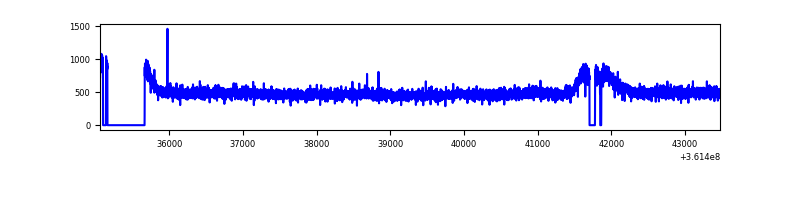 |
| B | 8417 | 7783 | 7 | 7 | 0.08% | 0.09% | 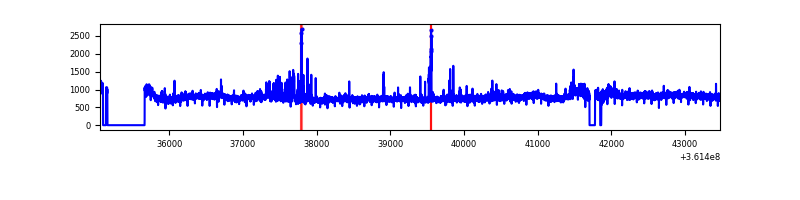 |
| C | 8417 | 7783 | 0 | 0 | 0.00% | 0.00% | 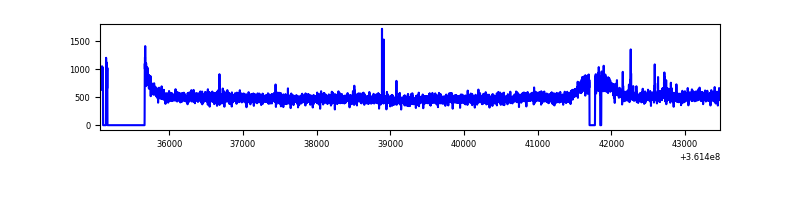 |
| D | 8417 | 7784 | 191 | 191 | 2.27% | 2.45% | 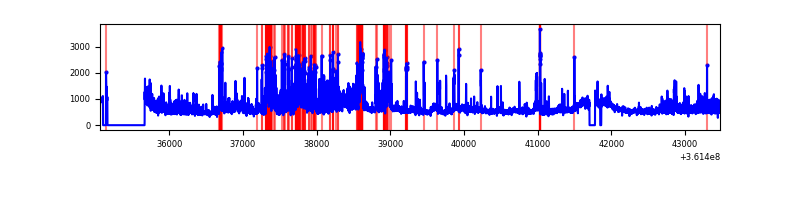 |
Top three noisy pixels from each quadrant. If the there are fewer than three noisy pixels in the level2.evt file, extra rows are filled as -1
| Pixel properties | Quadrant properties | ||||||
|---|---|---|---|---|---|---|---|
| Quadrant | DetID | PixID | Counts | Sigma | Mean | Median | Sigma |
| A | 11 | 47 | 17418 | 82.12 | 994 | 972 | 200.3 |
| A | 13 | 254 | 13768 | 63.89 | 994 | 972 | 200.3 |
| A | 3 | 137 | 10515 | 47.65 | 994 | 972 | 200.3 |
| B | 6 | 159 | 2124871 | 11140.49 | 977 | 949 | 190.6 |
| B | 0 | 190 | 101169 | 525.68 | 977 | 949 | 190.6 |
| B | 6 | 36 | 49346 | 253.85 | 977 | 949 | 190.6 |
| C | 14 | 238 | 151630 | 675.94 | 946 | 948 | 222.9 |
| C | 3 | 233 | 47546 | 209.03 | 946 | 948 | 222.9 |
| C | 0 | 10 | 24888 | 107.39 | 946 | 948 | 222.9 |
| D | 1 | 52 | 648859 | 2866.31 | 949 | 925 | 226.1 |
| D | 8 | 195 | 638360 | 2819.87 | 949 | 925 | 226.1 |
| D | 12 | 218 | 617872 | 2729.24 | 949 | 925 | 226.1 |
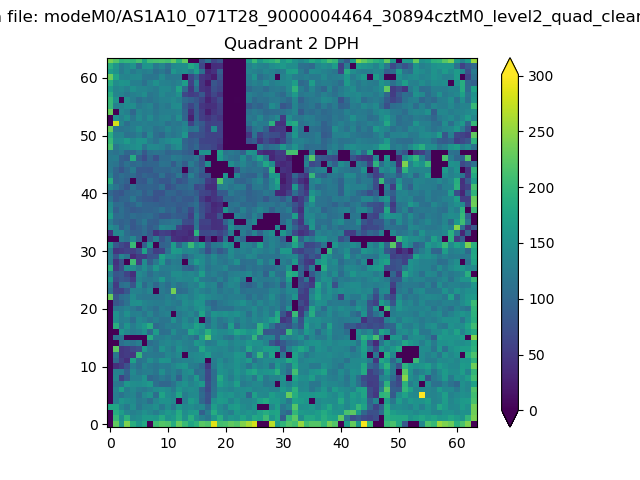
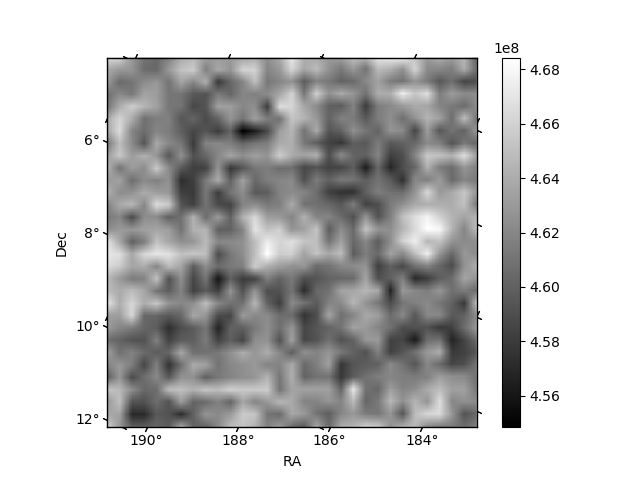
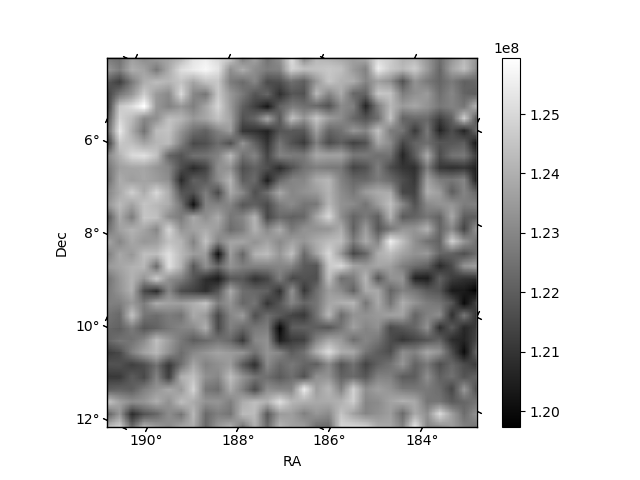
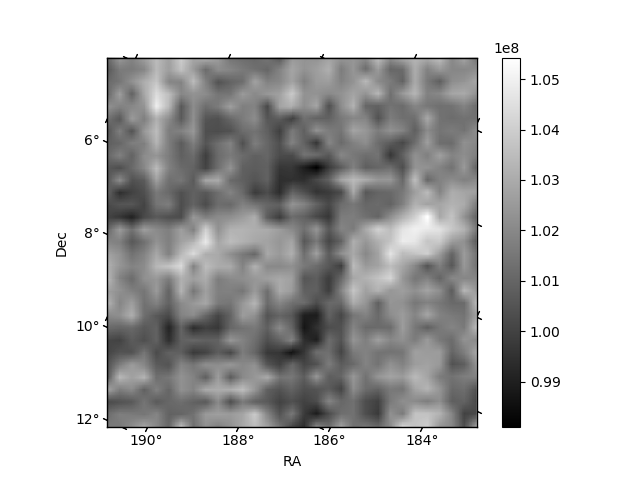
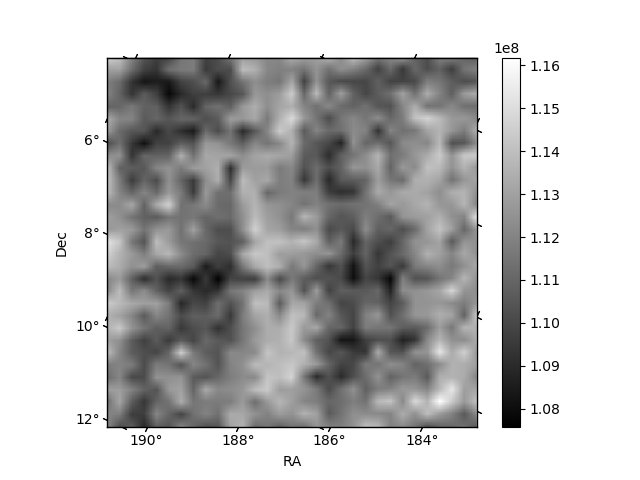
Histogram calculated using DETX and DETY for each event in the final _common_clean file
| Quadrant A | 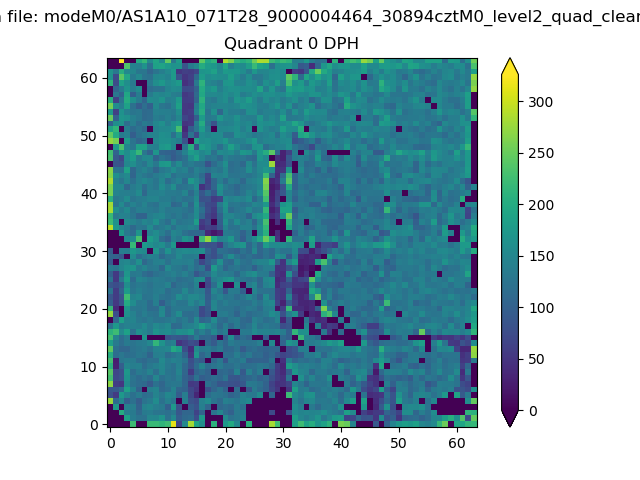 |
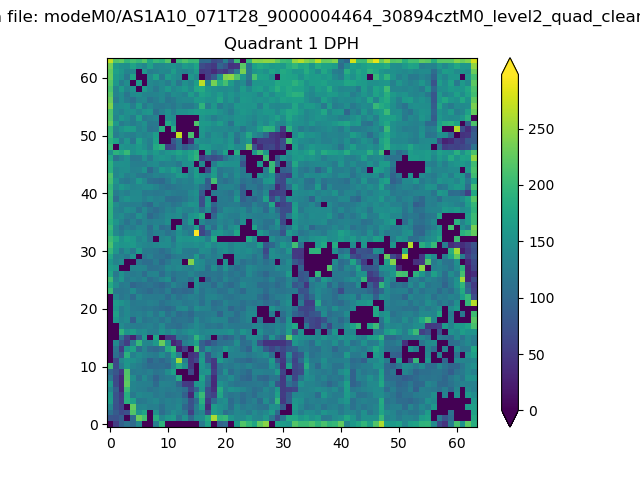 |
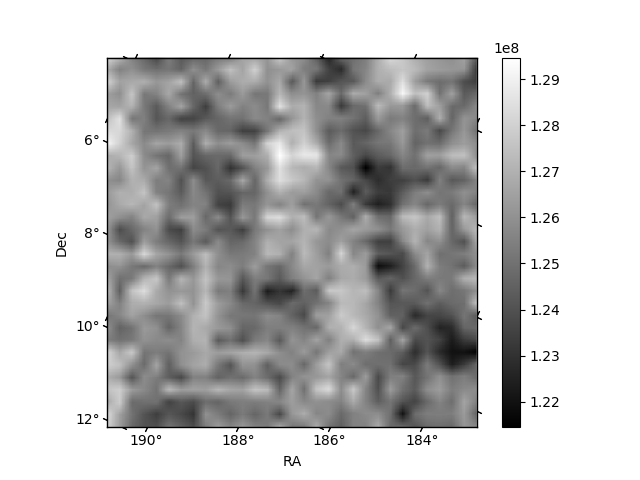
Quadrant B |
|---|---|---|---|
| Quadrant D | 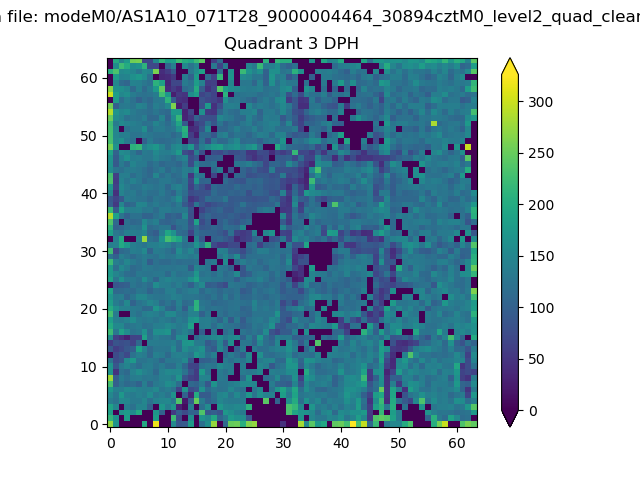 |
 |
Quadrant C |
| Plot type | Count rate plots | Images |
|---|---|---|
| Comparison with Poisson distribution Blue bars denote a histogram of data divided into 1 sec bins. Red curve is a Poisson curve with rate = median count rate of data. |
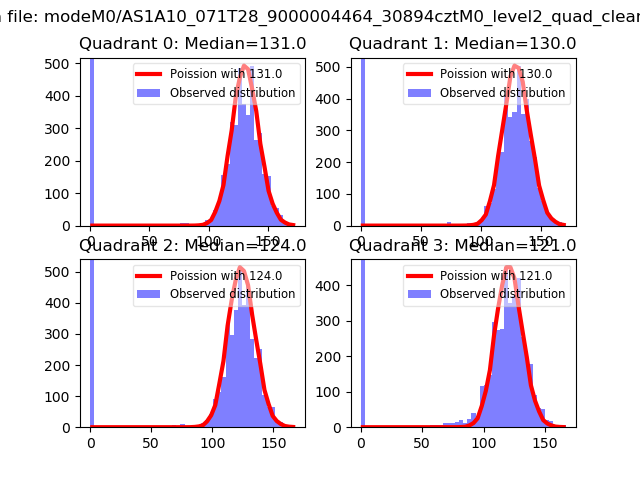 |
 |
| Quadrant-wise count rates Data is divided into 100 sec bins |
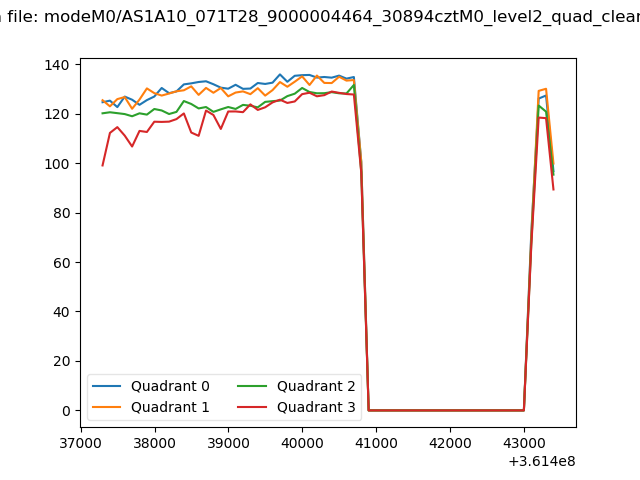 |
|
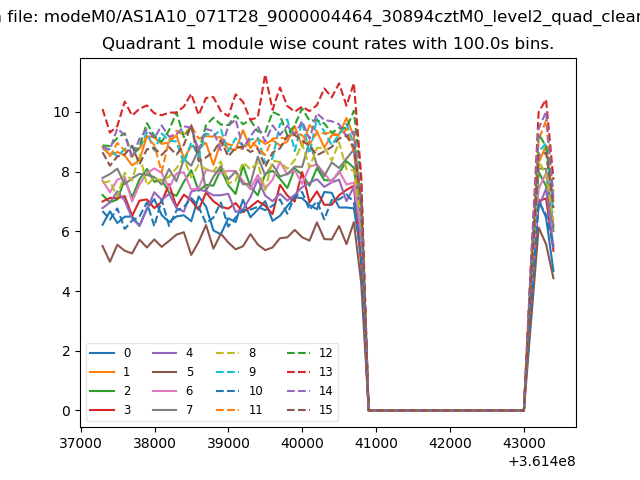
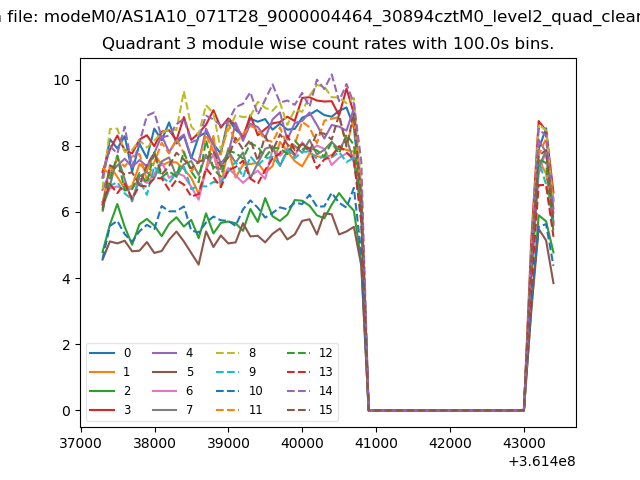
| Module-wise count rates for Quadrant A Data is divided into 100 sec bins |
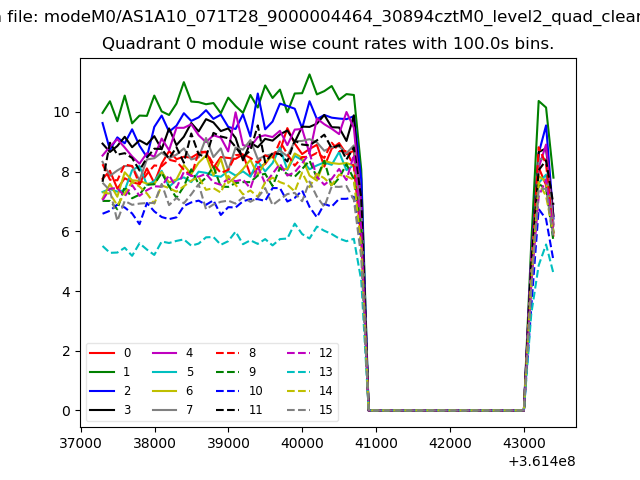 |
 |
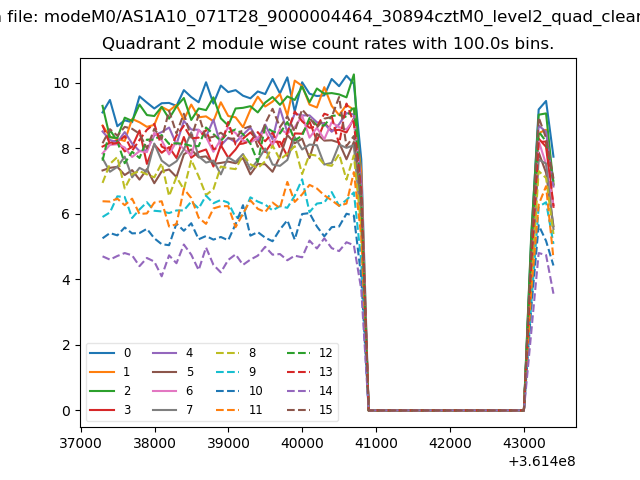
| Module-wise count rates for Quadrant B Data is divided into 100 sec bins |
 |
 |
| Module-wise count rates for Quadrant C Data is divided into 100 sec bins |
 |
 |
| Module-wise count rates for Quadrant D Data is divided into 100 sec bins |
 |
 |
| Parameter | Plot |
|---|---|
| CZT HV Monitor | 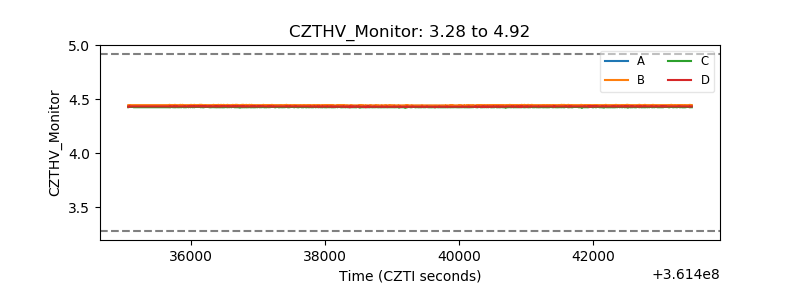 |
| D_VDD | 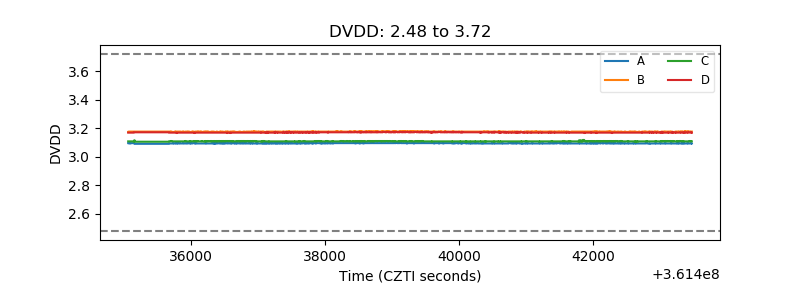 |
| Temperature 1 | 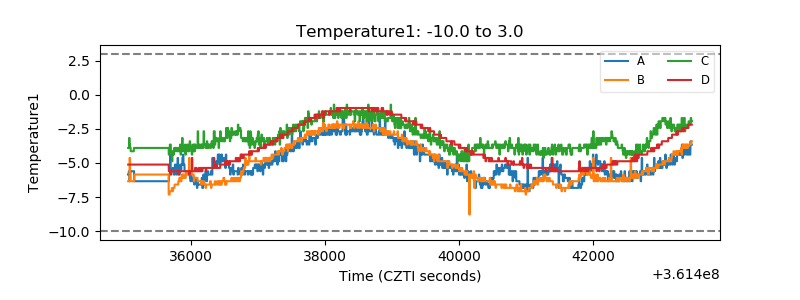 |
| Veto HV Monitor | 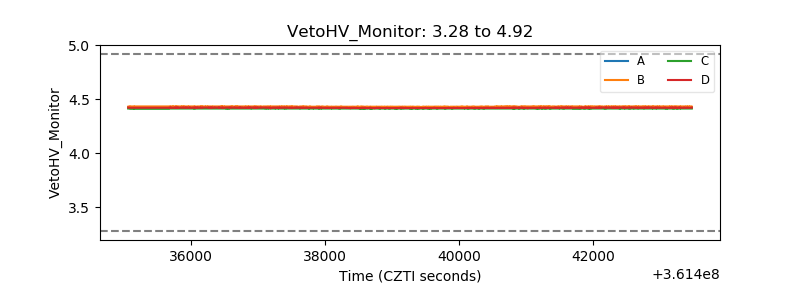 |
| Veto LLD | 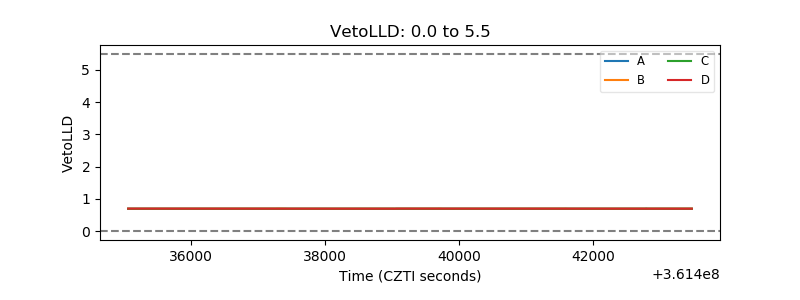 |
| Alpha Counter | 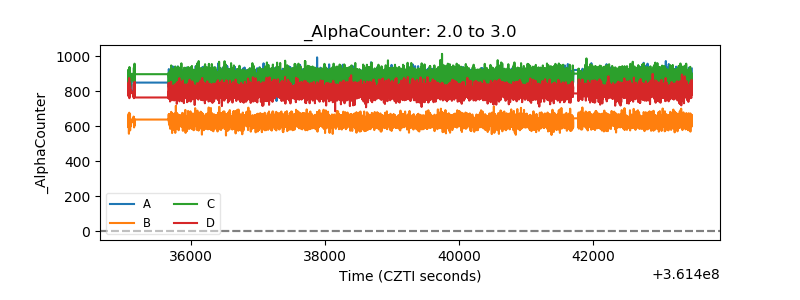 |
| _CPM_Rate | 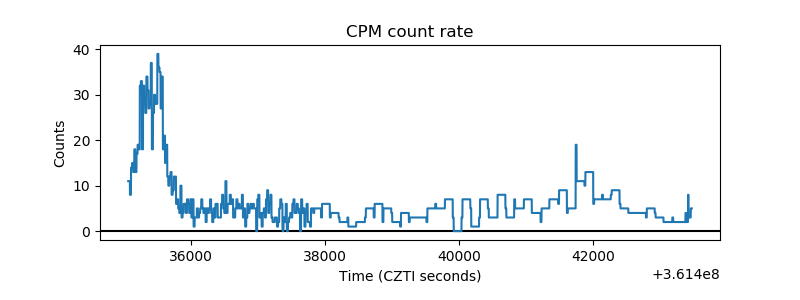 |
| CZT Counter | 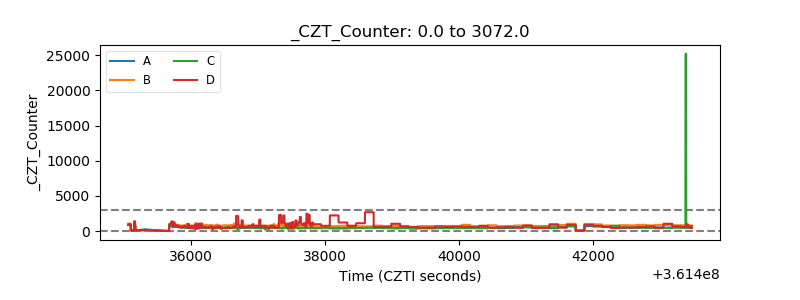 |
| +2.5 Volts monitor |  |
| +5 Volts monitor |  |
| _ROLL_ROT | 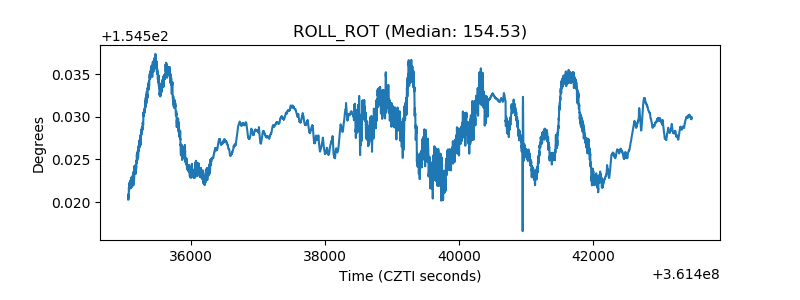 |
| _Roll_DEC | 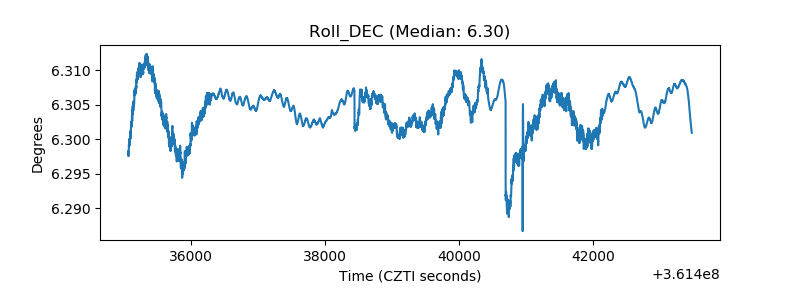 |
| _Roll_RA | 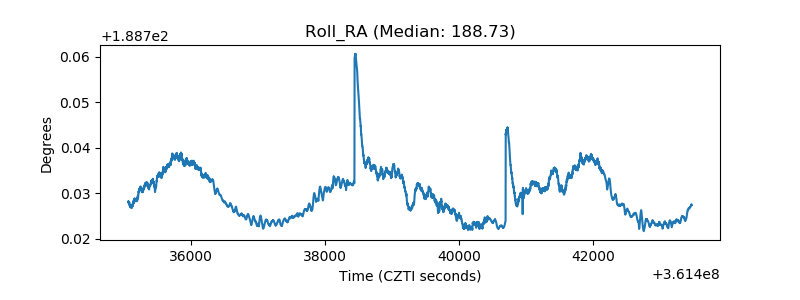 |
| Veto Counter | 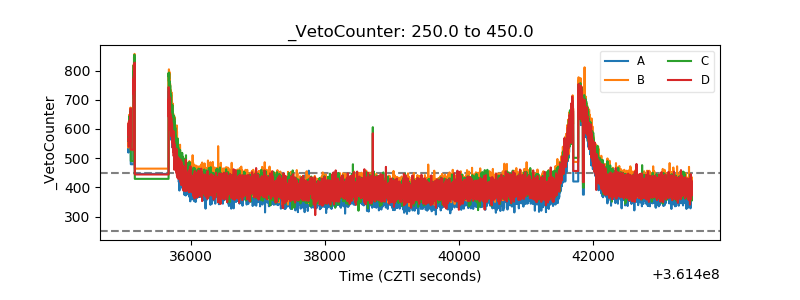 |