| Param | Original file | Final file |
|---|---|---|
| Filename | modeM0/AS1A10_071T28_9000004464_30895cztM0_level2.evt | modeM0/AS1A10_071T28_9000004464_30895cztM0_level2_quad_clean.evt |
| Size (bytes) | 344,047,680 | 62,904,960 |
| Size | 328.1 MB | 60.0 MB |
| Events in quadrant A | 1,905,810 | 416,625 |
| Events in quadrant B | 3,184,641 | 413,878 |
| Events in quadrant C | 2,007,423 | 395,217 |
| Events in quadrant D | 3,040,264 | 387,496 |
| Mode M0 | |||
|---|---|---|---|
| Quadrant | BADHDUFLAG | Total packets | Discarded packets |
| A | 0 | 8340 | 10 |
| B | 0 | 12600 | 21 |
| C | 0 | 8479 | 10 |
| D | 0 | 11791 | 7 |
| Mode SS | |||
|---|---|---|---|
| Quadrant | BADHDUFLAG | Total packets | Discarded packets |
| A | 0 | 82 | 0 |
| B | 0 | 82 | 0 |
| C | 0 | 82 | 0 |
| D | 0 | 82 | 0 |
| Quadrant | Total seconds | Saturated seconds | Saturation percentage |
|---|---|---|---|
| A | 4137 | 3 | 0.072516% |
| B | 4136 | 20 | 0.483559% |
| C | 4138 | 15 | 0.362494% |
| D | 4140 | 9 | 0.217391% |
Noise dominated data is calculated using 1-second bins in cleaned event files. If a bin has >2000 counts, and if more than 50% of those come from <1% of pixels, then it is considered to be noise-dominated and hence unusable.
| Quadrant | # 1 sec bins | Bins with >0 counts | Bins with >2000 counts | High rate bins dominated by noise | Noise dominated (total time) | Noise dominated (detector-on time) | Marked lightcurve |
|---|---|---|---|---|---|---|---|
| A | 4142 | 4142 | 0 | 0 | 0.00% | 0.00% |  |
| B | 4143 | 4143 | 4 | 4 | 0.10% | 0.10% |  |
| C | 4143 | 4142 | 6 | 6 | 0.14% | 0.14% |  |
| D | 4143 | 4143 | 19 | 19 | 0.46% | 0.46% |  |
Top three noisy pixels from each quadrant. If the there are fewer than three noisy pixels in the level2.evt file, extra rows are filled as -1
| Pixel properties | Quadrant properties | ||||||
|---|---|---|---|---|---|---|---|
| Quadrant | DetID | PixID | Counts | Sigma | Mean | Median | Sigma |
| A | 11 | 47 | 13646 | 131.4 | 487 | 477 | 100.2 |
| A | 0 | 13 | 10013 | 95.15 | 487 | 477 | 100.2 |
| A | 13 | 254 | 7090 | 65.98 | 487 | 477 | 100.2 |
| B | 6 | 159 | 1155724 | 12473.2 | 479 | 468 | 92.6 |
| B | 6 | 36 | 48597 | 519.64 | 479 | 468 | 92.6 |
| B | 0 | 190 | 21249 | 224.37 | 479 | 468 | 92.6 |
| C | 14 | 238 | 73946 | 664.72 | 463 | 465 | 110.5 |
| C | 3 | 233 | 55348 | 496.48 | 463 | 465 | 110.5 |
| C | 0 | 10 | 53372 | 478.6 | 463 | 465 | 110.5 |
| D | 1 | 52 | 746313 | 6656.48 | 468 | 458 | 112.0 |
| D | 8 | 195 | 426149 | 3799.13 | 468 | 458 | 112.0 |
| D | 2 | 250 | 46700 | 412.69 | 468 | 458 | 112.0 |
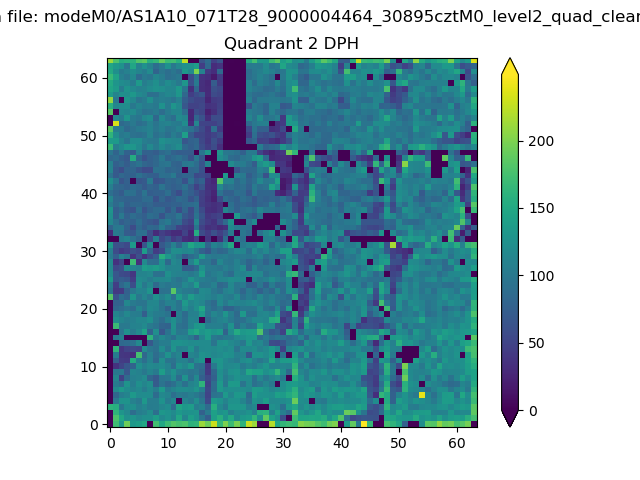
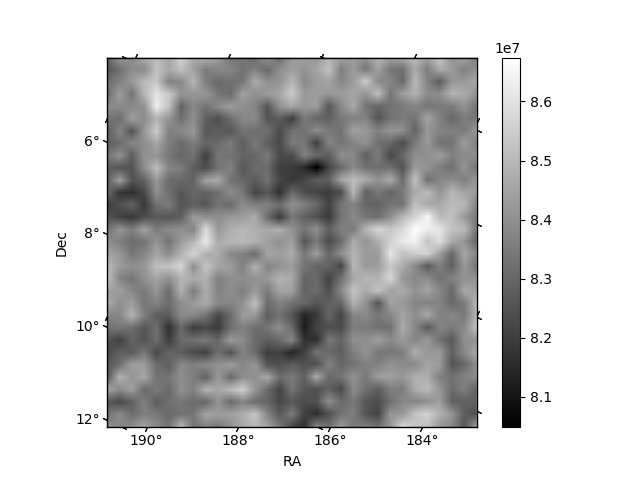
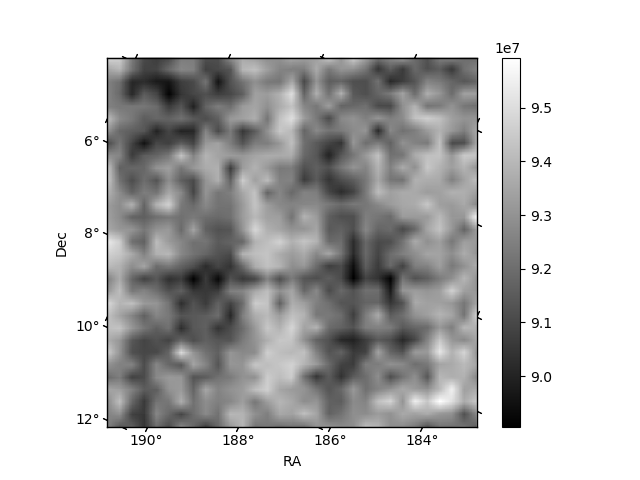
Histogram calculated using DETX and DETY for each event in the final _common_clean file
| Quadrant A | 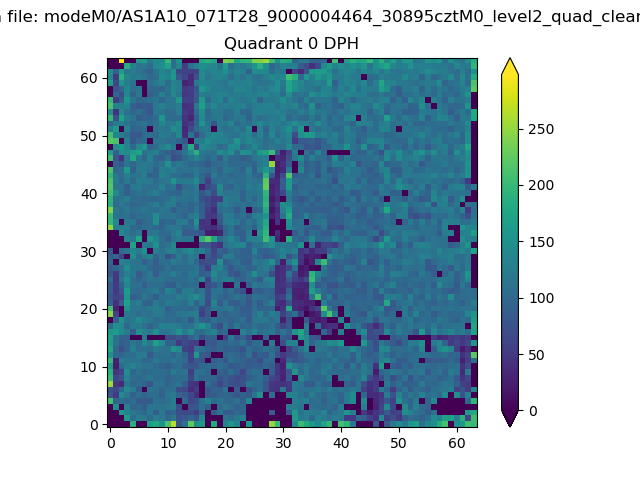 |
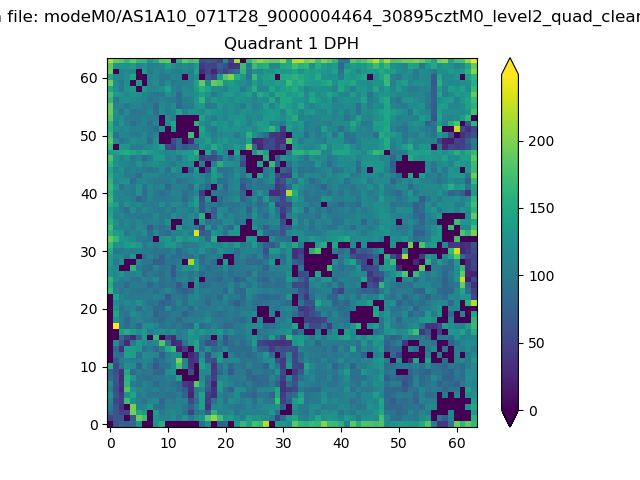 |
Quadrant B |
|---|---|---|---|
| Quadrant D | 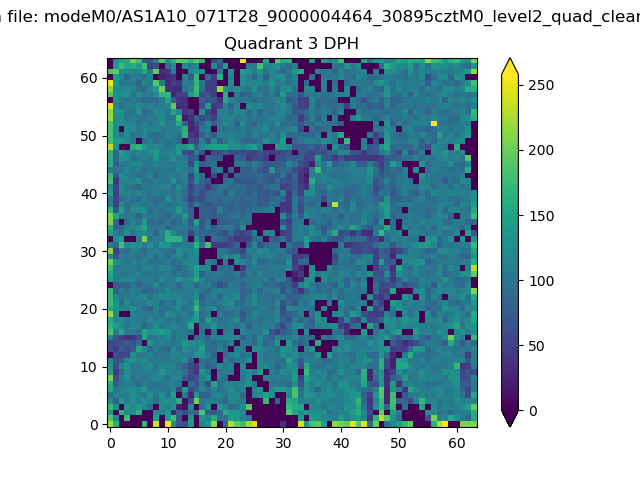 |
 |
Quadrant C |
| Plot type | Count rate plots | Images |
|---|---|---|
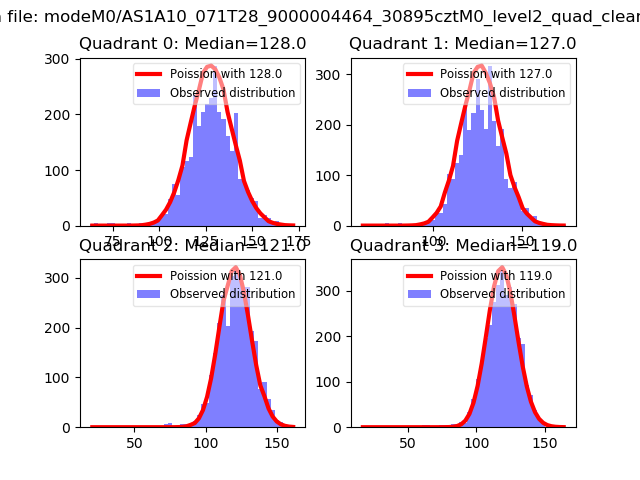
| Comparison with Poisson distribution Blue bars denote a histogram of data divided into 1 sec bins. Red curve is a Poisson curve with rate = median count rate of data. |
 |
 |
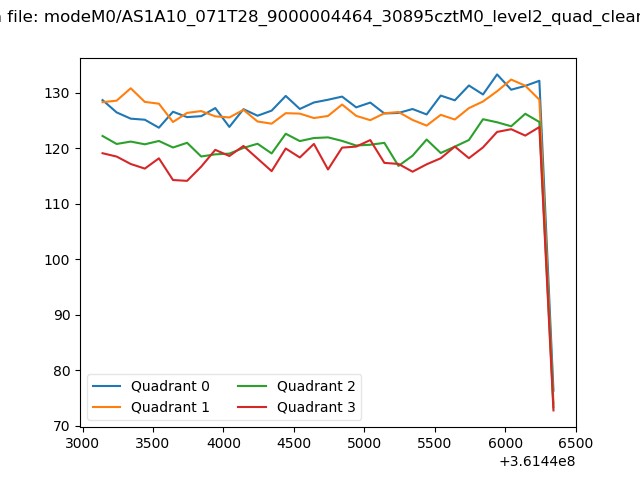
| Quadrant-wise count rates Data is divided into 100 sec bins |
 |
|
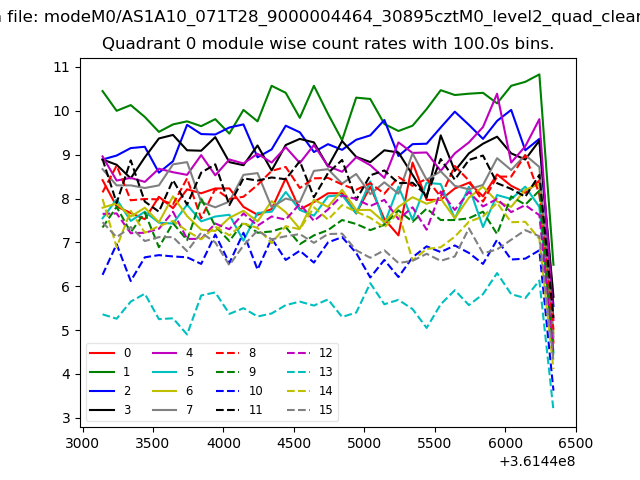
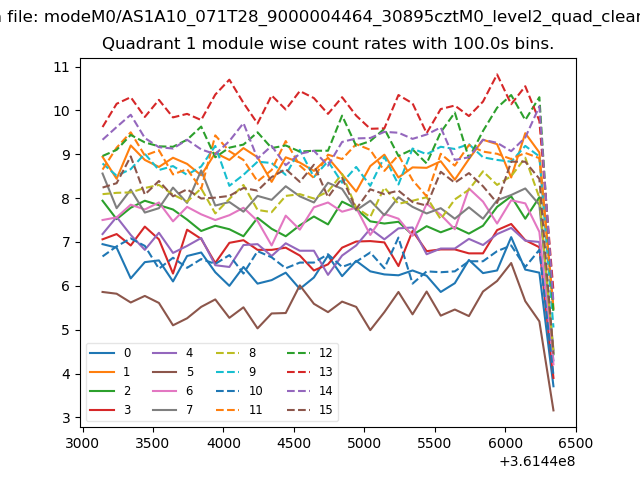
| Module-wise count rates for Quadrant A Data is divided into 100 sec bins |
 |
 |
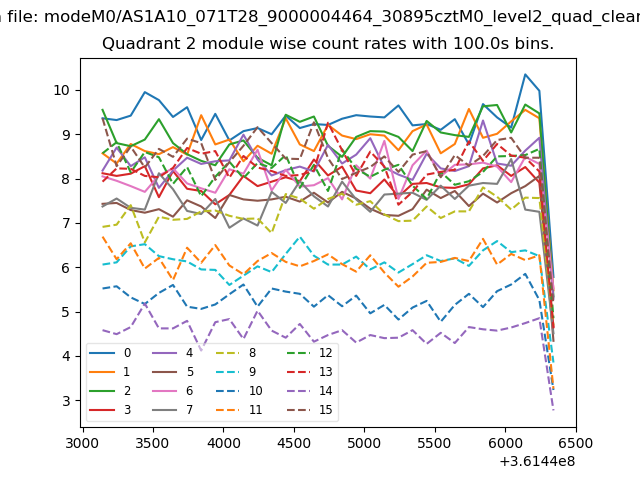
| Module-wise count rates for Quadrant B Data is divided into 100 sec bins |
 |
 |
| Module-wise count rates for Quadrant C Data is divided into 100 sec bins |
 |
 |
| Module-wise count rates for Quadrant D Data is divided into 100 sec bins |
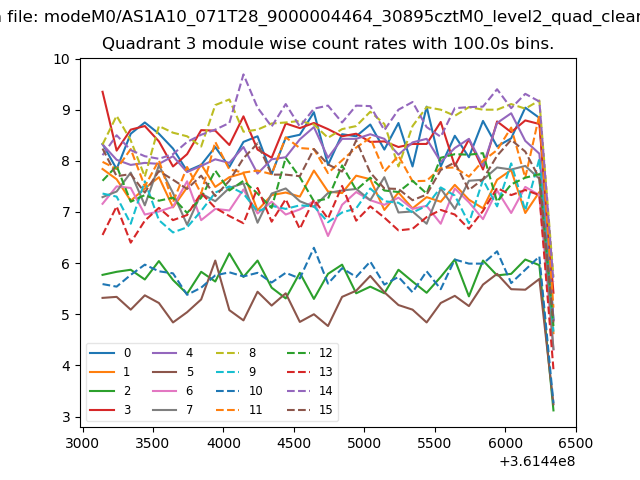 |
 |
| Parameter | Plot |
|---|---|
| CZT HV Monitor | 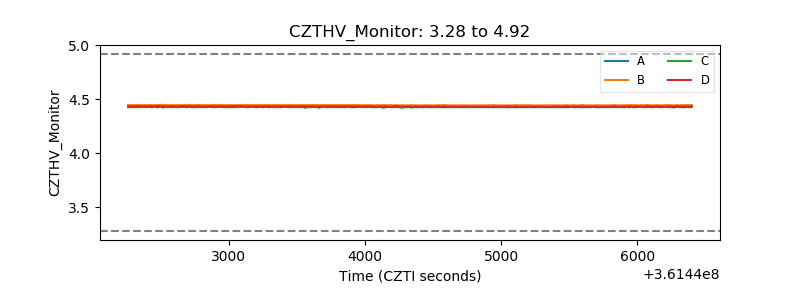 |
| D_VDD | 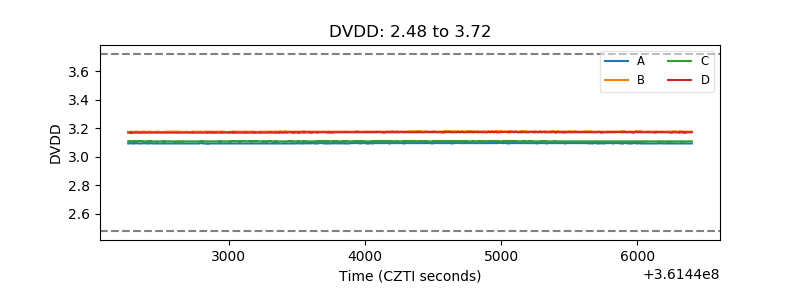 |
| Temperature 1 | 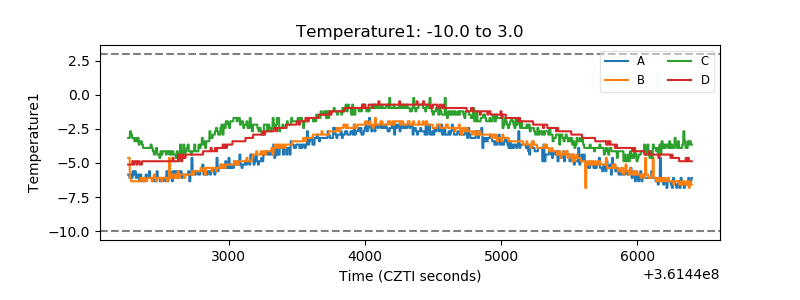 |
| Veto HV Monitor | 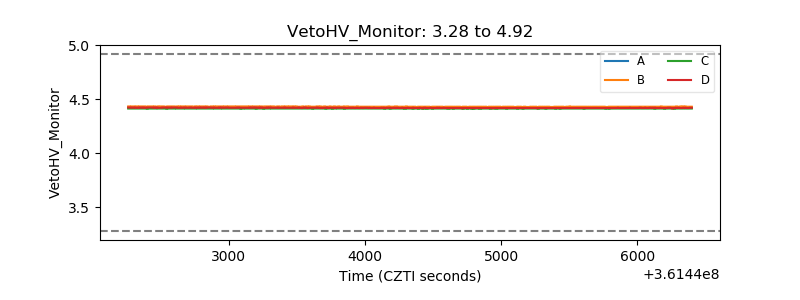 |
| Veto LLD |  |
| Alpha Counter | 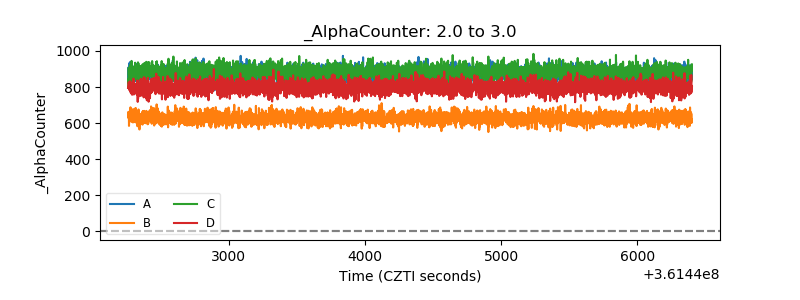 |
| _CPM_Rate | 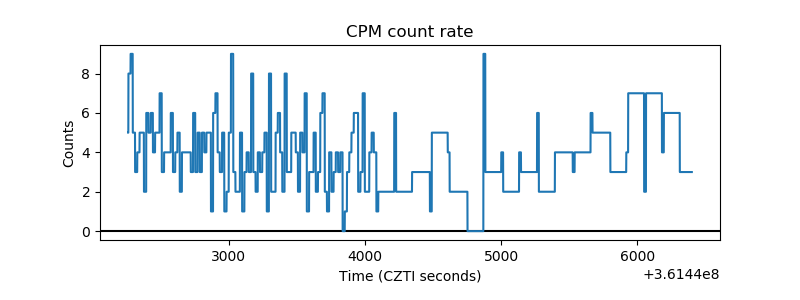 |
| CZT Counter | 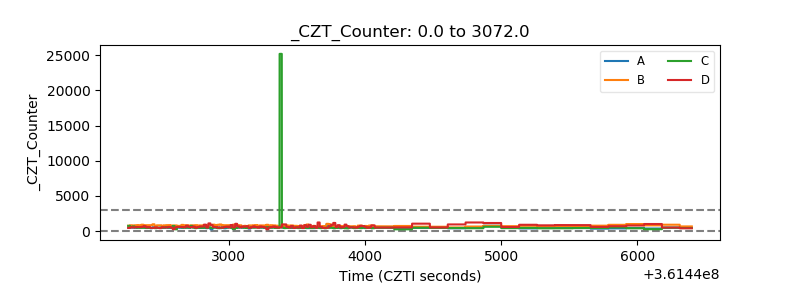 |
| +2.5 Volts monitor |  |
| +5 Volts monitor | 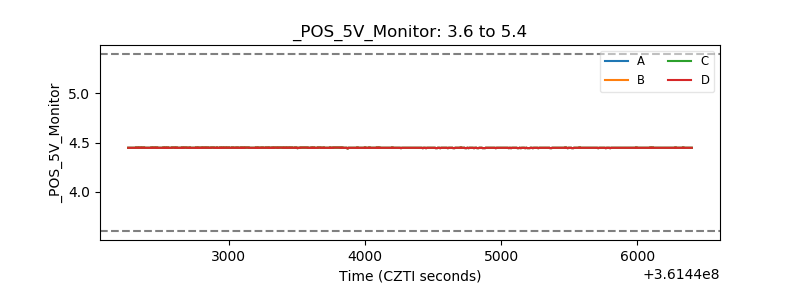 |
| _ROLL_ROT | 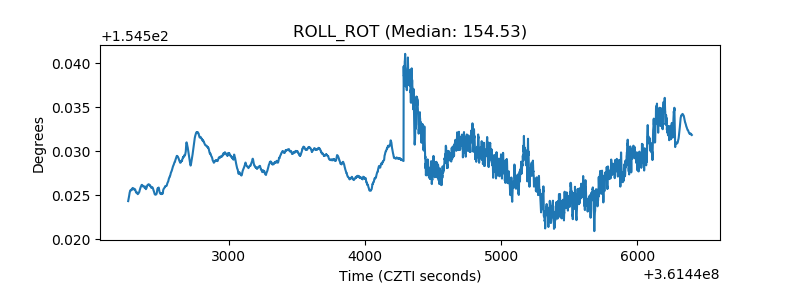 |
| _Roll_DEC | 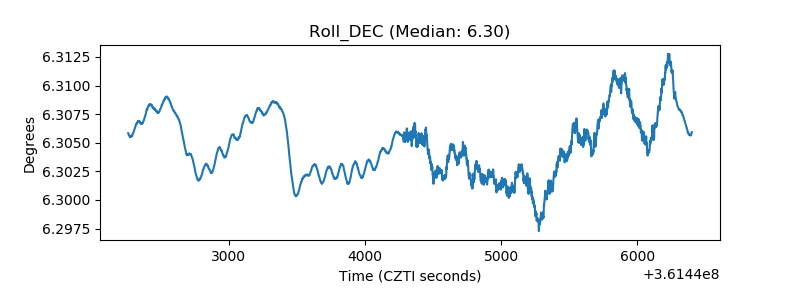 |
| _Roll_RA | 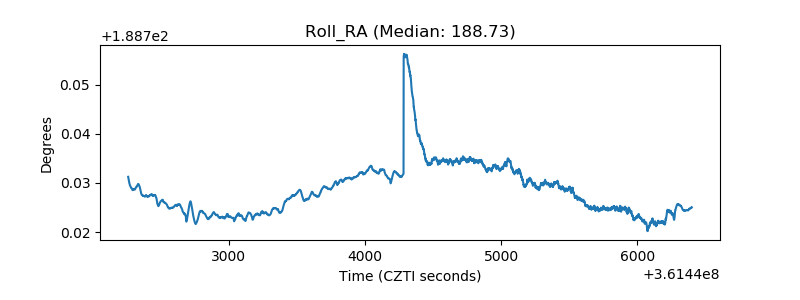 |
| Veto Counter | 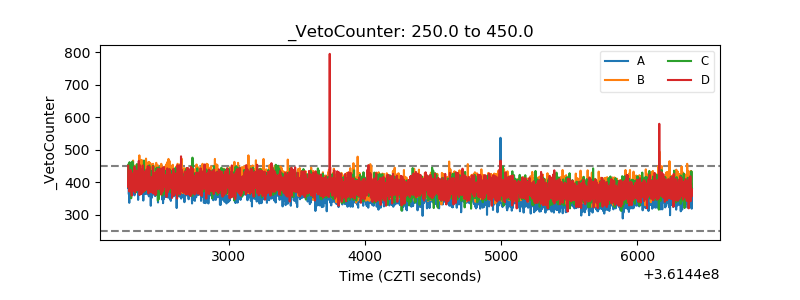 |