| Param | Original file | Final file |
|---|---|---|
| Filename | modeM0/AS1C06_004T01_9000004466cztM0_level2.fits | modeM0/AS1C06_004T01_9000004466cztM0_level2_quad_clean.evt |
| Size (bytes) | 677,410,560 | 661,887,360 |
| Size | 646.0 MB | 631.2 MB |
| Events in quadrant A | 4,247,790 | 4,095,181 |
| Events in quadrant B | 3,970,462 | 3,980,345 |
| Events in quadrant C | 4,000,022 | 3,685,799 |
| Events in quadrant D | 3,559,262 | 3,548,983 |
| Mode M0 | |||
|---|---|---|---|
| Quadrant | BADHDUFLAG | Total packets | Discarded packets |
| A | 0 | 145031 | 0 |
| B | 0 | 224643 | 0 |
| C | 0 | 155558 | 0 |
| D | 0 | 189331 | 0 |
| Mode M9 | |||
|---|---|---|---|
| Quadrant | BADHDUFLAG | Total packets | Discarded packets |
| A | 0 | 112 | 0 |
| B | 0 | 112 | 0 |
| C | 0 | 112 | 0 |
| D | 0 | 112 | 0 |
| Mode SS | |||
|---|---|---|---|
| Quadrant | BADHDUFLAG | Total packets | Discarded packets |
| A | 0 | 1416 | 0 |
| B | 0 | 1414 | 0 |
| C | 0 | 1416 | 0 |
| D | 0 | 1410 | 0 |
| Quadrant | Total seconds | Saturated seconds | Saturation percentage |
|---|---|---|---|
| A | 69053 | 905 | 1.310588% |
| B | 68969 | 2133 | 3.092694% |
| C | 69030 | 5274 | 7.640156% |
| D | 69007 | 2691 | 3.899604% |
Noise dominated data is calculated using 1-second bins in cleaned event files. If a bin has >2000 counts, and if more than 50% of those come from <1% of pixels, then it is considered to be noise-dominated and hence unusable.
| Quadrant | # 1 sec bins | Bins with >0 counts | Bins with >2000 counts | High rate bins dominated by noise | Noise dominated (total time) | Noise dominated (detector-on time) | Marked lightcurve |
|---|---|---|---|---|---|---|---|
| A | 81080 | 69165 | 0 | 0 | 0.00% | 0.00% |  |
| B | 81080 | 69063 | 0 | 0 | 0.00% | 0.00% | 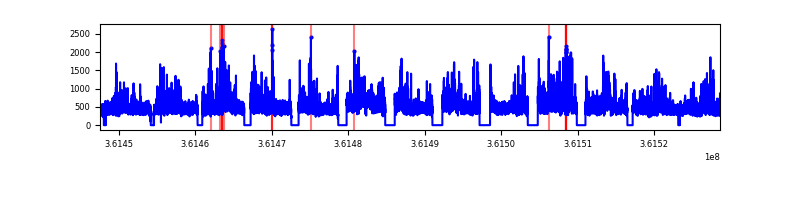 |
| C | 81080 | 69037 | 0 | 0 | 0.00% | 0.00% | 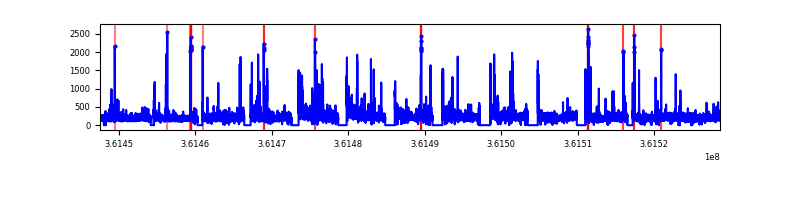 |
| D | 81080 | 69084 | 0 | 0 | 0.00% | 0.00% | 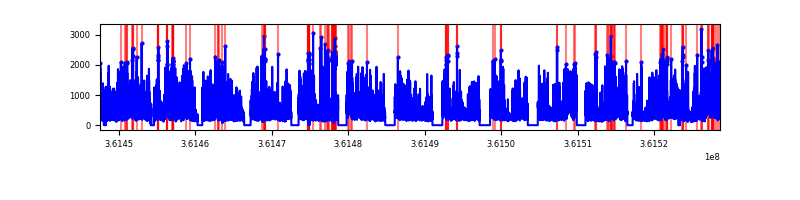 |
Top three noisy pixels from each quadrant. If the there are fewer than three noisy pixels in the level2.evt file, extra rows are filled as -1
| Pixel properties | Quadrant properties | ||||||
|---|---|---|---|---|---|---|---|
| Quadrant | DetID | PixID | Counts | Sigma | Mean | Median | Sigma |
| A | 0 | 29 | 3476 | 8.99 | 1108 | 1047 | 270.3 |
| A | 7 | 110 | 3463 | 8.94 | 1108 | 1047 | 270.3 |
| A | 9 | 19 | 3187 | 7.92 | 1108 | 1047 | 270.3 |
| B | 2 | 9 | 3284 | 11.13 | 1051 | 1007 | 204.6 |
| B | 2 | 8 | 2701 | 8.28 | 1051 | 1007 | 204.6 |
| B | 5 | 255 | 2664 | 8.1 | 1051 | 1007 | 204.6 |
| C | 12 | 241 | 2782 | 6.78 | 1059 | 998 | 263.0 |
| C | 3 | 126 | 2752 | 6.67 | 1059 | 998 | 263.0 |
| C | 9 | 209 | 2683 | 6.41 | 1059 | 998 | 263.0 |
| D | 15 | 46 | 2747 | 6.74 | 1019 | 930 | 269.6 |
| D | 7 | 3 | 2656 | 6.4 | 1019 | 930 | 269.6 |
| D | 6 | 231 | 2528 | 5.93 | 1019 | 930 | 269.6 |
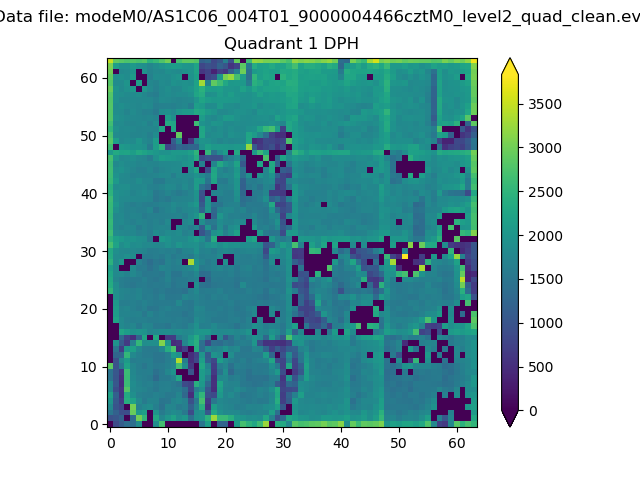
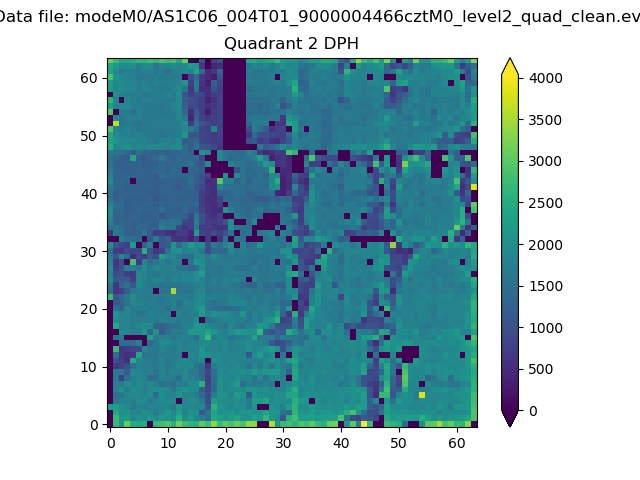
Histogram calculated using DETX and DETY for each event in the final _common_clean file
| Quadrant A |  |
 |
Quadrant B |
|---|---|---|---|
| Quadrant D |  |
 |
Quadrant C |
| Plot type | Count rate plots | Images |
|---|---|---|
| Comparison with Poisson distribution Blue bars denote a histogram of data divided into 1 sec bins. Red curve is a Poisson curve with rate = median count rate of data. |
 |
 |
| Quadrant-wise count rates Data is divided into 100 sec bins |
 |
|
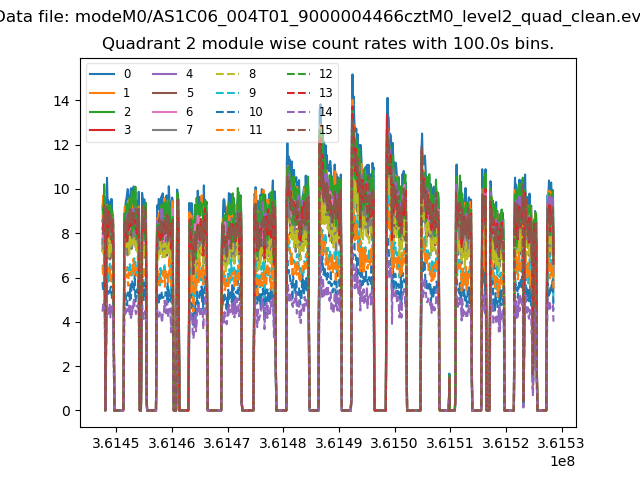
| Module-wise count rates for Quadrant A Data is divided into 100 sec bins |
 |
 |
| Module-wise count rates for Quadrant B Data is divided into 100 sec bins |
 |
 |
| Module-wise count rates for Quadrant C Data is divided into 100 sec bins |
 |
 |
| Module-wise count rates for Quadrant D Data is divided into 100 sec bins |
 |
 |
| Parameter | Plot |
|---|---|
| CZT HV Monitor |  |
| D_VDD | 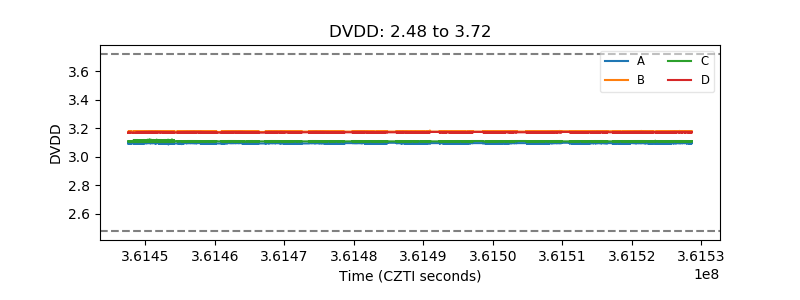 |
| Temperature 1 |  |
| Veto HV Monitor | 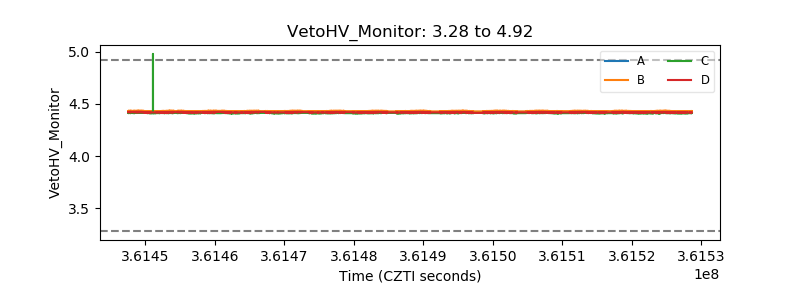 |
| Veto LLD |  |
| Alpha Counter |  |
| _CPM_Rate | 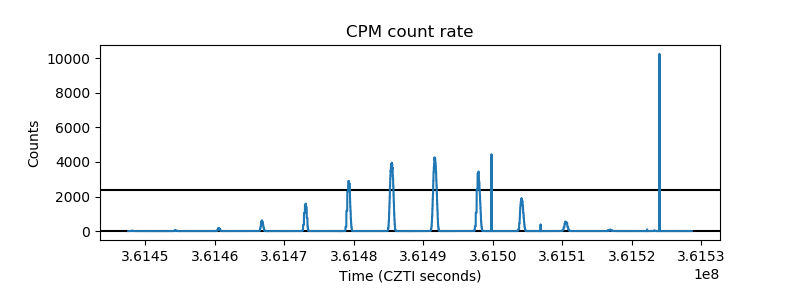 |
| CZT Counter |  |
| +2.5 Volts monitor |  |
| +5 Volts monitor | 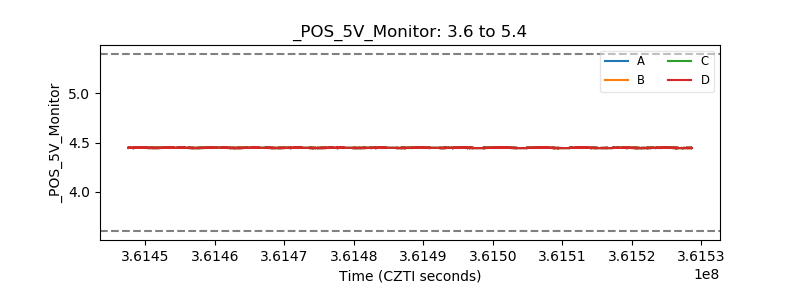 |
| _ROLL_ROT |  |
| _Roll_DEC |  |
| _Roll_RA |  |
| Veto Counter |  |