| Param | Original file | Final file |
|---|---|---|
| Filename | modeM0/AS1C06_004T01_9000004466_30895cztM0_level2.evt | modeM0/AS1C06_004T01_9000004466_30895cztM0_level2_quad_clean.evt |
| Size (bytes) | 169,557,120 | 35,349,120 |
| Size | 161.7 MB | 33.7 MB |
| Events in quadrant A | 965,553 | 237,243 |
| Events in quadrant B | 1,570,234 | 236,824 |
| Events in quadrant C | 986,722 | 229,097 |
| Events in quadrant D | 1,476,015 | 223,164 |
| Mode M0 | |||
|---|---|---|---|
| Quadrant | BADHDUFLAG | Total packets | Discarded packets |
| A | 0 | 4215 | 2 |
| B | 0 | 6089 | 3 |
| C | 0 | 4243 | 2 |
| D | 0 | 5729 | 2 |
| Mode M9 | |||
|---|---|---|---|
| Quadrant | BADHDUFLAG | Total packets | Discarded packets |
| A | 0 | 2 | 0 |
| B | 0 | 2 | 0 |
| C | 0 | 2 | 0 |
| D | 0 | 2 | 0 |
| Mode SS | |||
|---|---|---|---|
| Quadrant | BADHDUFLAG | Total packets | Discarded packets |
| A | 0 | 42 | 0 |
| B | 0 | 42 | 0 |
| C | 0 | 42 | 0 |
| D | 0 | 42 | 0 |
| Quadrant | Total seconds | Saturated seconds | Saturation percentage |
|---|---|---|---|
| A | 1972 | 151 | 7.657201% |
| B | 1971 | 195 | 9.893455% |
| C | 1971 | 142 | 7.204465% |
| D | 1971 | 165 | 8.371385% |
Noise dominated data is calculated using 1-second bins in cleaned event files. If a bin has >2000 counts, and if more than 50% of those come from <1% of pixels, then it is considered to be noise-dominated and hence unusable.
| Quadrant | # 1 sec bins | Bins with >0 counts | Bins with >2000 counts | High rate bins dominated by noise | Noise dominated (total time) | Noise dominated (detector-on time) | Marked lightcurve |
|---|---|---|---|---|---|---|---|
| A | 2172 | 1972 | 0 | 0 | 0.00% | 0.00% | 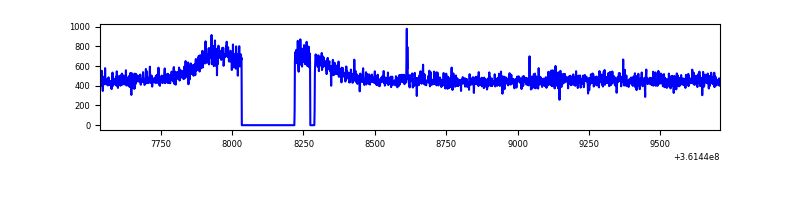 |
| B | 2171 | 1972 | 1 | 1 | 0.05% | 0.05% | 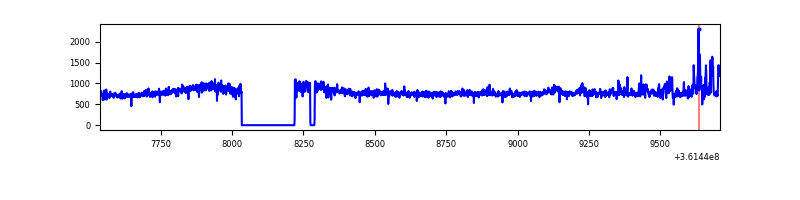 |
| C | 2171 | 1972 | 1 | 1 | 0.05% | 0.05% | 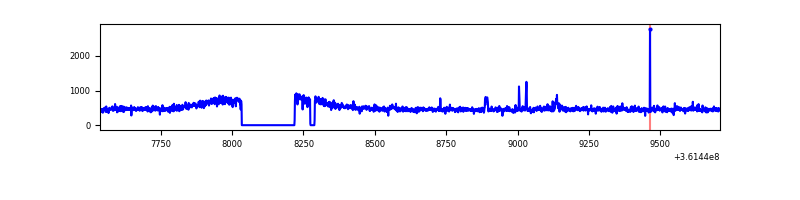 |
| D | 2171 | 1973 | 30 | 30 | 1.38% | 1.52% | 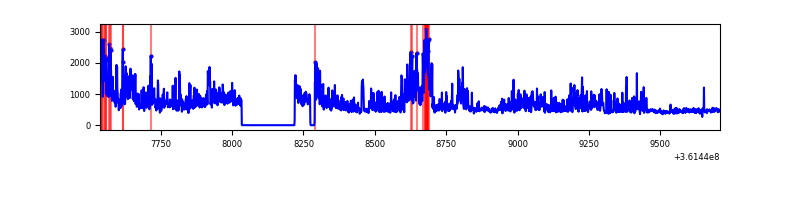 |
Top three noisy pixels from each quadrant. If the there are fewer than three noisy pixels in the level2.evt file, extra rows are filled as -1
| Pixel properties | Quadrant properties | ||||||
|---|---|---|---|---|---|---|---|
| Quadrant | DetID | PixID | Counts | Sigma | Mean | Median | Sigma |
| A | 0 | 13 | 6786 | 125.32 | 248 | 242 | 52.2 |
| A | 13 | 254 | 3910 | 70.25 | 248 | 242 | 52.2 |
| A | 3 | 137 | 2795 | 48.89 | 248 | 242 | 52.2 |
| B | 6 | 159 | 546825 | 11154.0 | 239 | 232 | 49.0 |
| B | 6 | 36 | 38887 | 788.81 | 239 | 232 | 49.0 |
| B | 0 | 190 | 29248 | 592.11 | 239 | 232 | 49.0 |
| C | 14 | 238 | 36260 | 649.33 | 230 | 229 | 55.5 |
| C | 3 | 233 | 26635 | 475.87 | 230 | 229 | 55.5 |
| C | 1 | 16 | 7424 | 129.66 | 230 | 229 | 55.5 |
| D | 1 | 52 | 242704 | 4229.92 | 232 | 225 | 57.3 |
| D | 12 | 233 | 233003 | 4060.69 | 232 | 225 | 57.3 |
| D | 8 | 195 | 116333 | 2025.44 | 232 | 225 | 57.3 |
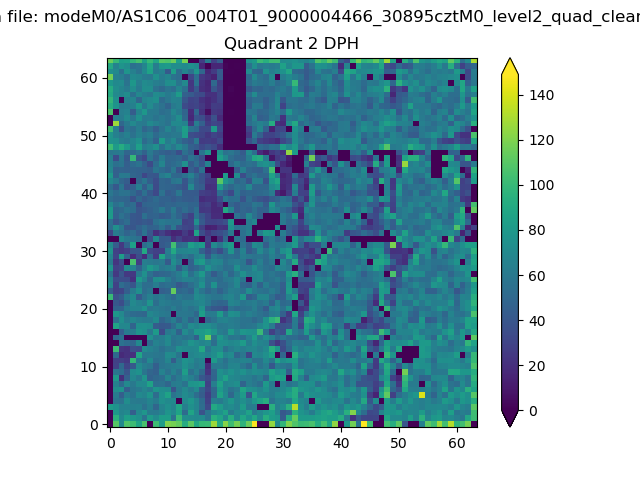
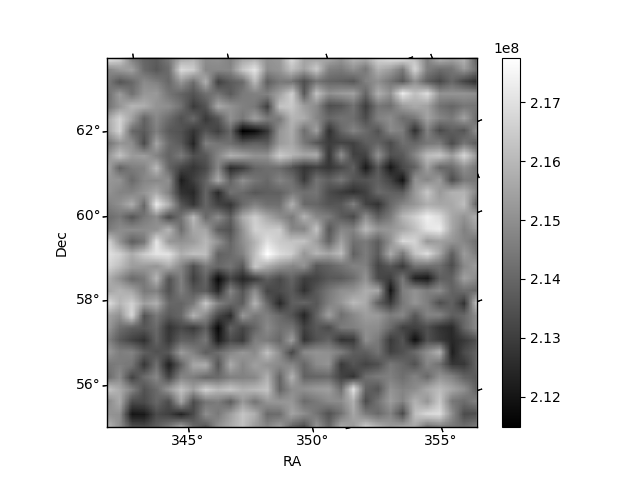
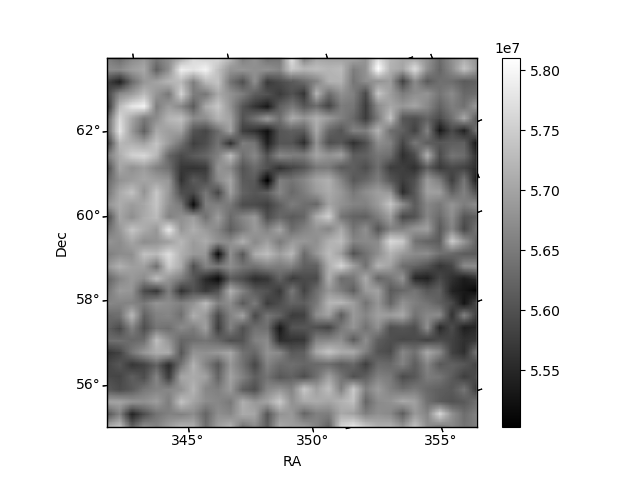
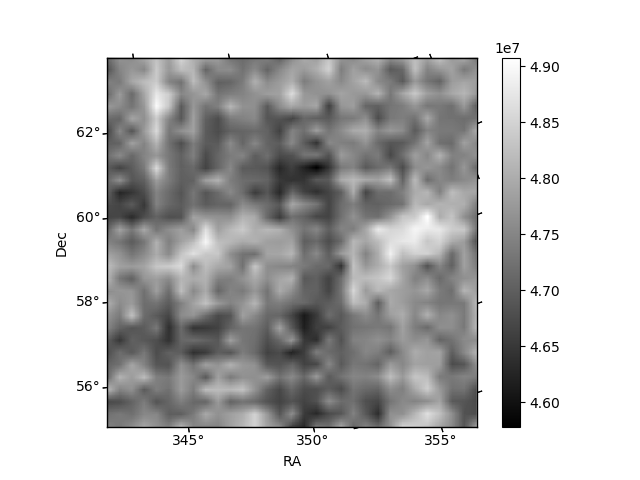
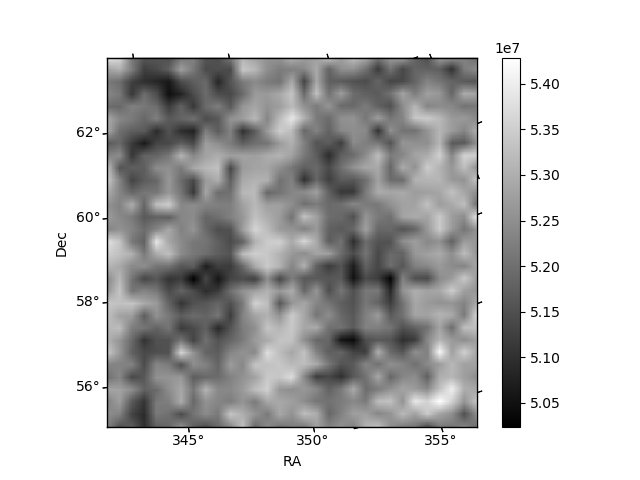
Histogram calculated using DETX and DETY for each event in the final _common_clean file
| Quadrant A | 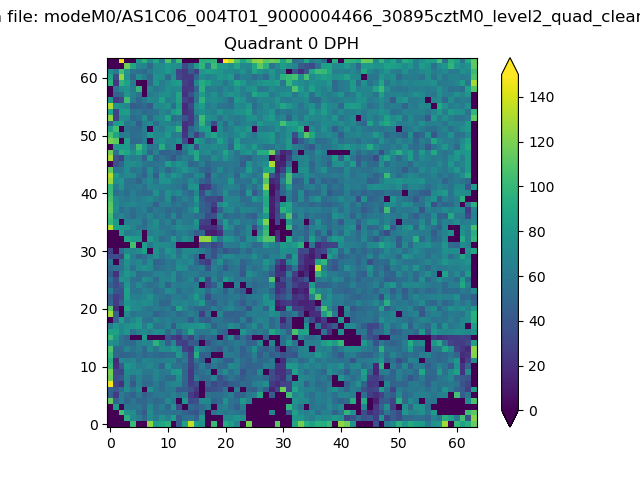 |
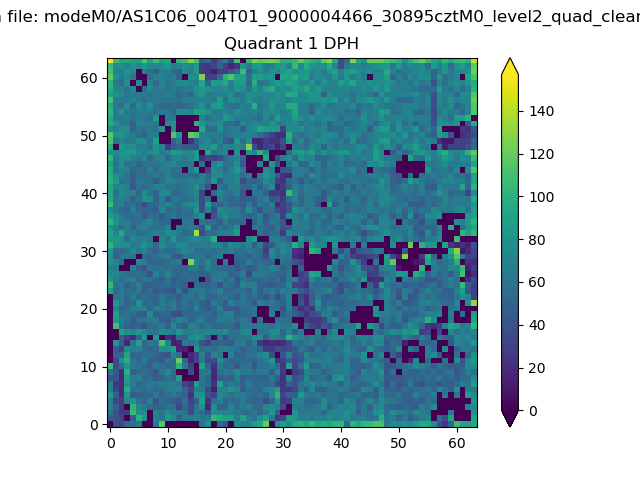 |
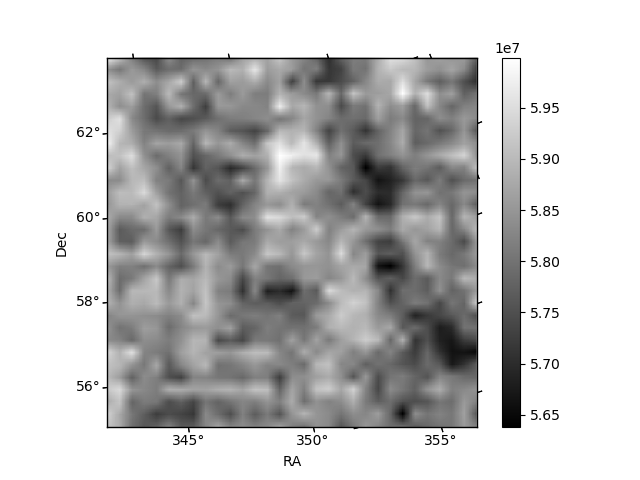
Quadrant B |
|---|---|---|---|
| Quadrant D | 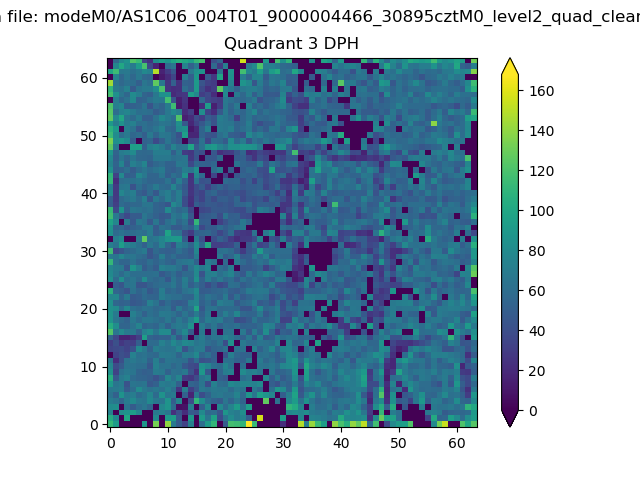 |
 |
Quadrant C |
| Plot type | Count rate plots | Images |
|---|---|---|
| Comparison with Poisson distribution Blue bars denote a histogram of data divided into 1 sec bins. Red curve is a Poisson curve with rate = median count rate of data. |
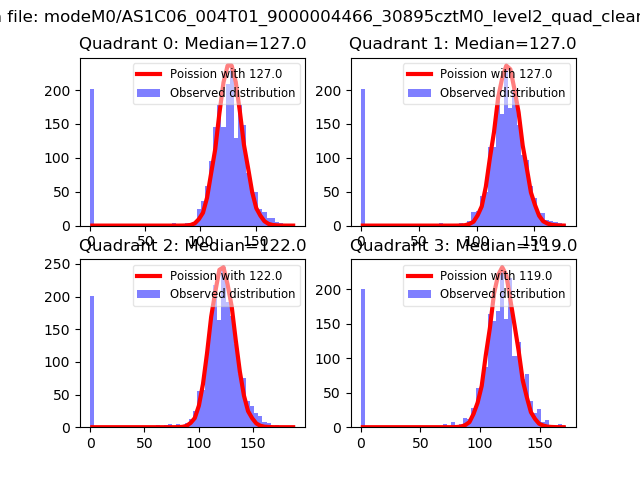 |
 |
| Quadrant-wise count rates Data is divided into 100 sec bins |
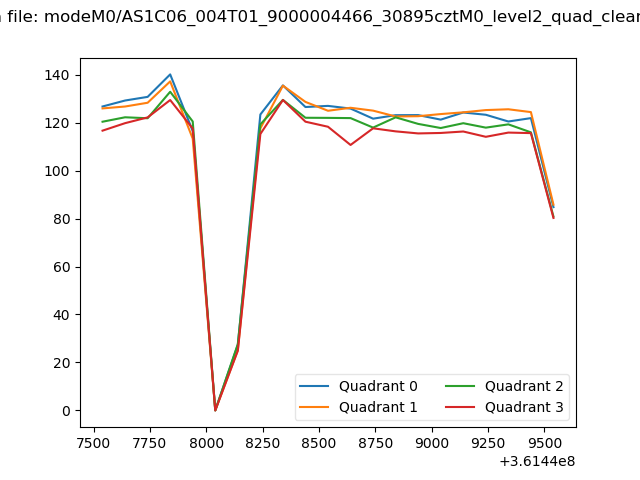 |
|
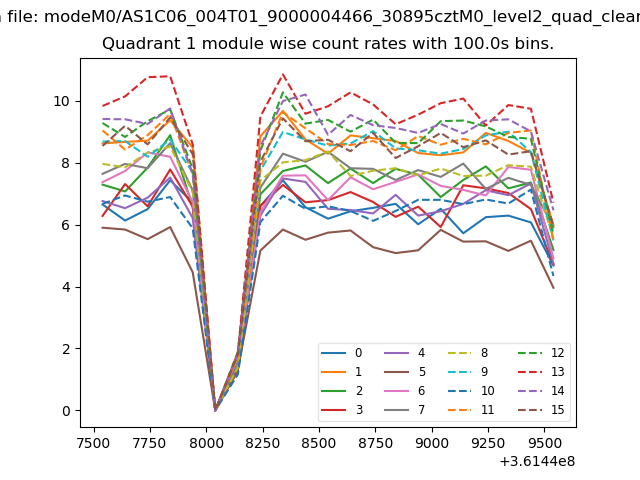
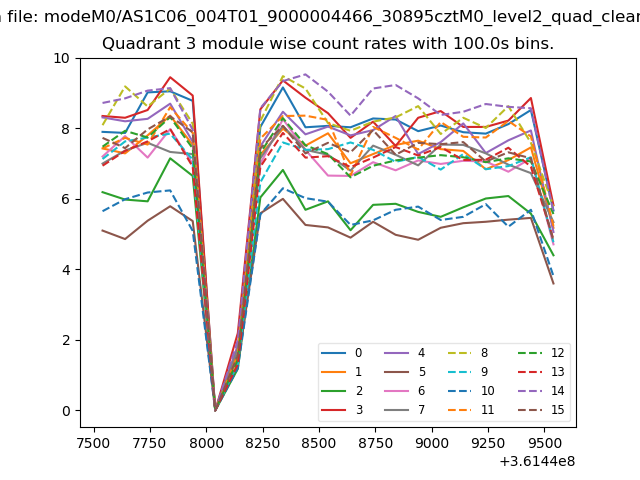
| Module-wise count rates for Quadrant A Data is divided into 100 sec bins |
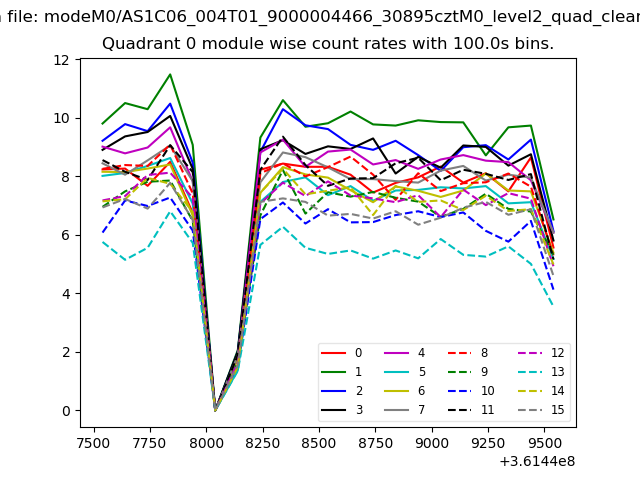 |
 |
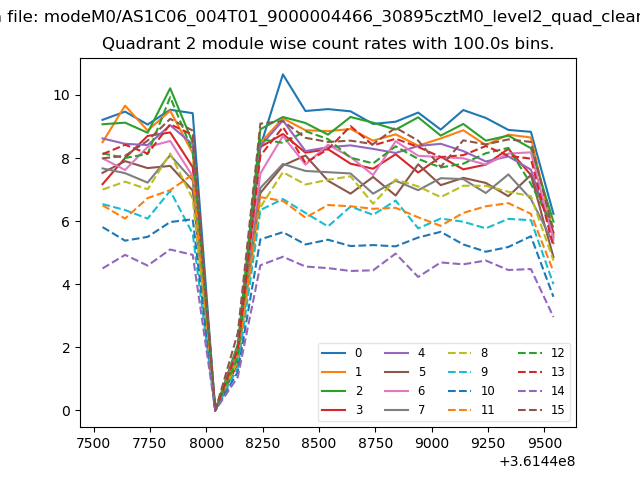
| Module-wise count rates for Quadrant B Data is divided into 100 sec bins |
 |
 |
| Module-wise count rates for Quadrant C Data is divided into 100 sec bins |
 |
 |
| Module-wise count rates for Quadrant D Data is divided into 100 sec bins |
 |
 |
| Parameter | Plot |
|---|---|
| CZT HV Monitor | 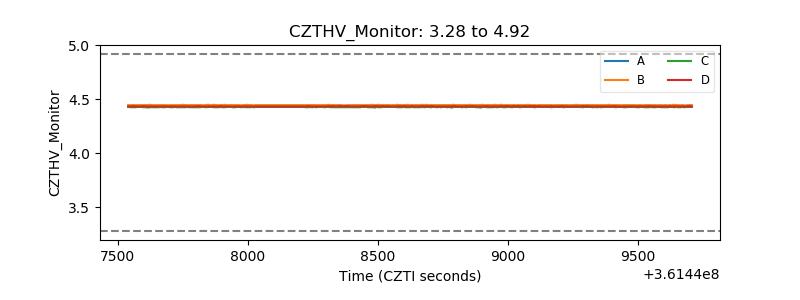 |
| D_VDD | 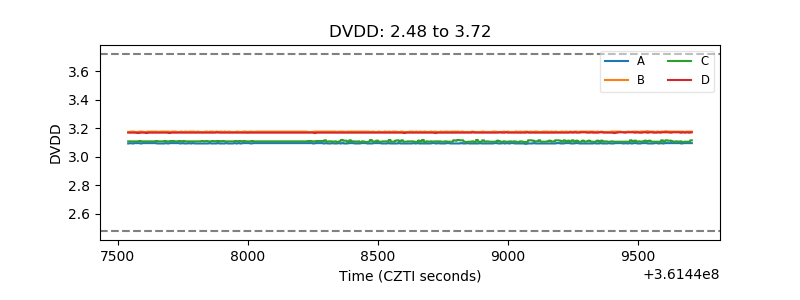 |
| Temperature 1 | 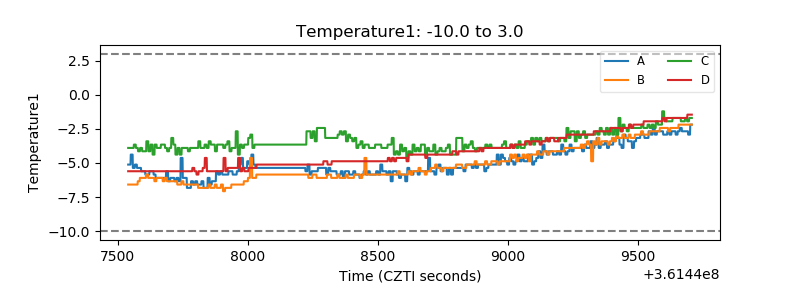 |
| Veto HV Monitor | 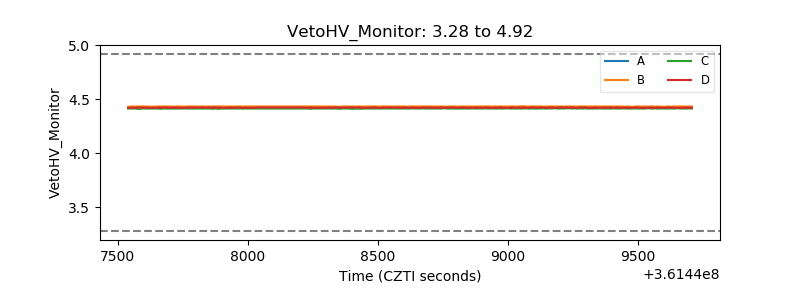 |
| Veto LLD | 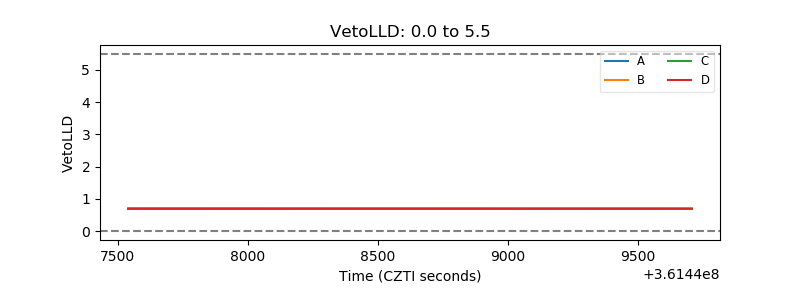 |
| Alpha Counter | 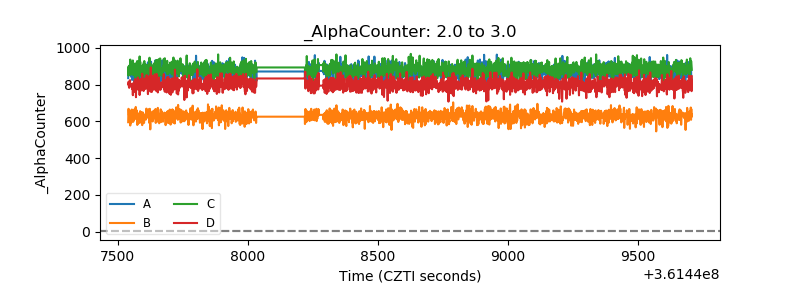 |
| _CPM_Rate | 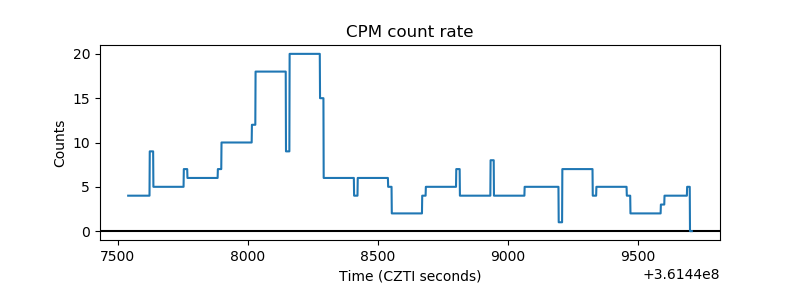 |
| CZT Counter | 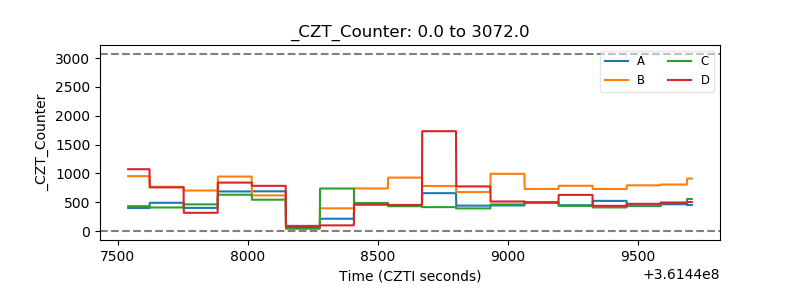 |
| +2.5 Volts monitor |  |
| +5 Volts monitor |  |
| _ROLL_ROT | 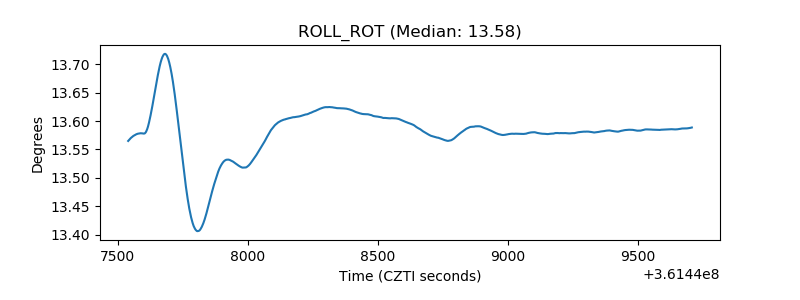 |
| _Roll_DEC | 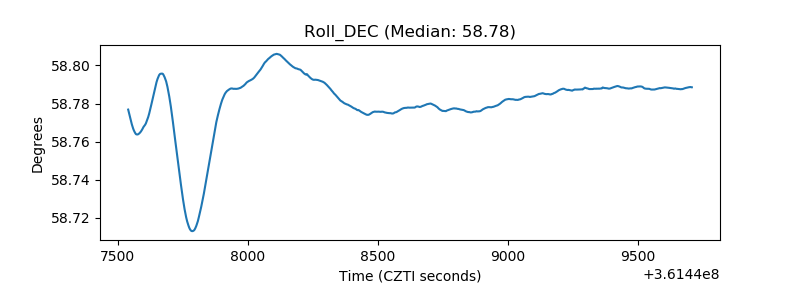 |
| _Roll_RA | 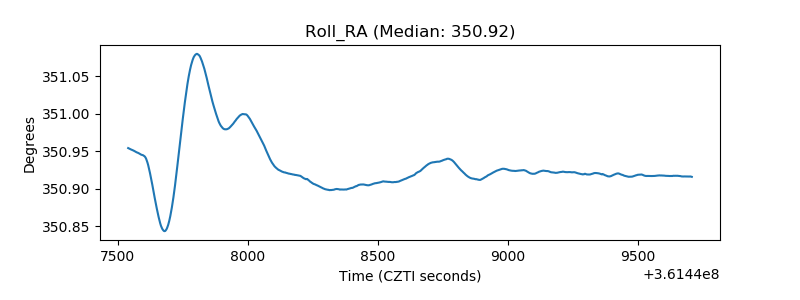 |
| Veto Counter | 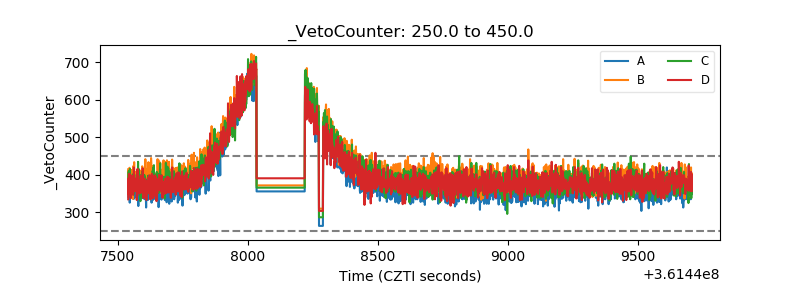 |