| Param | Original file | Final file |
|---|---|---|
| Filename | modeM0/AS1C06_004T01_9000004466_30898cztM0_level2.evt | modeM0/AS1C06_004T01_9000004466_30898cztM0_level2_quad_clean.evt |
| Size (bytes) | 1,572,154,560 | 227,911,680 |
| Size | 1.5 GB | 217.4 MB |
| Events in quadrant A | 8,686,813 | 1,464,752 |
| Events in quadrant B | 15,554,320 | 1,431,960 |
| Events in quadrant C | 9,217,629 | 1,363,065 |
| Events in quadrant D | 12,915,933 | 1,376,100 |
| Mode M0 | |||
|---|---|---|---|
| Quadrant | BADHDUFLAG | Total packets | Discarded packets |
| A | 0 | 37507 | 3 |
| B | 0 | 58917 | 4 |
| C | 0 | 38925 | 3 |
| D | 0 | 50509 | 3 |
| Mode M9 | |||
|---|---|---|---|
| Quadrant | BADHDUFLAG | Total packets | Discarded packets |
| A | 0 | 18 | 0 |
| B | 0 | 18 | 0 |
| C | 0 | 18 | 0 |
| D | 0 | 18 | 0 |
| Mode SS | |||
|---|---|---|---|
| Quadrant | BADHDUFLAG | Total packets | Discarded packets |
| A | 0 | 374 | 0 |
| B | 0 | 374 | 0 |
| C | 0 | 374 | 0 |
| D | 0 | 374 | 0 |
| Quadrant | Total seconds | Saturated seconds | Saturation percentage |
|---|---|---|---|
| A | 18379 | 200 | 1.088198% |
| B | 18379 | 429 | 2.334186% |
| C | 18379 | 824 | 4.483378% |
| D | 18379 | 465 | 2.530061% |
Noise dominated data is calculated using 1-second bins in cleaned event files. If a bin has >2000 counts, and if more than 50% of those come from <1% of pixels, then it is considered to be noise-dominated and hence unusable.
| Quadrant | # 1 sec bins | Bins with >0 counts | Bins with >2000 counts | High rate bins dominated by noise | Noise dominated (total time) | Noise dominated (detector-on time) | Marked lightcurve |
|---|---|---|---|---|---|---|---|
| A | 20259 | 18379 | 3 | 3 | 0.01% | 0.02% | 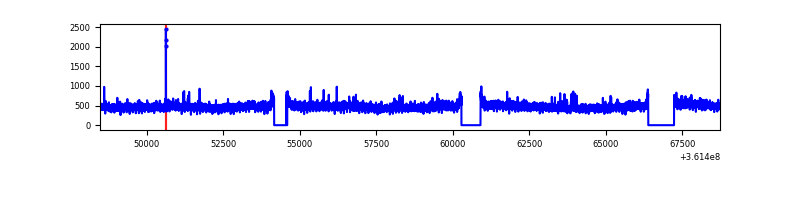 |
| B | 20259 | 18379 | 50 | 50 | 0.25% | 0.27% | 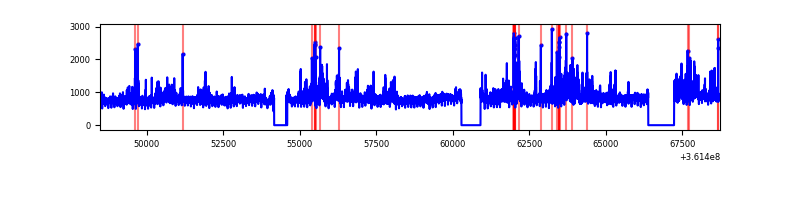 |
| C | 20259 | 18379 | 31 | 31 | 0.15% | 0.17% | 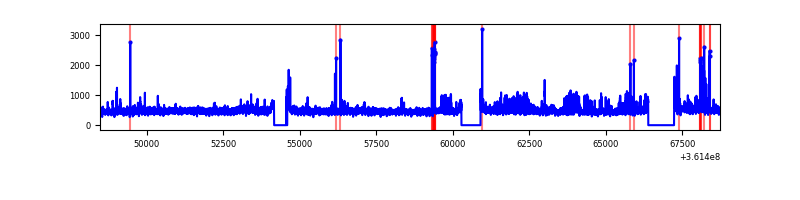 |
| D | 20259 | 18380 | 312 | 312 | 1.54% | 1.70% | 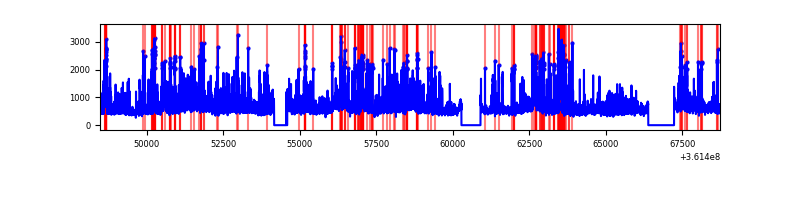 |
Top three noisy pixels from each quadrant. If the there are fewer than three noisy pixels in the level2.evt file, extra rows are filled as -1
| Pixel properties | Quadrant properties | ||||||
|---|---|---|---|---|---|---|---|
| Quadrant | DetID | PixID | Counts | Sigma | Mean | Median | Sigma |
| A | 11 | 47 | 95539 | 211.85 | 2206 | 2159 | 440.8 |
| A | 0 | 13 | 78431 | 173.04 | 2206 | 2159 | 440.8 |
| A | 13 | 254 | 34776 | 74.0 | 2206 | 2159 | 440.8 |
| B | 6 | 159 | 5297284 | 12932.86 | 2161 | 2105 | 409.4 |
| B | 6 | 36 | 895293 | 2181.51 | 2161 | 2105 | 409.4 |
| B | 0 | 190 | 272884 | 661.35 | 2161 | 2105 | 409.4 |
| C | 14 | 238 | 487709 | 1007.86 | 2058 | 2063 | 481.9 |
| C | 14 | 254 | 225011 | 462.68 | 2058 | 2063 | 481.9 |
| C | 0 | 10 | 194857 | 400.1 | 2058 | 2063 | 481.9 |
| D | 8 | 195 | 2160904 | 4388.71 | 2099 | 2049 | 491.9 |
| D | 1 | 52 | 1275024 | 2587.81 | 2099 | 2049 | 491.9 |
| D | 12 | 233 | 456028 | 922.89 | 2099 | 2049 | 491.9 |
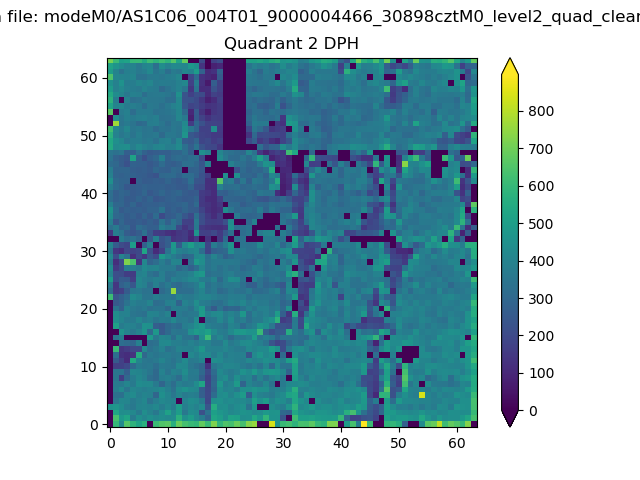
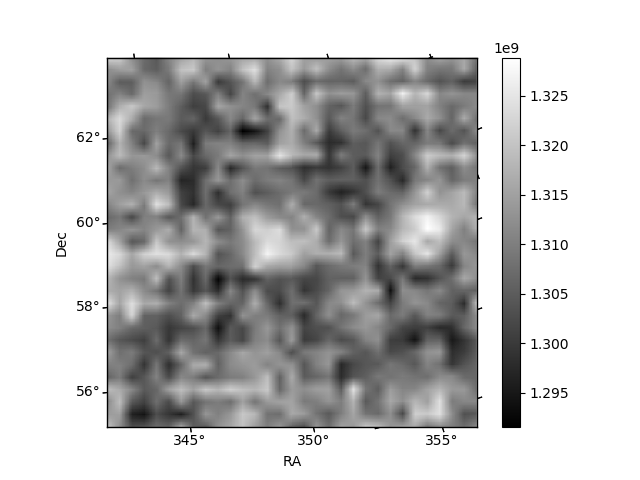
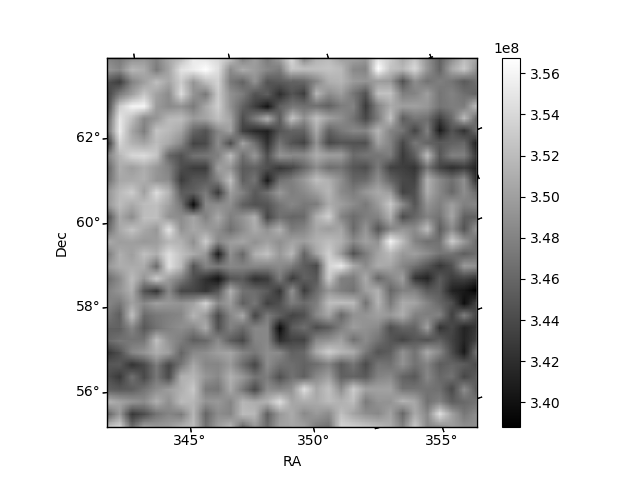
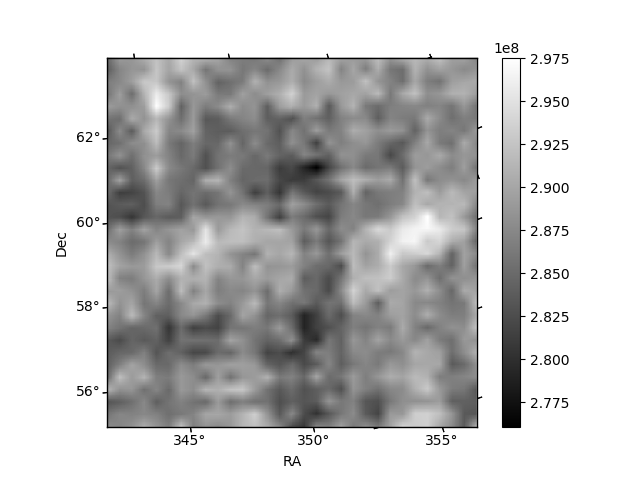
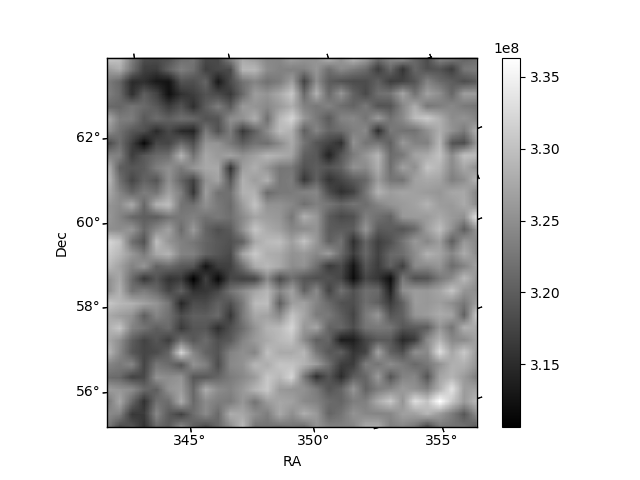
Histogram calculated using DETX and DETY for each event in the final _common_clean file
| Quadrant A | 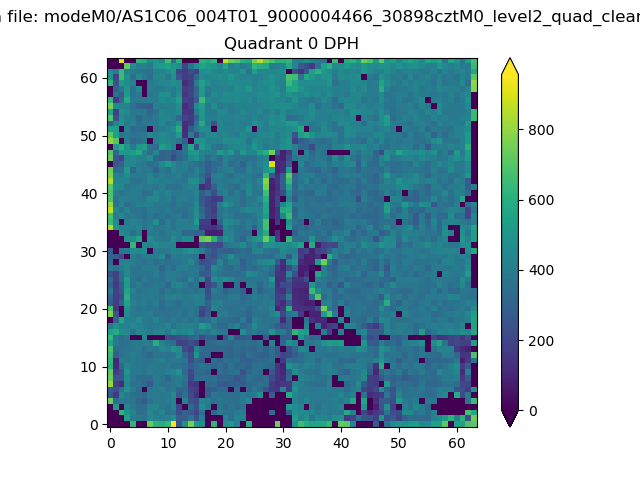 |
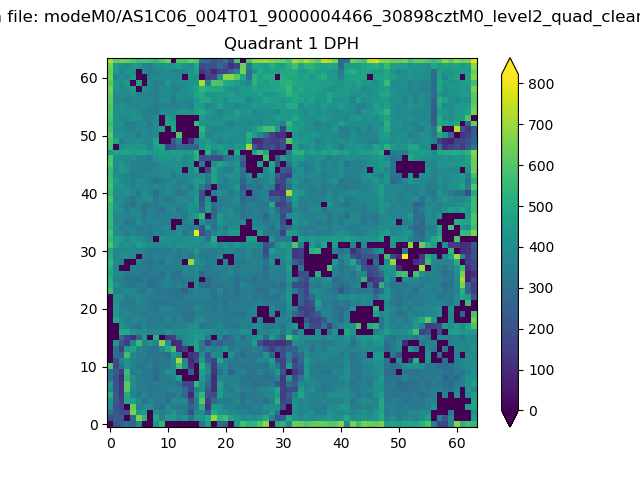 |
Quadrant B |
|---|---|---|---|
| Quadrant D | 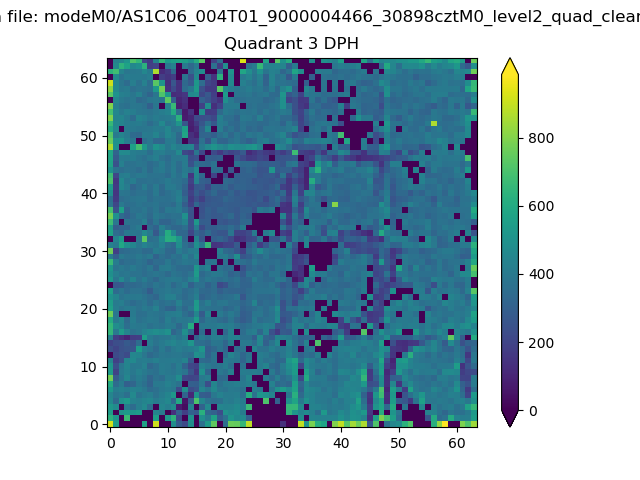 |
 |
Quadrant C |
| Plot type | Count rate plots | Images |
|---|---|---|
| Comparison with Poisson distribution Blue bars denote a histogram of data divided into 1 sec bins. Red curve is a Poisson curve with rate = median count rate of data. |
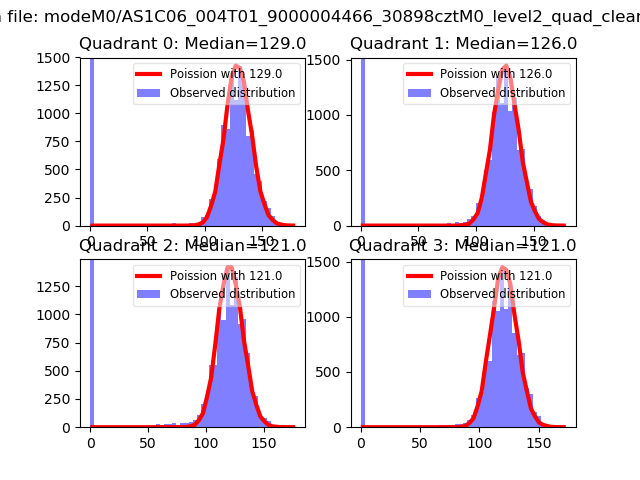 |
 |
| Quadrant-wise count rates Data is divided into 100 sec bins |
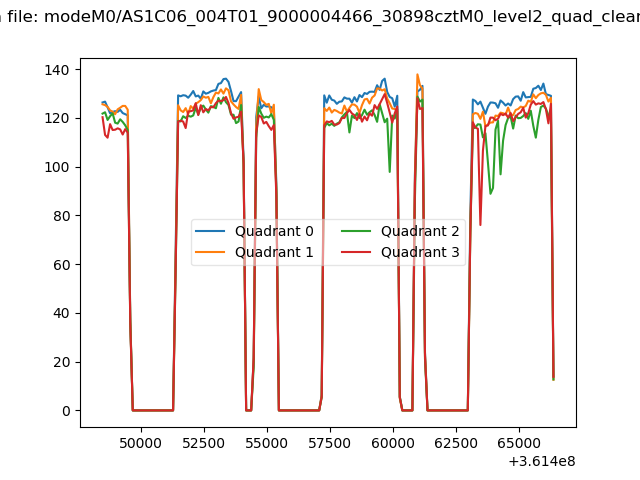 |
|
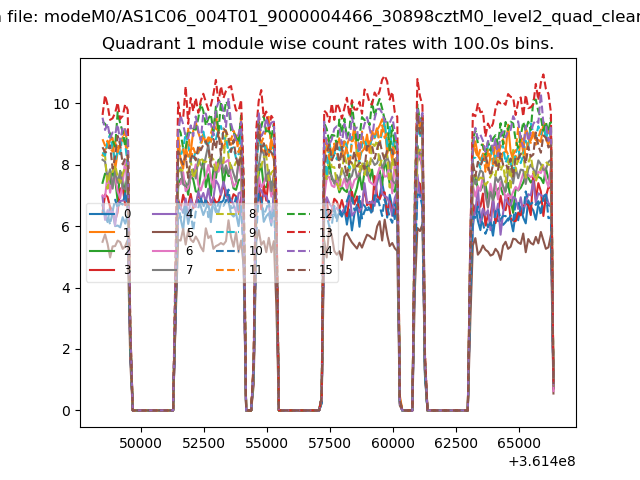
| Module-wise count rates for Quadrant A Data is divided into 100 sec bins |
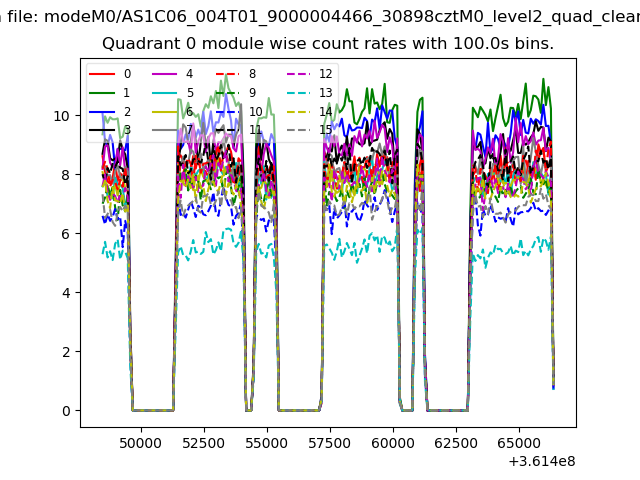 |
 |
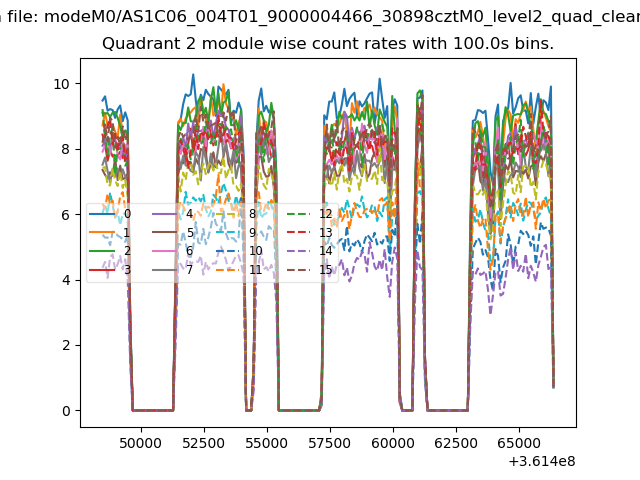
| Module-wise count rates for Quadrant B Data is divided into 100 sec bins |
 |
 |
| Module-wise count rates for Quadrant C Data is divided into 100 sec bins |
 |
 |
| Module-wise count rates for Quadrant D Data is divided into 100 sec bins |
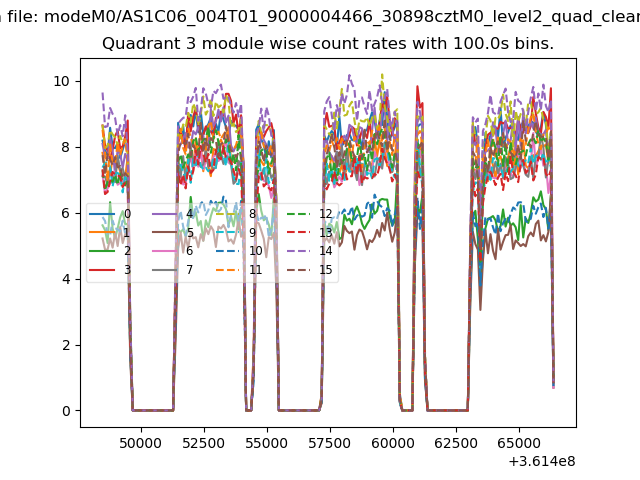 |
 |
| Parameter | Plot |
|---|---|
| CZT HV Monitor | 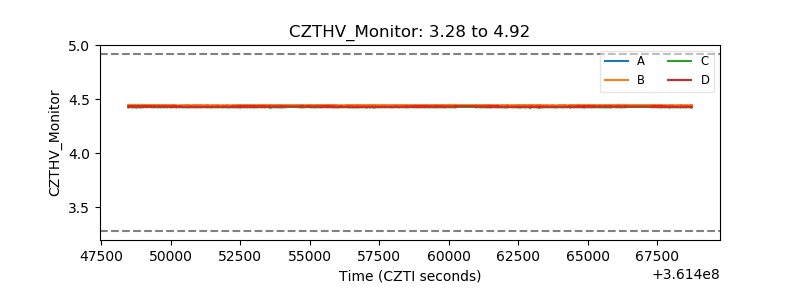 |
| D_VDD | 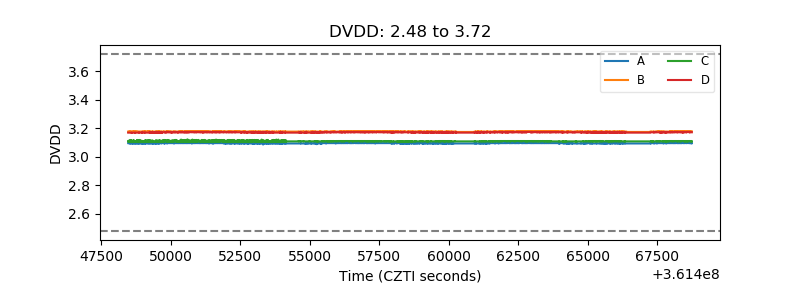 |
| Temperature 1 |  |
| Veto HV Monitor | 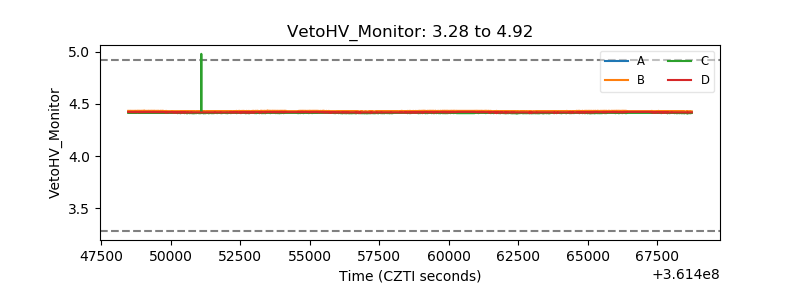 |
| Veto LLD |  |
| Alpha Counter | 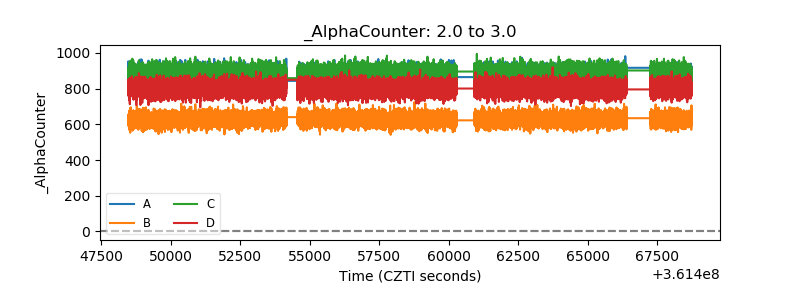 |
| _CPM_Rate | 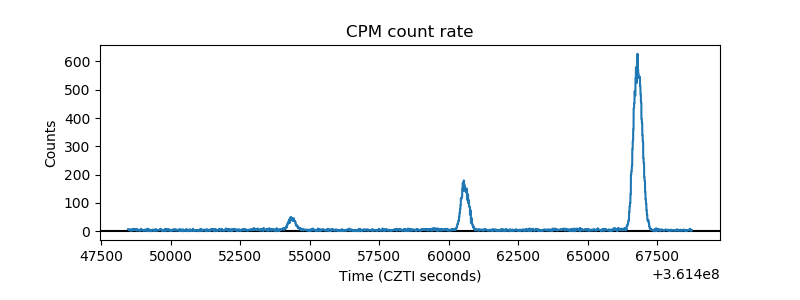 |
| CZT Counter | 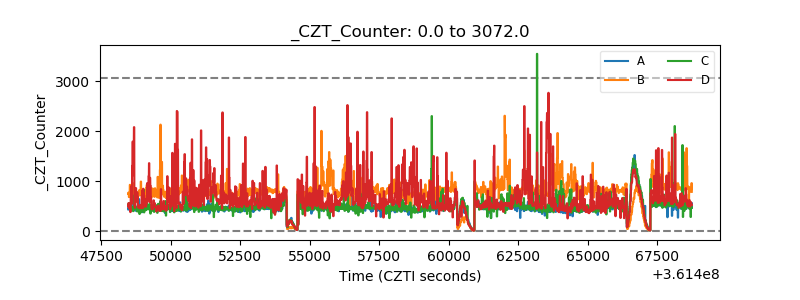 |
| +2.5 Volts monitor |  |
| +5 Volts monitor | 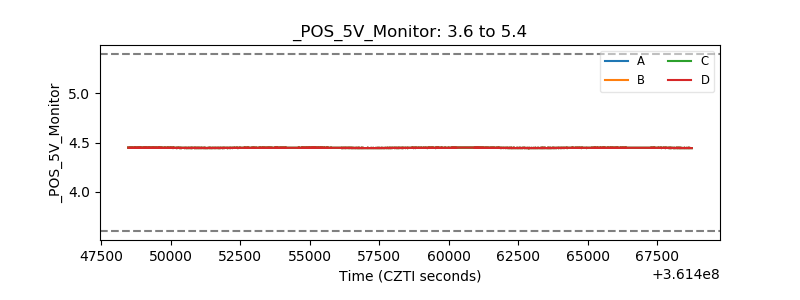 |
| _ROLL_ROT | 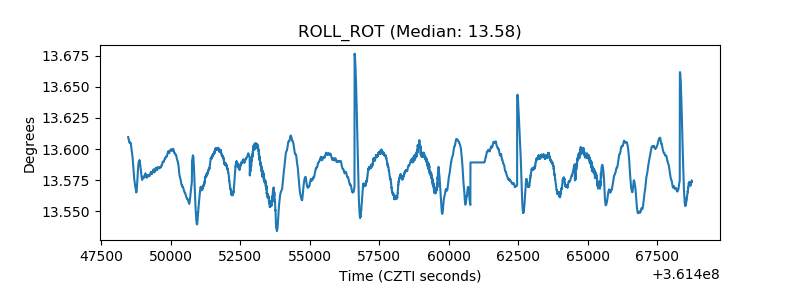 |
| _Roll_DEC |  |
| _Roll_RA | 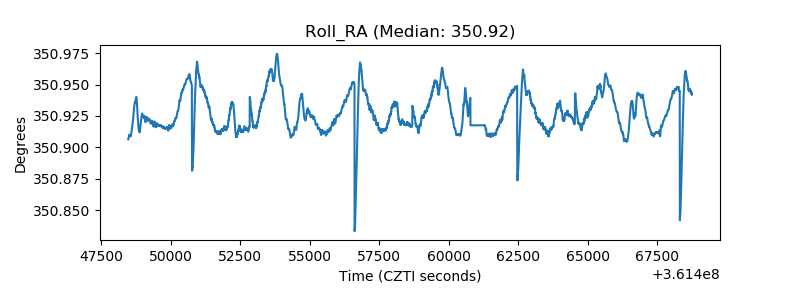 |
| Veto Counter |  |