| Param | Original file | Final file |
|---|---|---|
| Filename | modeM0/AS1C06_004T01_9000004466_30899cztM0_level2.evt | modeM0/AS1C06_004T01_9000004466_30899cztM0_level2_quad_clean.evt |
| Size (bytes) | 551,473,920 | 73,399,680 |
| Size | 525.9 MB | 70.0 MB |
| Events in quadrant A | 3,076,992 | 462,493 |
| Events in quadrant B | 5,460,797 | 449,360 |
| Events in quadrant C | 3,578,715 | 427,469 |
| Events in quadrant D | 4,153,797 | 439,053 |
| Mode M0 | |||
|---|---|---|---|
| Quadrant | BADHDUFLAG | Total packets | Discarded packets |
| A | 0 | 13289 | 1 |
| B | 0 | 20521 | 1 |
| C | 0 | 14745 | 1 |
| D | 0 | 16659 | 1 |
| Mode M9 | |||
|---|---|---|---|
| Quadrant | BADHDUFLAG | Total packets | Discarded packets |
| A | 0 | 9 | 0 |
| B | 0 | 9 | 0 |
| C | 0 | 9 | 0 |
| D | 0 | 9 | 0 |
| Mode SS | |||
|---|---|---|---|
| Quadrant | BADHDUFLAG | Total packets | Discarded packets |
| A | 0 | 130 | 0 |
| B | 0 | 130 | 0 |
| C | 0 | 130 | 0 |
| D | 0 | 130 | 0 |
| Quadrant | Total seconds | Saturated seconds | Saturation percentage |
|---|---|---|---|
| A | 6361 | 56 | 0.880365% |
| B | 6361 | 174 | 2.735419% |
| C | 6361 | 364 | 5.722371% |
| D | 6362 | 132 | 2.074819% |
Noise dominated data is calculated using 1-second bins in cleaned event files. If a bin has >2000 counts, and if more than 50% of those come from <1% of pixels, then it is considered to be noise-dominated and hence unusable.
| Quadrant | # 1 sec bins | Bins with >0 counts | Bins with >2000 counts | High rate bins dominated by noise | Noise dominated (total time) | Noise dominated (detector-on time) | Marked lightcurve |
|---|---|---|---|---|---|---|---|
| A | 7316 | 6361 | 0 | 0 | 0.00% | 0.00% | 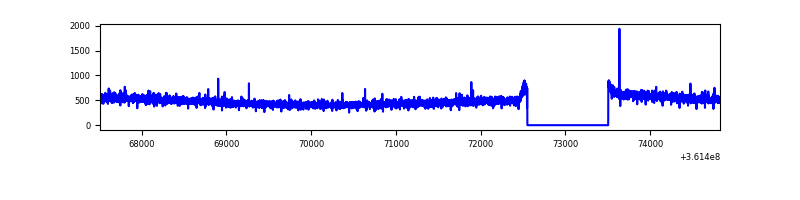 |
| B | 7316 | 6361 | 12 | 12 | 0.16% | 0.19% | 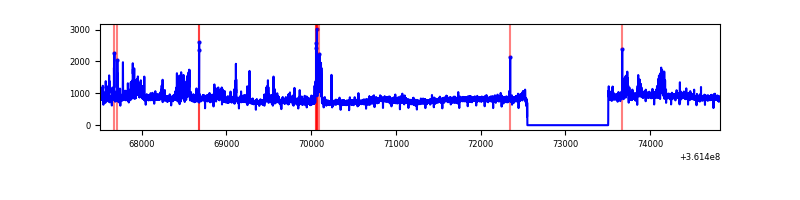 |
| C | 7316 | 6361 | 27 | 27 | 0.37% | 0.42% | 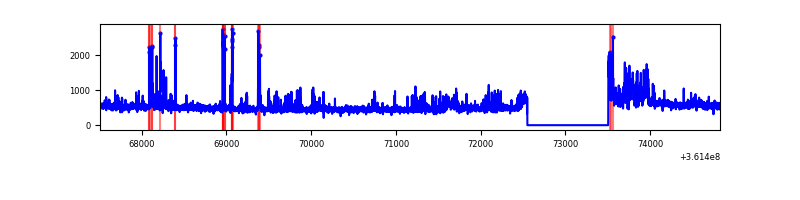 |
| D | 7317 | 6362 | 54 | 54 | 0.74% | 0.85% | 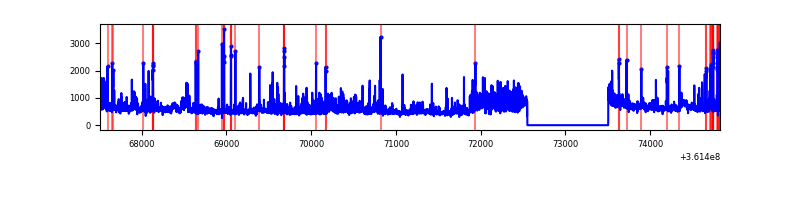 |
Top three noisy pixels from each quadrant. If the there are fewer than three noisy pixels in the level2.evt file, extra rows are filled as -1
| Pixel properties | Quadrant properties | ||||||
|---|---|---|---|---|---|---|---|
| Quadrant | DetID | PixID | Counts | Sigma | Mean | Median | Sigma |
| A | 13 | 254 | 12204 | 71.79 | 794 | 778 | 159.2 |
| A | 0 | 13 | 9752 | 56.38 | 794 | 778 | 159.2 |
| A | 3 | 137 | 7600 | 42.86 | 794 | 778 | 159.2 |
| B | 6 | 159 | 1941863 | 13034.43 | 780 | 761 | 148.9 |
| B | 6 | 36 | 155551 | 1039.41 | 780 | 761 | 148.9 |
| B | 0 | 190 | 143422 | 957.96 | 780 | 761 | 148.9 |
| C | 3 | 233 | 219793 | 1257.19 | 745 | 748 | 174.2 |
| C | 14 | 238 | 183581 | 1049.36 | 745 | 748 | 174.2 |
| C | 0 | 10 | 133756 | 763.39 | 745 | 748 | 174.2 |
| D | 8 | 195 | 555351 | 3054.38 | 764 | 745 | 181.6 |
| D | 1 | 52 | 359855 | 1977.73 | 764 | 745 | 181.6 |
| D | 2 | 250 | 81928 | 447.1 | 764 | 745 | 181.6 |
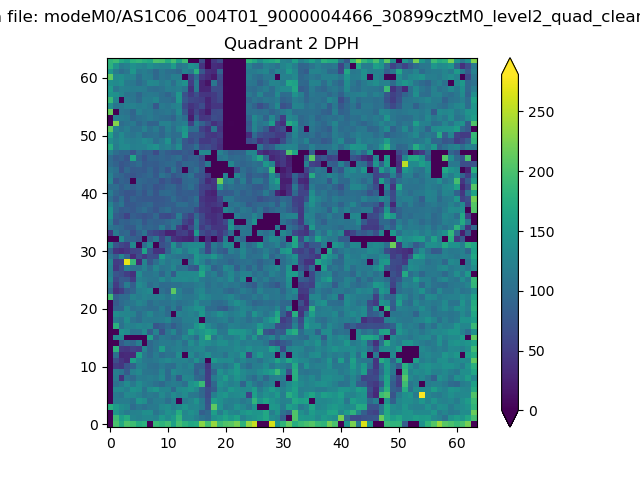
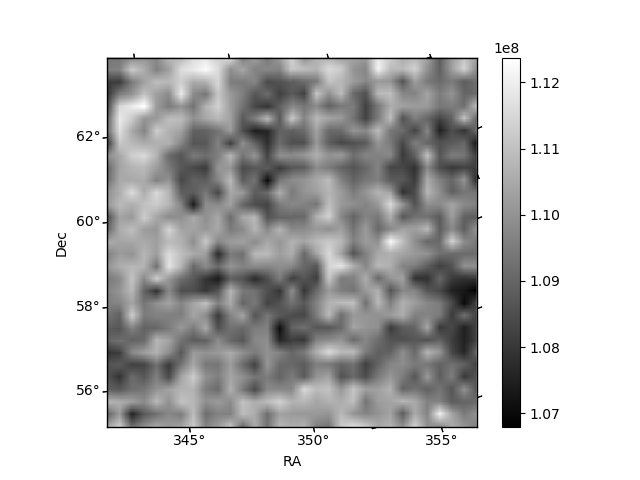
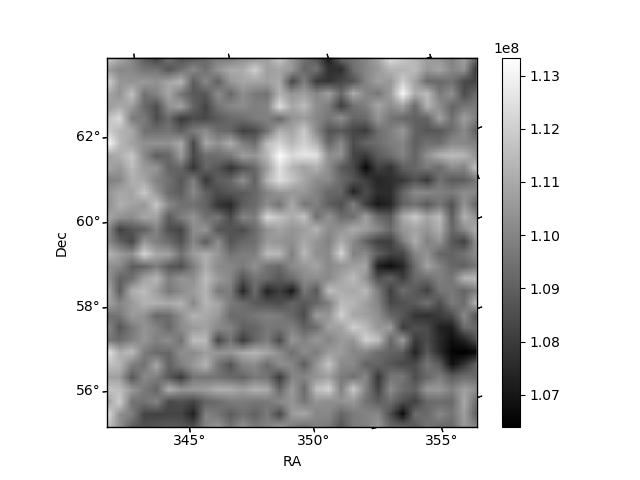
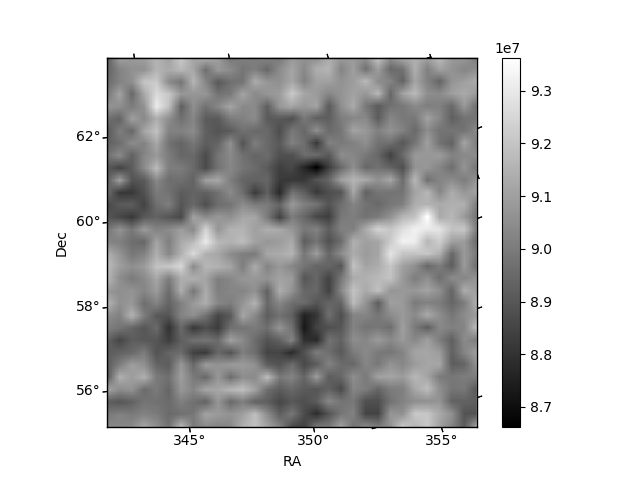
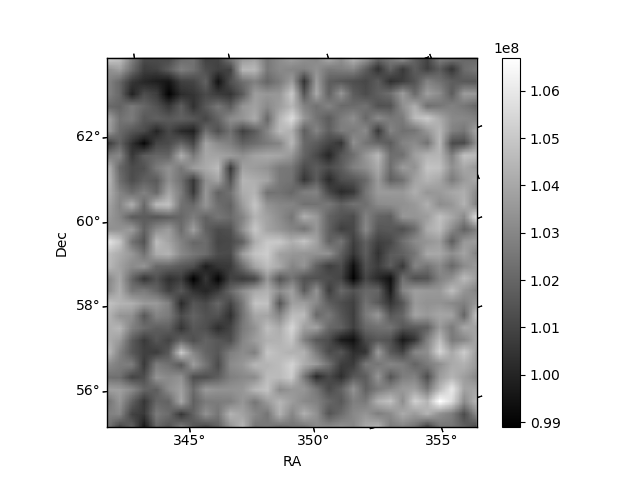
Histogram calculated using DETX and DETY for each event in the final _common_clean file
| Quadrant A |  |
 |
Quadrant B |
|---|---|---|---|
| Quadrant D | 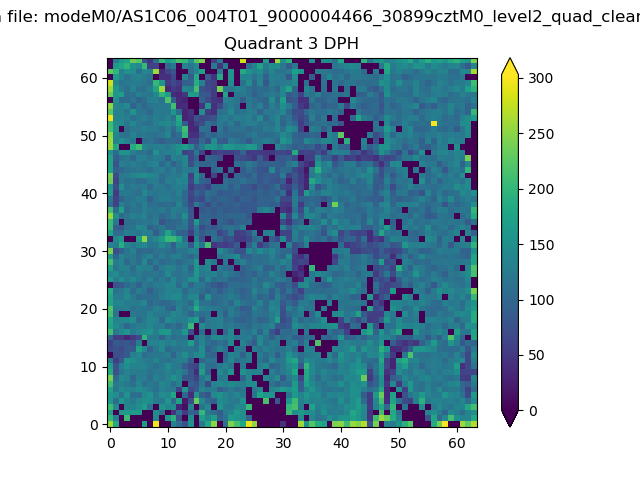 |
 |
Quadrant C |
| Plot type | Count rate plots | Images |
|---|---|---|
| Comparison with Poisson distribution Blue bars denote a histogram of data divided into 1 sec bins. Red curve is a Poisson curve with rate = median count rate of data. |
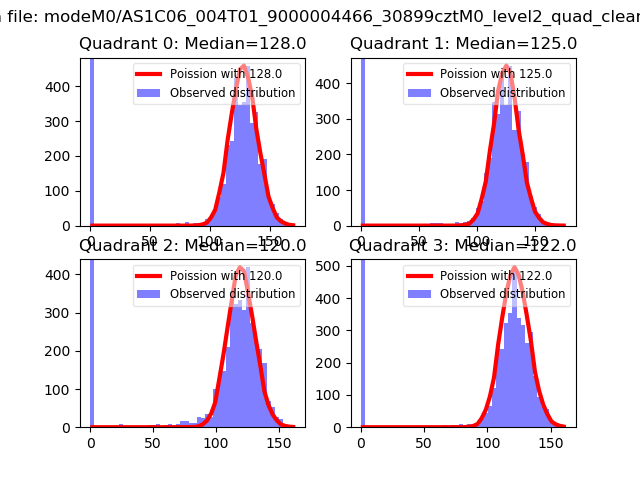 |
 |
| Quadrant-wise count rates Data is divided into 100 sec bins |
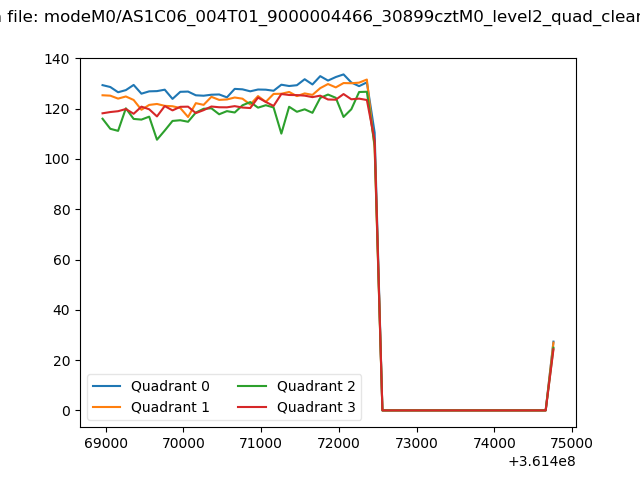 |
|
| Module-wise count rates for Quadrant A Data is divided into 100 sec bins |
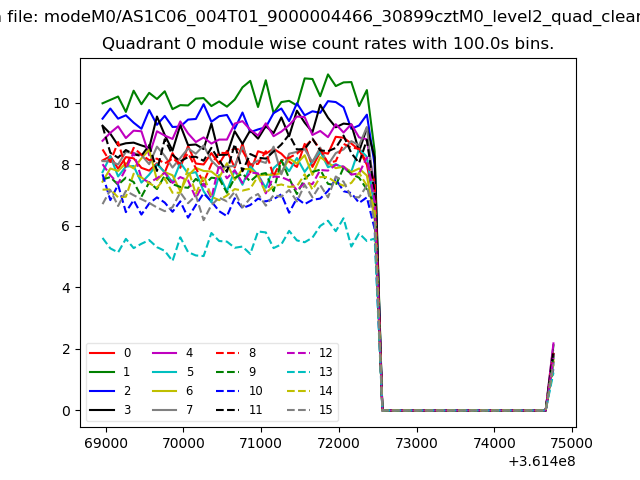 |
 |
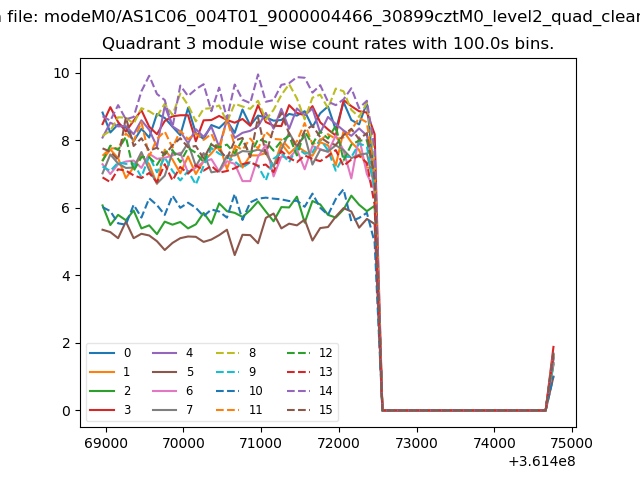
| Module-wise count rates for Quadrant B Data is divided into 100 sec bins |
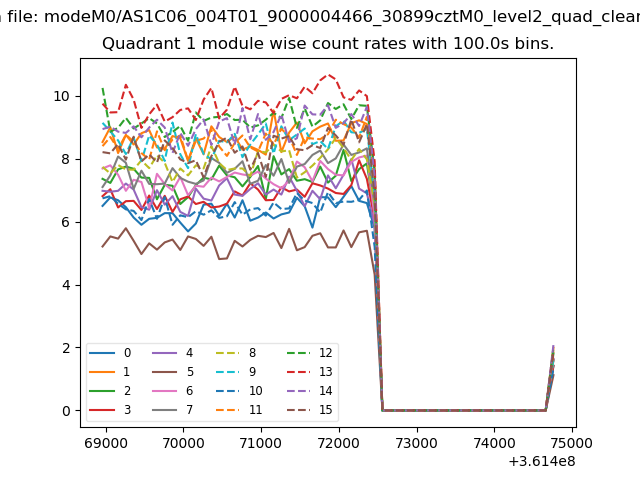 |
 |
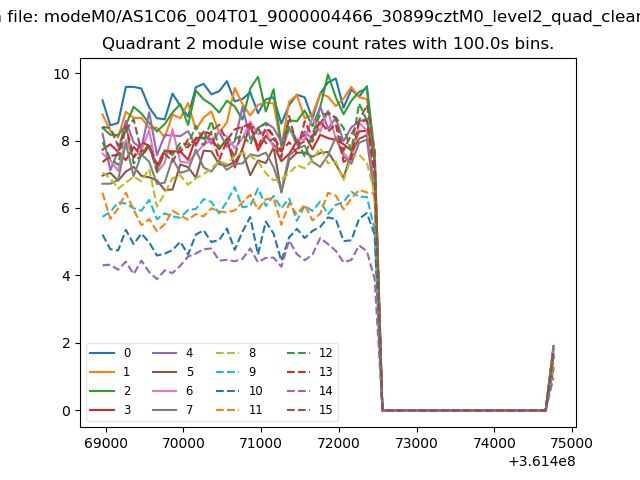
| Module-wise count rates for Quadrant C Data is divided into 100 sec bins |
 |
 |
| Module-wise count rates for Quadrant D Data is divided into 100 sec bins |
 |
 |
| Parameter | Plot |
|---|---|
| CZT HV Monitor | 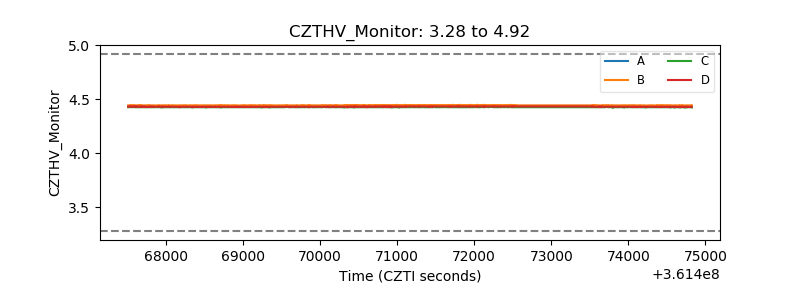 |
| D_VDD | 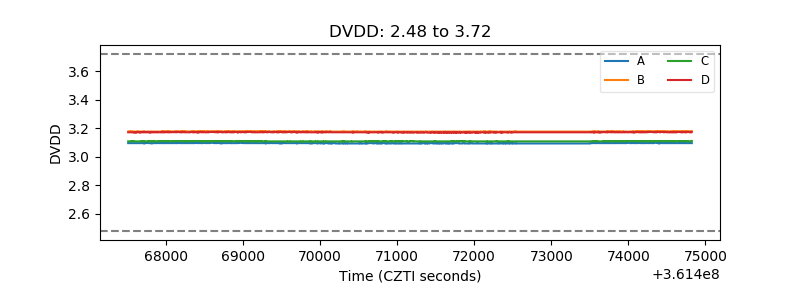 |
| Temperature 1 |  |
| Veto HV Monitor | 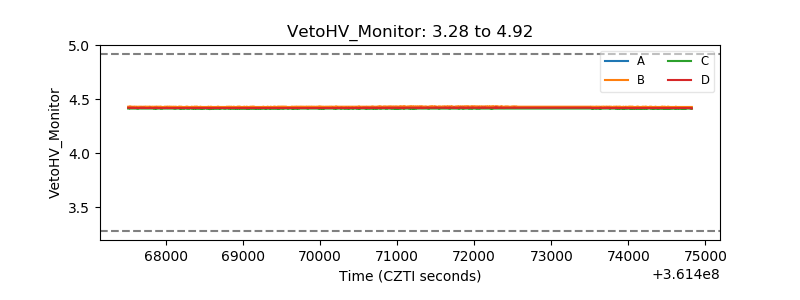 |
| Veto LLD |  |
| Alpha Counter | 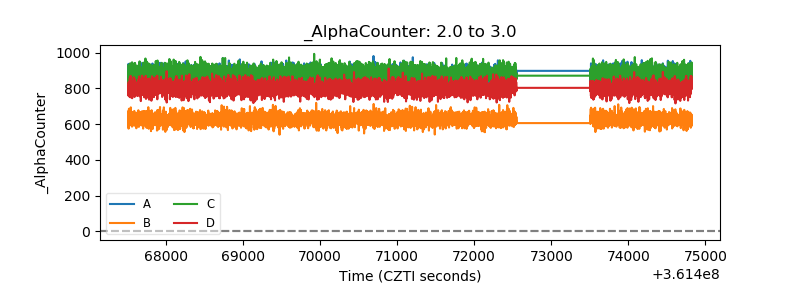 |
| _CPM_Rate |  |
| CZT Counter | 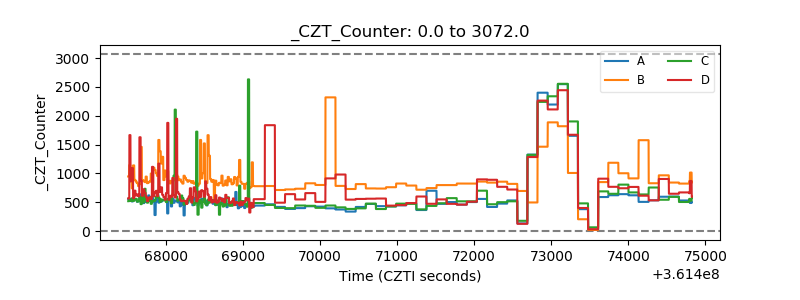 |
| +2.5 Volts monitor |  |
| +5 Volts monitor | 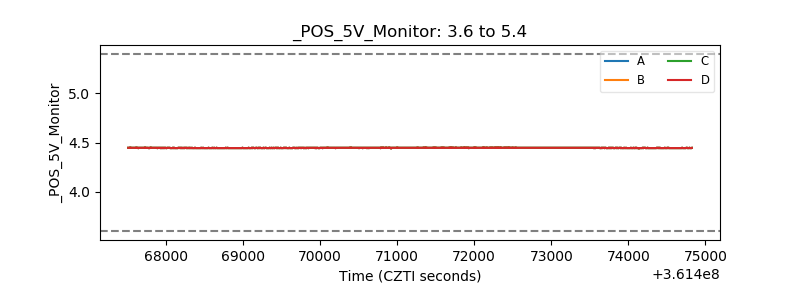 |
| _ROLL_ROT |  |
| _Roll_DEC | 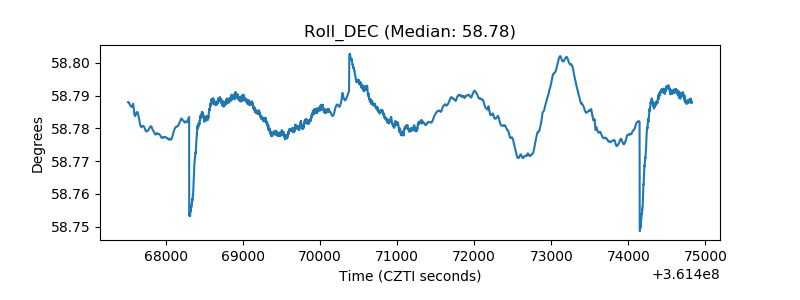 |
| _Roll_RA | 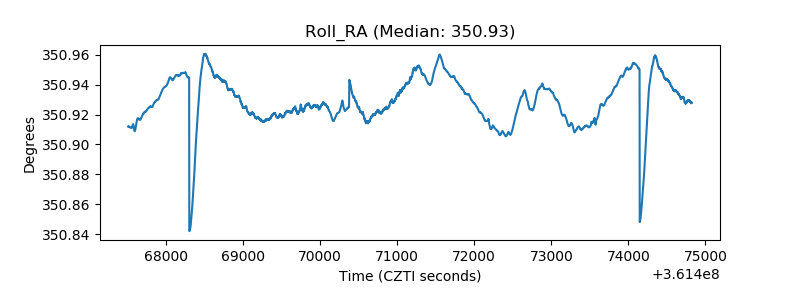 |
| Veto Counter | 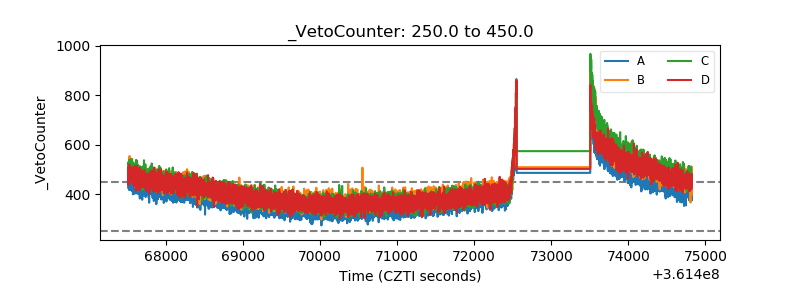 |