| Param | Original file | Final file |
|---|---|---|
| Filename | modeM0/AS1C06_004T01_9000004466_30901cztM0_level2.evt | modeM0/AS1C06_004T01_9000004466_30901cztM0_level2_quad_clean.evt |
| Size (bytes) | 563,143,680 | 87,612,480 |
| Size | 537.1 MB | 83.6 MB |
| Events in quadrant A | 3,100,876 | 583,164 |
| Events in quadrant B | 5,279,072 | 569,488 |
| Events in quadrant C | 3,699,711 | 534,630 |
| Events in quadrant D | 4,561,936 | 539,561 |
| Mode M0 | |||
|---|---|---|---|
| Quadrant | BADHDUFLAG | Total packets | Discarded packets |
| A | 0 | 13300 | 1 |
| B | 0 | 20119 | 1 |
| C | 0 | 15066 | 1 |
| D | 0 | 17782 | 1 |
| Mode M9 | |||
|---|---|---|---|
| Quadrant | BADHDUFLAG | Total packets | Discarded packets |
| A | 0 | 11 | 0 |
| B | 0 | 11 | 0 |
| C | 0 | 11 | 0 |
| D | 0 | 11 | 0 |
| Mode SS | |||
|---|---|---|---|
| Quadrant | BADHDUFLAG | Total packets | Discarded packets |
| A | 0 | 124 | 0 |
| B | 0 | 124 | 0 |
| C | 0 | 124 | 0 |
| D | 0 | 124 | 0 |
| Quadrant | Total seconds | Saturated seconds | Saturation percentage |
|---|---|---|---|
| A | 6101 | 77 | 1.262088% |
| B | 6102 | 182 | 2.982629% |
| C | 6102 | 512 | 8.390692% |
| D | 6102 | 374 | 6.129138% |
Noise dominated data is calculated using 1-second bins in cleaned event files. If a bin has >2000 counts, and if more than 50% of those come from <1% of pixels, then it is considered to be noise-dominated and hence unusable.
| Quadrant | # 1 sec bins | Bins with >0 counts | Bins with >2000 counts | High rate bins dominated by noise | Noise dominated (total time) | Noise dominated (detector-on time) | Marked lightcurve |
|---|---|---|---|---|---|---|---|
| A | 7201 | 6101 | 11 | 11 | 0.15% | 0.18% | 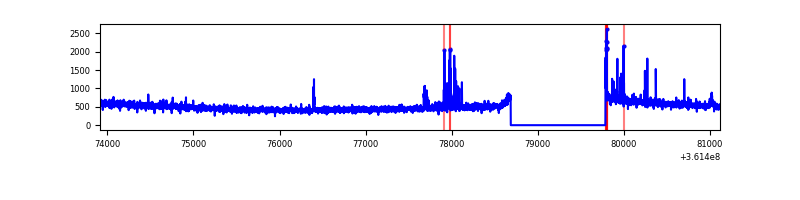 |
| B | 7202 | 6102 | 40 | 40 | 0.56% | 0.66% | 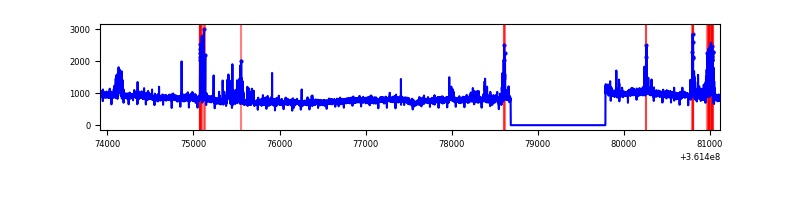 |
| C | 7202 | 6102 | 18 | 18 | 0.25% | 0.29% |  |
| D | 7202 | 6102 | 256 | 256 | 3.55% | 4.20% | 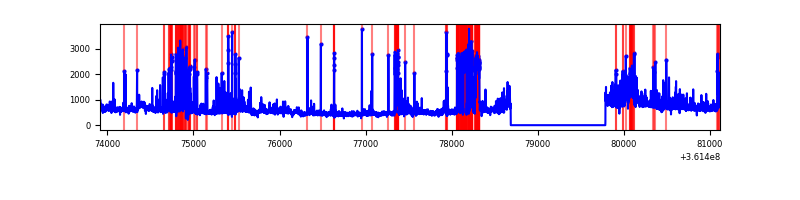 |
Top three noisy pixels from each quadrant. If the there are fewer than three noisy pixels in the level2.evt file, extra rows are filled as -1
| Pixel properties | Quadrant properties | ||||||
|---|---|---|---|---|---|---|---|
| Quadrant | DetID | PixID | Counts | Sigma | Mean | Median | Sigma |
| A | 0 | 13 | 94695 | 602.35 | 776 | 761 | 155.9 |
| A | 13 | 254 | 11853 | 71.13 | 776 | 761 | 155.9 |
| A | 0 | 191 | 7463 | 42.98 | 776 | 761 | 155.9 |
| B | 6 | 159 | 1907139 | 13111.37 | 768 | 751 | 145.4 |
| B | 0 | 190 | 228656 | 1567.44 | 768 | 751 | 145.4 |
| B | 4 | 171 | 46042 | 311.49 | 768 | 751 | 145.4 |
| C | 3 | 233 | 230035 | 1352.74 | 727 | 732 | 169.5 |
| C | 14 | 238 | 217255 | 1277.35 | 727 | 732 | 169.5 |
| C | 0 | 10 | 185595 | 1090.57 | 727 | 732 | 169.5 |
| D | 8 | 195 | 610154 | 3513.74 | 739 | 722 | 173.4 |
| D | 12 | 218 | 602187 | 3467.81 | 739 | 722 | 173.4 |
| D | 1 | 52 | 209372 | 1202.99 | 739 | 722 | 173.4 |
Histogram calculated using DETX and DETY for each event in the final _common_clean file
| Quadrant A |  |
 |
Quadrant B |
|---|---|---|---|
| Quadrant D |  |
 |
Quadrant C |
| Plot type | Count rate plots | Images |
|---|---|---|
| Comparison with Poisson distribution Blue bars denote a histogram of data divided into 1 sec bins. Red curve is a Poisson curve with rate = median count rate of data. |
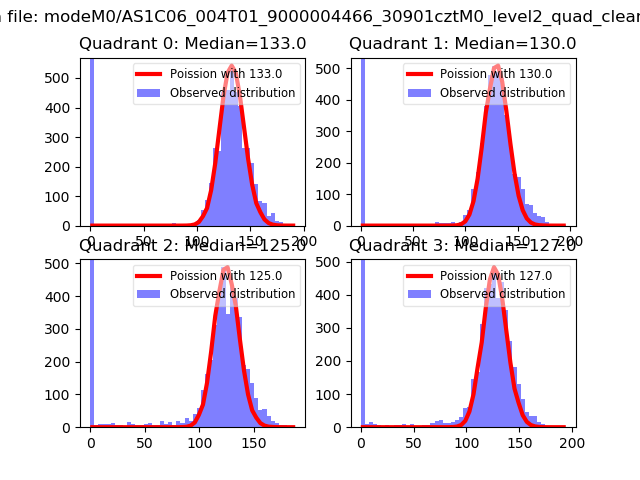 |
 |
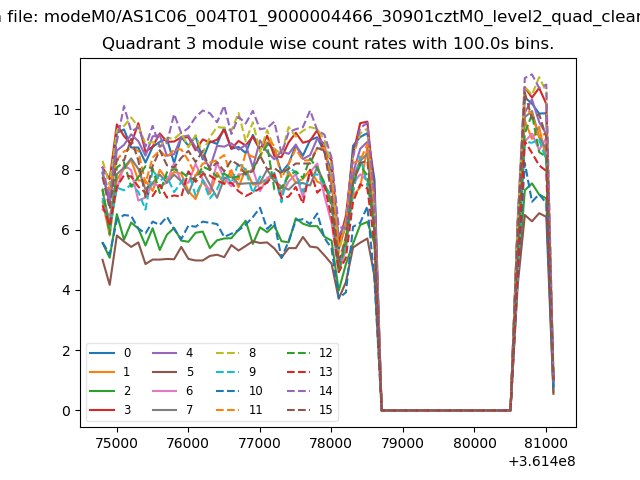
| Quadrant-wise count rates Data is divided into 100 sec bins |
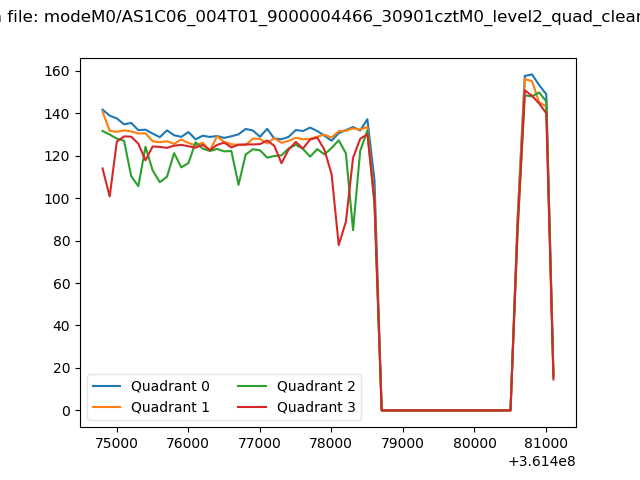 |
|
| Module-wise count rates for Quadrant A Data is divided into 100 sec bins |
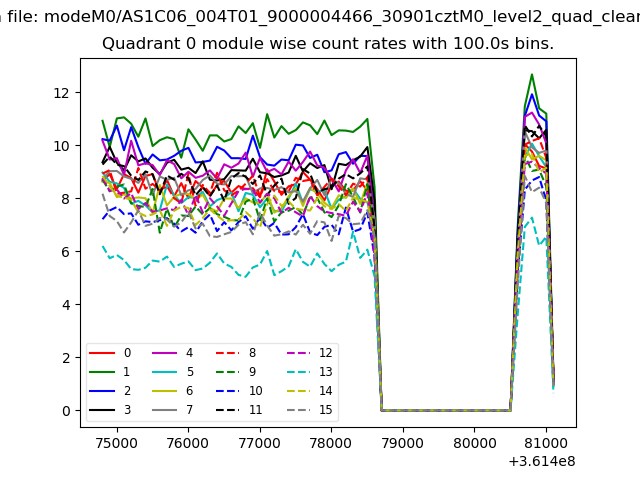 |
 |
| Module-wise count rates for Quadrant B Data is divided into 100 sec bins |
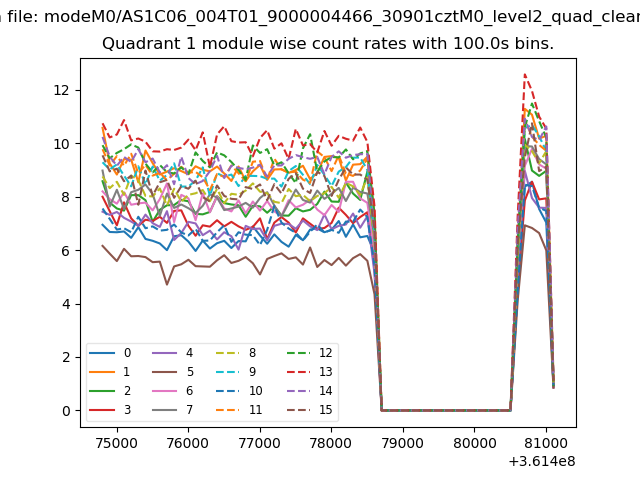 |
 |
| Module-wise count rates for Quadrant C Data is divided into 100 sec bins |
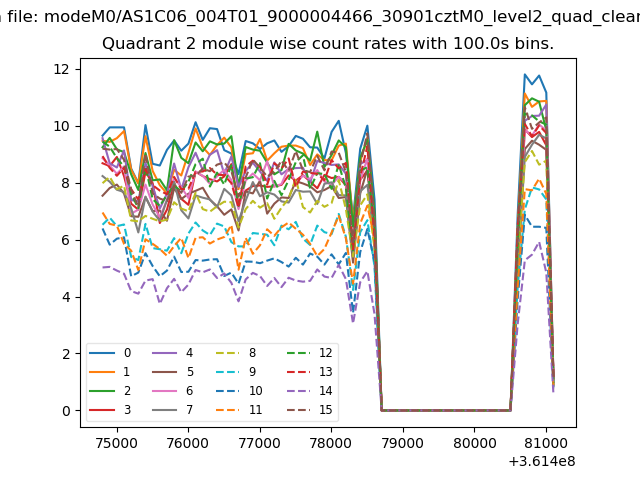 |
 |
| Module-wise count rates for Quadrant D Data is divided into 100 sec bins |
 |
 |
| Parameter | Plot |
|---|---|
| CZT HV Monitor | 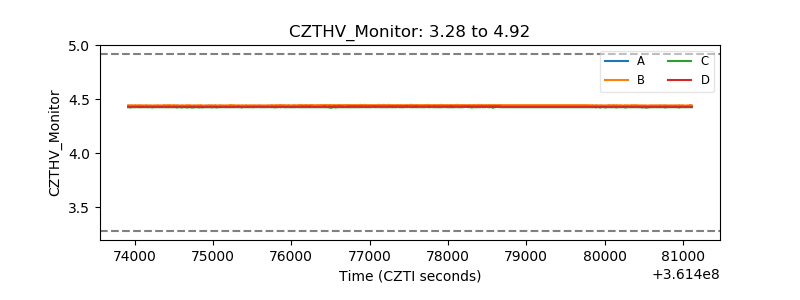 |
| D_VDD |  |
| Temperature 1 |  |
| Veto HV Monitor |  |
| Veto LLD |  |
| Alpha Counter | 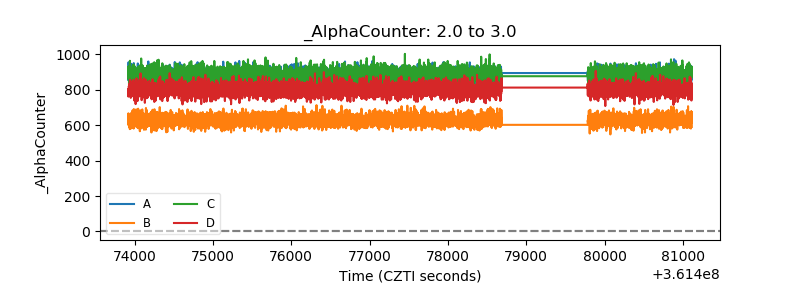 |
| _CPM_Rate | 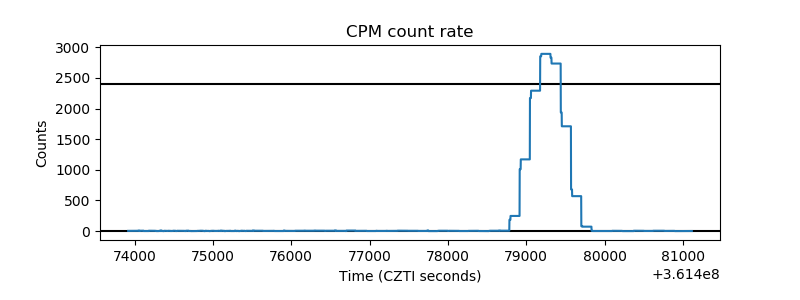 |
| CZT Counter |  |
| +2.5 Volts monitor |  |
| +5 Volts monitor |  |
| _ROLL_ROT | 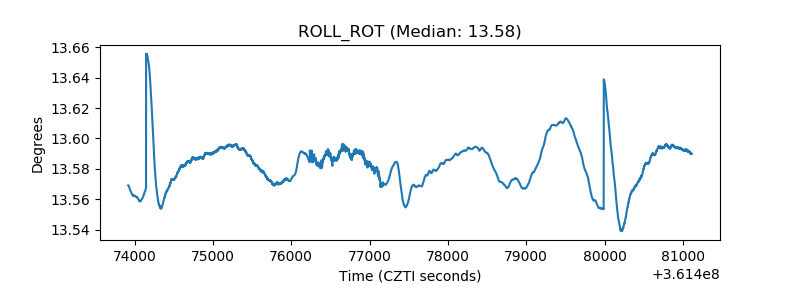 |
| _Roll_DEC |  |
| _Roll_RA |  |
| Veto Counter | 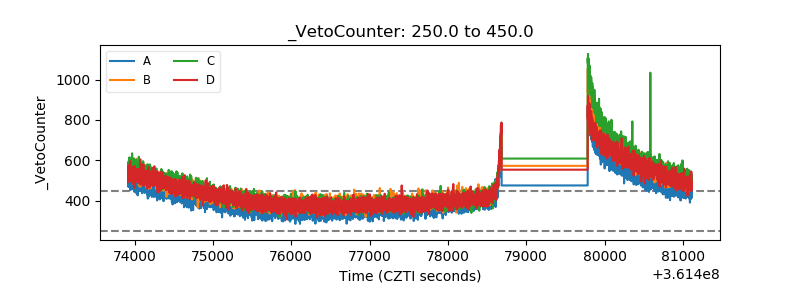 |