| Param | Original file | Final file |
|---|---|---|
| Filename | modeM0/AS1C06_004T01_9000004466_30903cztM0_level2.evt | modeM0/AS1C06_004T01_9000004466_30903cztM0_level2_quad_clean.evt |
| Size (bytes) | 570,893,760 | 119,468,160 |
| Size | 544.4 MB | 113.9 MB |
| Events in quadrant A | 3,345,541 | 810,966 |
| Events in quadrant B | 5,519,622 | 816,690 |
| Events in quadrant C | 3,921,565 | 769,452 |
| Events in quadrant D | 4,073,219 | 778,793 |
| Mode M0 | |||
|---|---|---|---|
| Quadrant | BADHDUFLAG | Total packets | Discarded packets |
| A | 0 | 14081 | 2 |
| B | 0 | 20961 | 2 |
| C | 0 | 15930 | 2 |
| D | 0 | 16235 | 2 |
| Mode M9 | |||
|---|---|---|---|
| Quadrant | BADHDUFLAG | Total packets | Discarded packets |
| A | 0 | 26 | 0 |
| B | 0 | 26 | 0 |
| C | 0 | 26 | 0 |
| D | 0 | 26 | 0 |
| Mode SS | |||
|---|---|---|---|
| Quadrant | BADHDUFLAG | Total packets | Discarded packets |
| A | 0 | 130 | 0 |
| B | 0 | 130 | 0 |
| C | 0 | 130 | 0 |
| D | 0 | 130 | 0 |
| Quadrant | Total seconds | Saturated seconds | Saturation percentage |
|---|---|---|---|
| A | 6342 | 96 | 1.513718% |
| B | 6343 | 207 | 3.263440% |
| C | 6343 | 853 | 13.447895% |
| D | 6343 | 171 | 2.695885% |
Noise dominated data is calculated using 1-second bins in cleaned event files. If a bin has >2000 counts, and if more than 50% of those come from <1% of pixels, then it is considered to be noise-dominated and hence unusable.
| Quadrant | # 1 sec bins | Bins with >0 counts | Bins with >2000 counts | High rate bins dominated by noise | Noise dominated (total time) | Noise dominated (detector-on time) | Marked lightcurve |
|---|---|---|---|---|---|---|---|
| A | 8897 | 6342 | 2 | 2 | 0.02% | 0.03% | 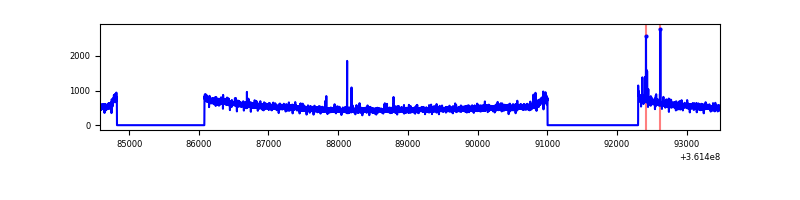 |
| B | 8898 | 6343 | 9 | 9 | 0.10% | 0.14% | 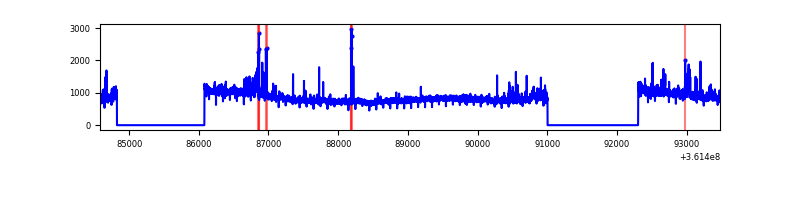 |
| C | 8898 | 6343 | 25 | 25 | 0.28% | 0.39% | 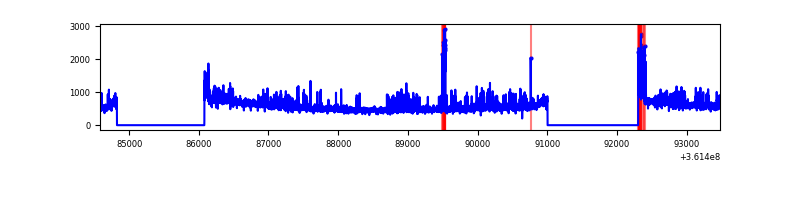 |
| D | 8898 | 6343 | 56 | 56 | 0.63% | 0.88% | 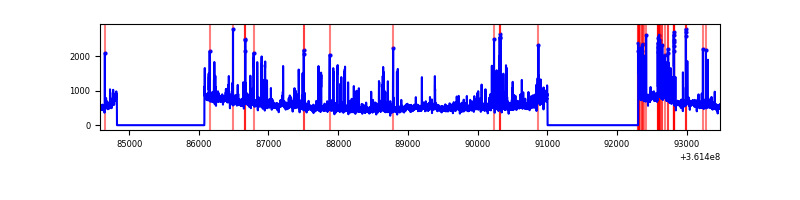 |
Top three noisy pixels from each quadrant. If the there are fewer than three noisy pixels in the level2.evt file, extra rows are filled as -1
| Pixel properties | Quadrant properties | ||||||
|---|---|---|---|---|---|---|---|
| Quadrant | DetID | PixID | Counts | Sigma | Mean | Median | Sigma |
| A | 0 | 13 | 25611 | 146.48 | 858 | 844 | 169.1 |
| A | 13 | 254 | 12040 | 66.22 | 858 | 844 | 169.1 |
| A | 3 | 137 | 7888 | 41.66 | 858 | 844 | 169.1 |
| B | 6 | 159 | 1907468 | 12073.64 | 856 | 836 | 157.9 |
| B | 0 | 190 | 136287 | 857.74 | 856 | 836 | 157.9 |
| B | 6 | 36 | 46722 | 290.57 | 856 | 836 | 157.9 |
| C | 14 | 238 | 298660 | 1615.51 | 796 | 802 | 184.4 |
| C | 14 | 254 | 237773 | 1285.27 | 796 | 802 | 184.4 |
| C | 3 | 233 | 102507 | 551.62 | 796 | 802 | 184.4 |
| D | 8 | 195 | 490207 | 2522.83 | 835 | 818 | 194.0 |
| D | 1 | 52 | 175562 | 900.82 | 835 | 818 | 194.0 |
| D | 2 | 250 | 55760 | 283.23 | 835 | 818 | 194.0 |
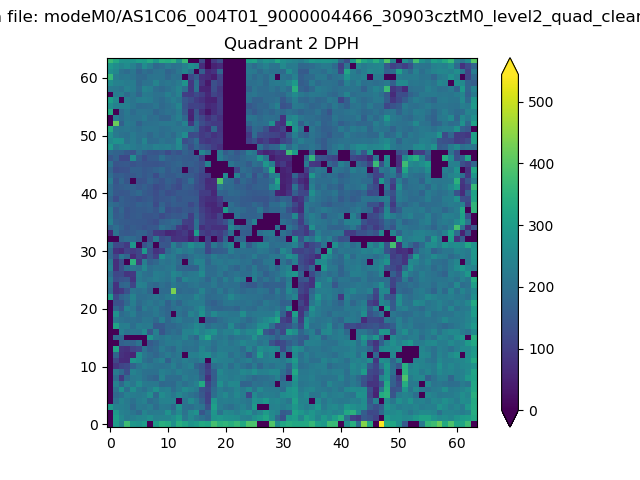
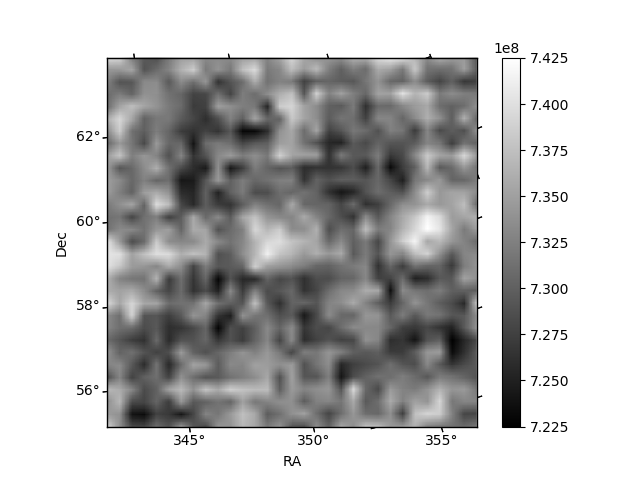
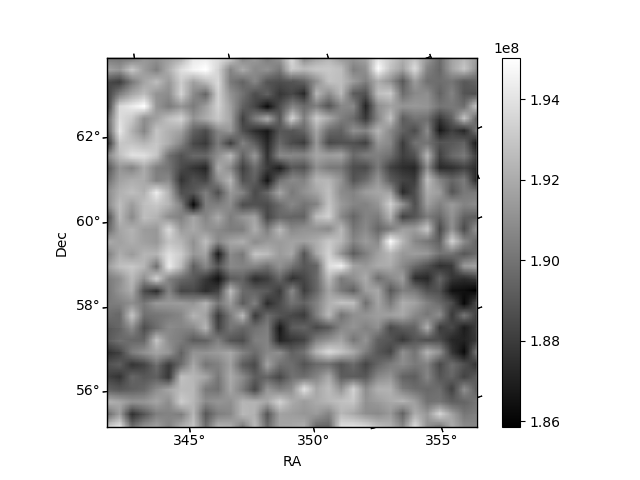
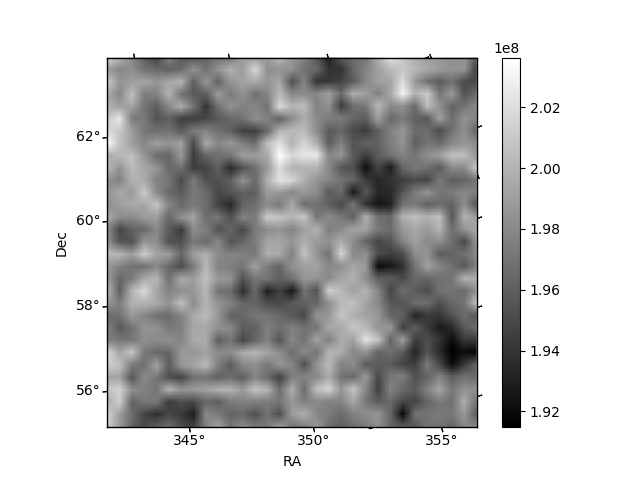
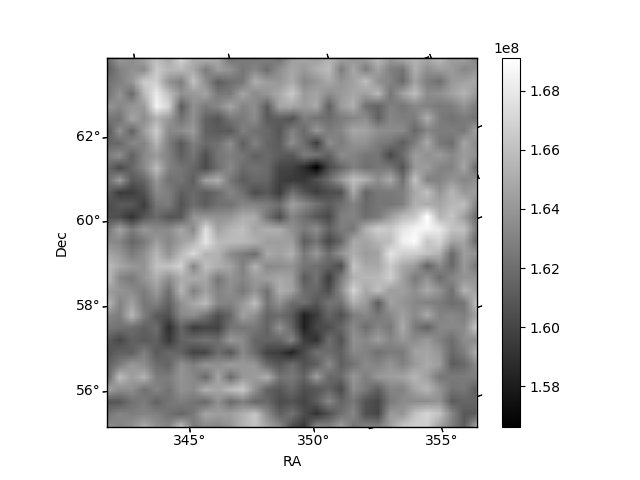
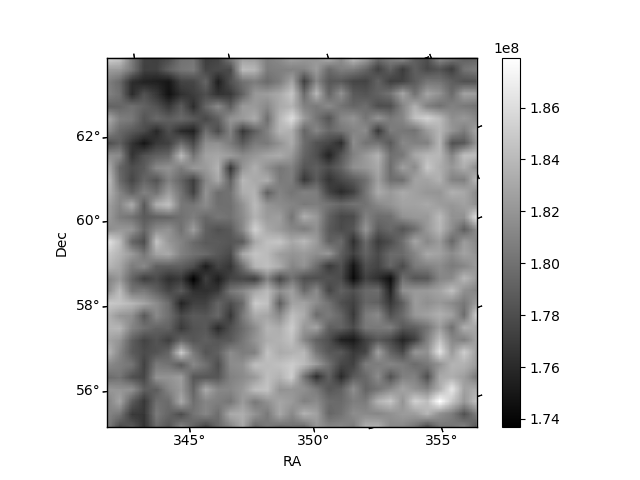
Histogram calculated using DETX and DETY for each event in the final _common_clean file
| Quadrant A | 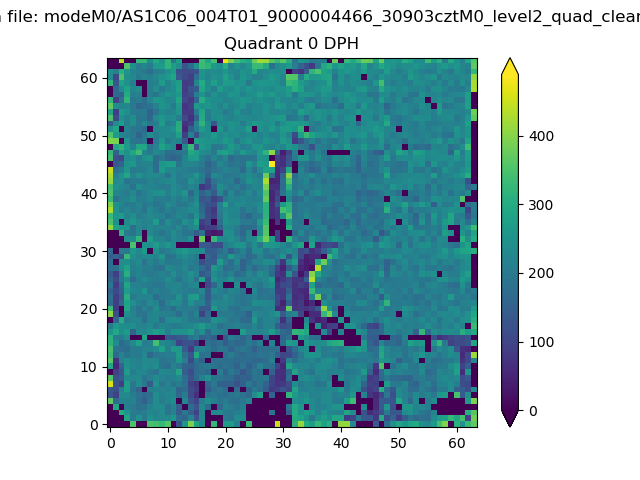 |
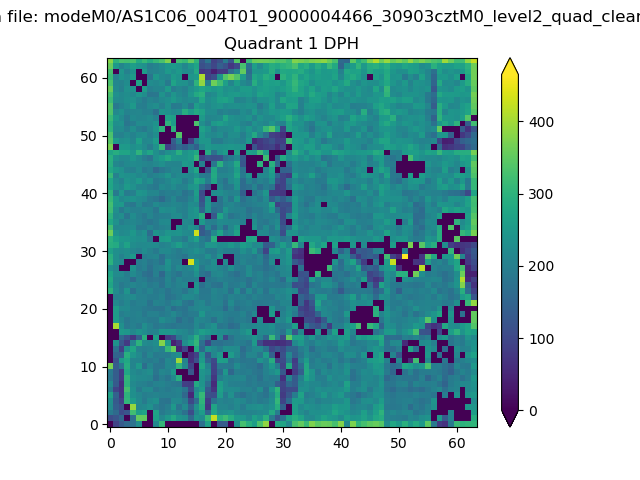 |
Quadrant B |
|---|---|---|---|
| Quadrant D | 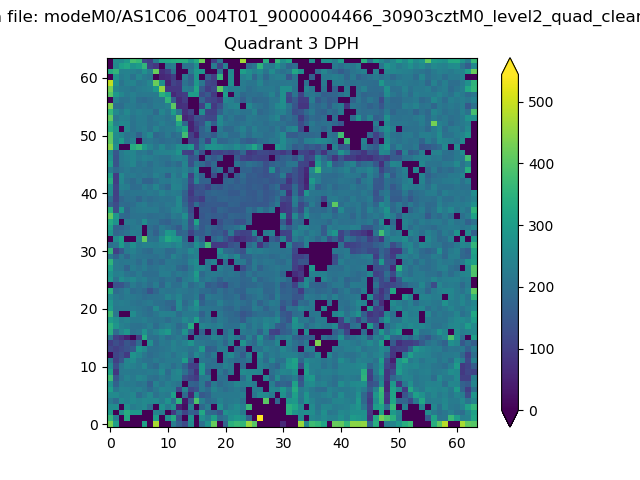 |
 |
Quadrant C |
| Plot type | Count rate plots | Images |
|---|---|---|
| Comparison with Poisson distribution Blue bars denote a histogram of data divided into 1 sec bins. Red curve is a Poisson curve with rate = median count rate of data. |
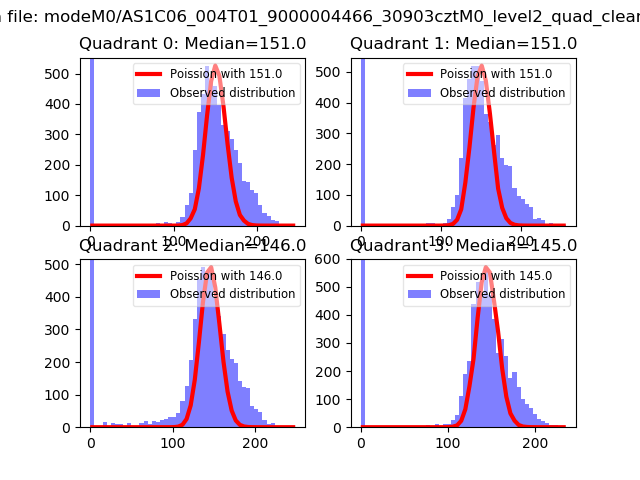 |
 |
| Quadrant-wise count rates Data is divided into 100 sec bins |
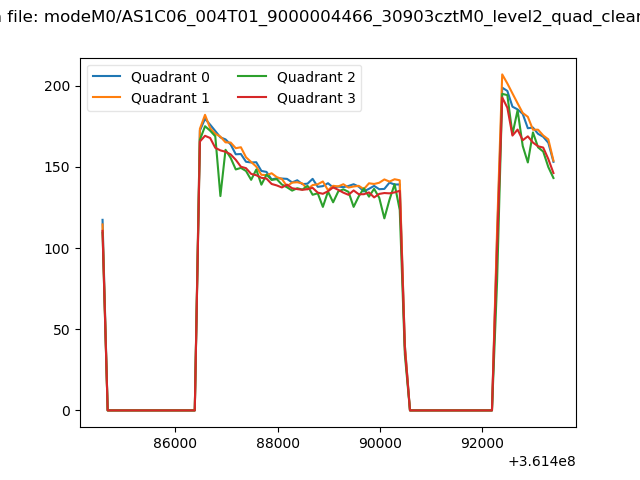 |
|
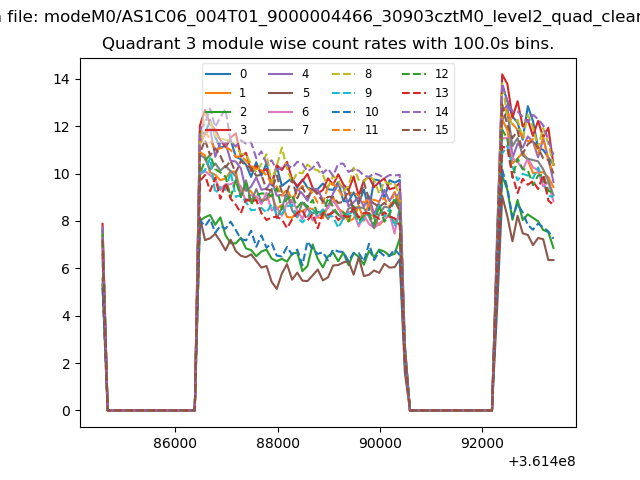
| Module-wise count rates for Quadrant A Data is divided into 100 sec bins |
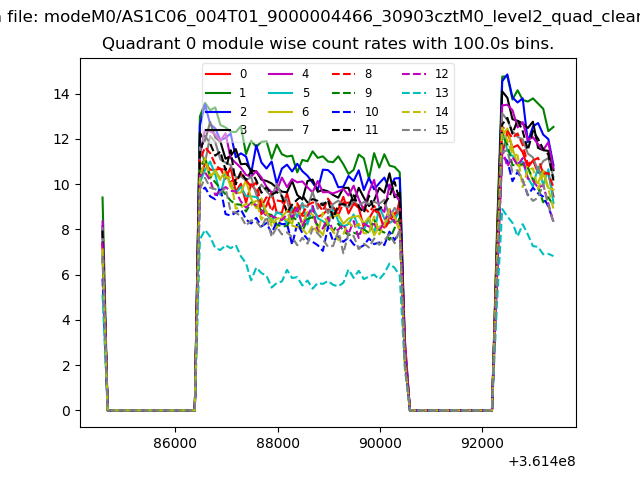 |
 |
| Module-wise count rates for Quadrant B Data is divided into 100 sec bins |
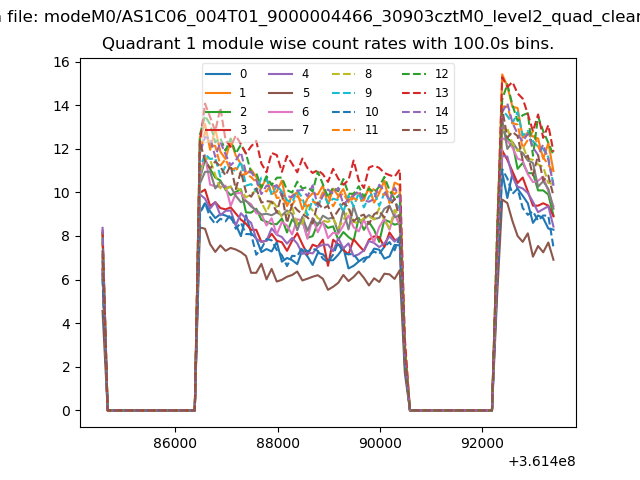 |
 |
| Module-wise count rates for Quadrant C Data is divided into 100 sec bins |
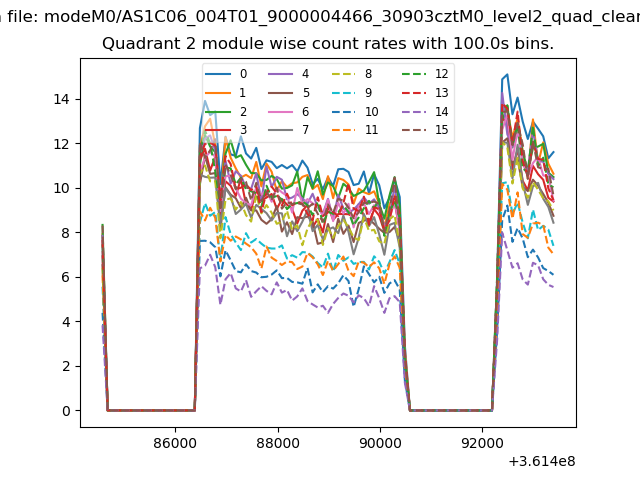 |
 |
| Module-wise count rates for Quadrant D Data is divided into 100 sec bins |
 |
 |
| Parameter | Plot |
|---|---|
| CZT HV Monitor | 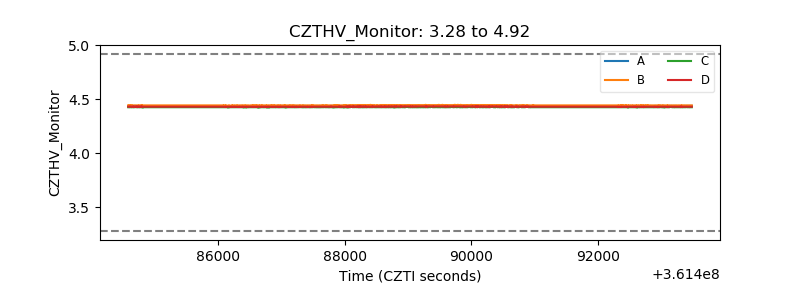 |
| D_VDD | 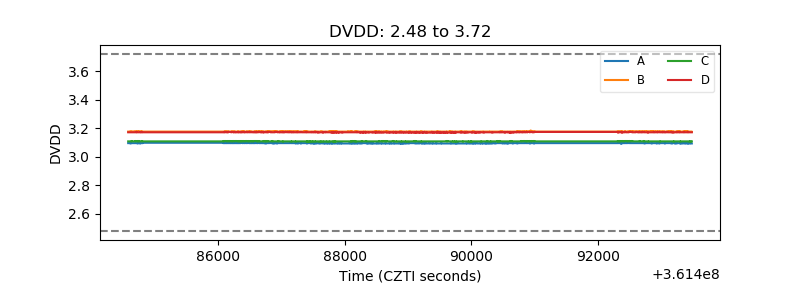 |
| Temperature 1 | 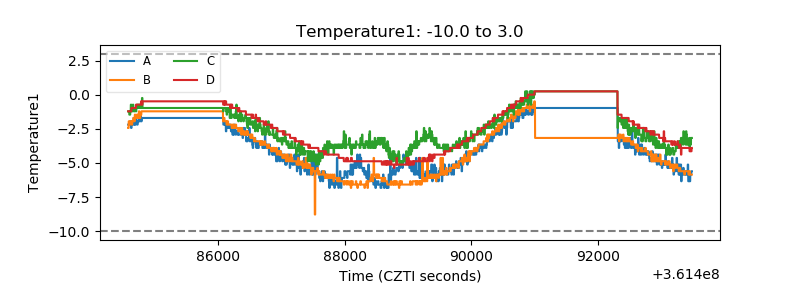 |
| Veto HV Monitor | 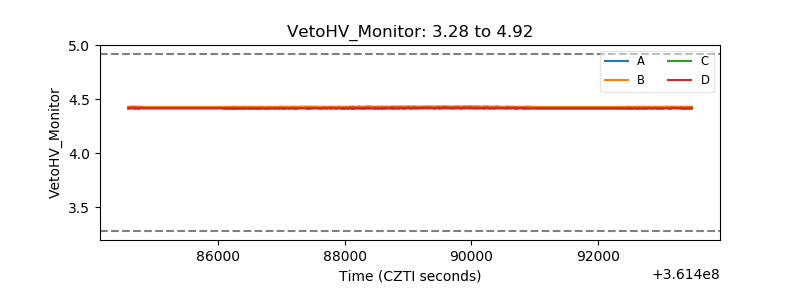 |
| Veto LLD | 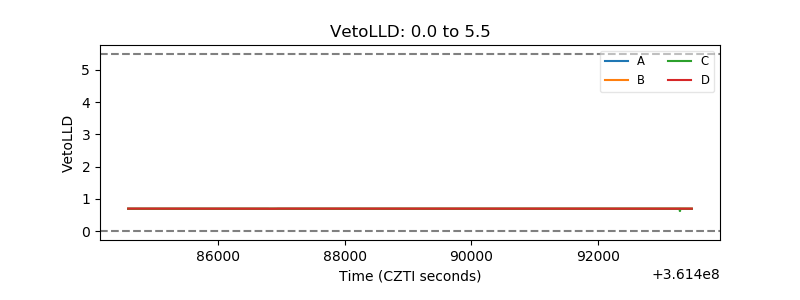 |
| Alpha Counter | 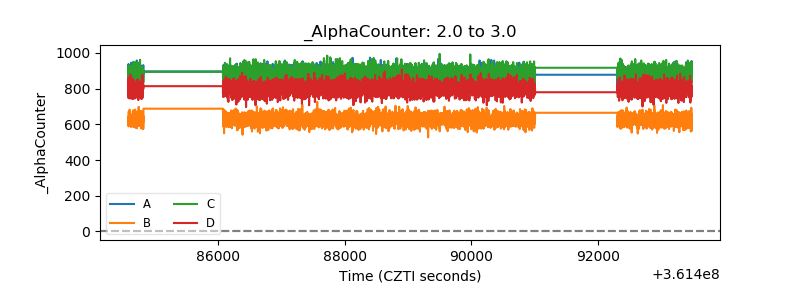 |
| _CPM_Rate | 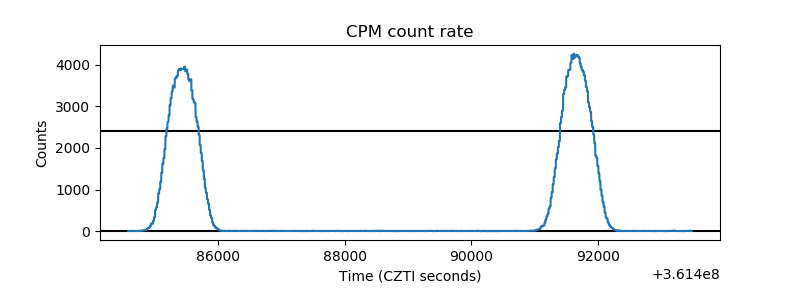 |
| CZT Counter | 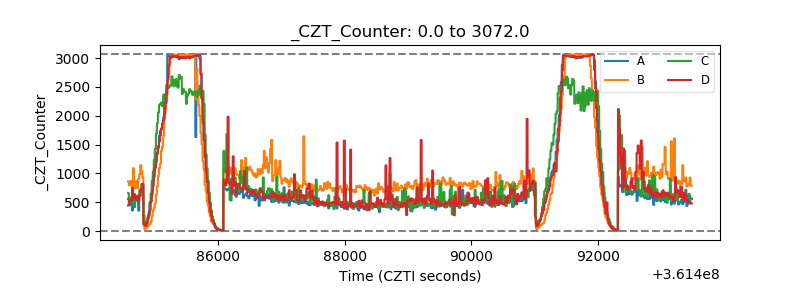 |
| +2.5 Volts monitor |  |
| +5 Volts monitor |  |
| _ROLL_ROT | 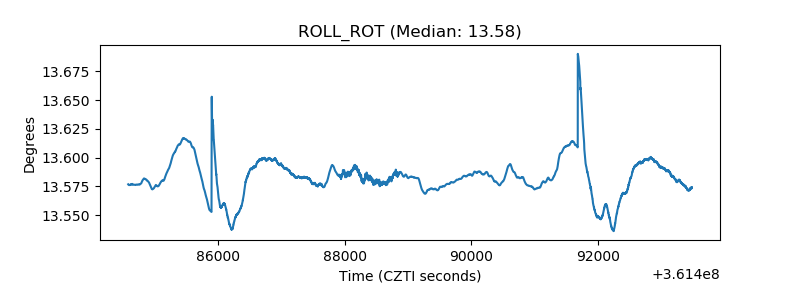 |
| _Roll_DEC |  |
| _Roll_RA | 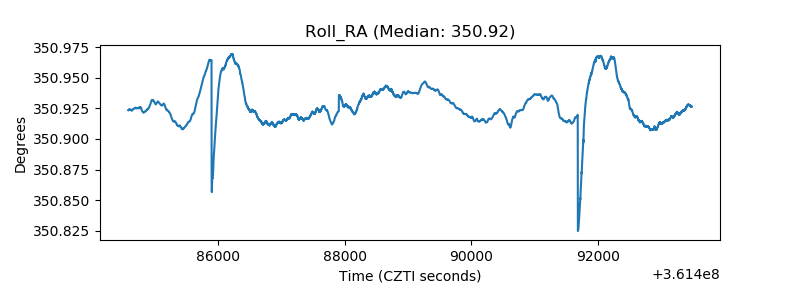 |
| Veto Counter | 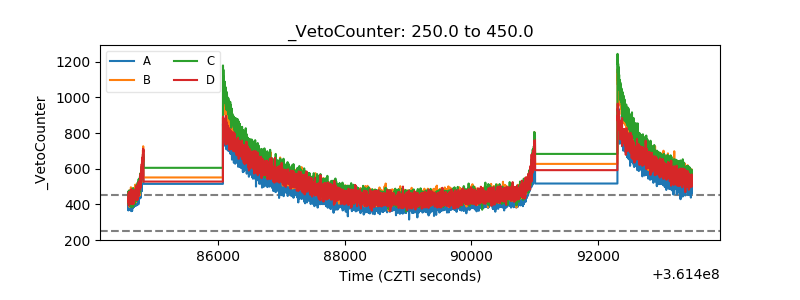 |