| Param | Original file | Final file |
|---|---|---|
| Filename | modeM0/AS1C06_004T01_9000004466_30904cztM0_level2.evt | modeM0/AS1C06_004T01_9000004466_30904cztM0_level2_quad_clean.evt |
| Size (bytes) | 560,001,600 | 122,319,360 |
| Size | 534.1 MB | 116.7 MB |
| Events in quadrant A | 3,212,010 | 834,591 |
| Events in quadrant B | 5,576,427 | 847,374 |
| Events in quadrant C | 3,688,413 | 794,134 |
| Events in quadrant D | 4,065,399 | 798,257 |
| Mode M0 | |||
|---|---|---|---|
| Quadrant | BADHDUFLAG | Total packets | Discarded packets |
| A | 0 | 13449 | 2 |
| B | 0 | 20596 | 2 |
| C | 0 | 14939 | 2 |
| D | 0 | 16136 | 2 |
| Mode M9 | |||
|---|---|---|---|
| Quadrant | BADHDUFLAG | Total packets | Discarded packets |
| A | 0 | 26 | 0 |
| B | 0 | 26 | 0 |
| C | 0 | 26 | 0 |
| D | 0 | 26 | 0 |
| Mode SS | |||
|---|---|---|---|
| Quadrant | BADHDUFLAG | Total packets | Discarded packets |
| A | 0 | 128 | 0 |
| B | 0 | 128 | 0 |
| C | 0 | 128 | 0 |
| D | 0 | 128 | 0 |
| Quadrant | Total seconds | Saturated seconds | Saturation percentage |
|---|---|---|---|
| A | 6162 | 57 | 0.925024% |
| B | 6162 | 209 | 3.391756% |
| C | 6162 | 577 | 9.363843% |
| D | 6163 | 132 | 2.141814% |
Noise dominated data is calculated using 1-second bins in cleaned event files. If a bin has >2000 counts, and if more than 50% of those come from <1% of pixels, then it is considered to be noise-dominated and hence unusable.
| Quadrant | # 1 sec bins | Bins with >0 counts | Bins with >2000 counts | High rate bins dominated by noise | Noise dominated (total time) | Noise dominated (detector-on time) | Marked lightcurve |
|---|---|---|---|---|---|---|---|
| A | 8837 | 6163 | 4 | 4 | 0.05% | 0.06% | 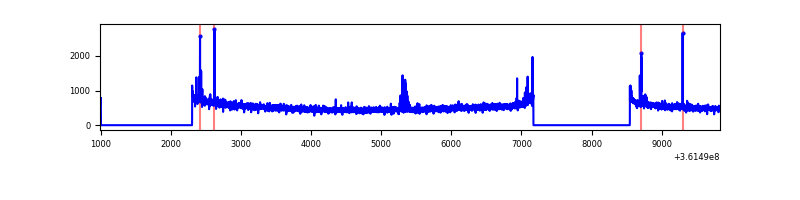 |
| B | 8837 | 6163 | 18 | 18 | 0.20% | 0.29% | 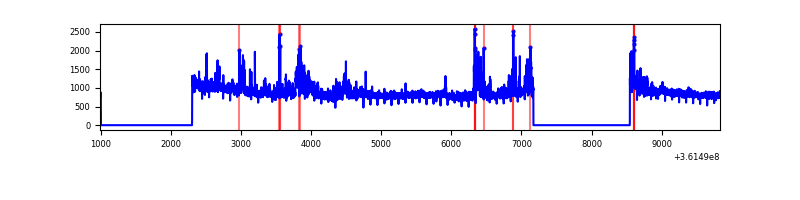 |
| C | 8837 | 6163 | 32 | 32 | 0.36% | 0.52% | 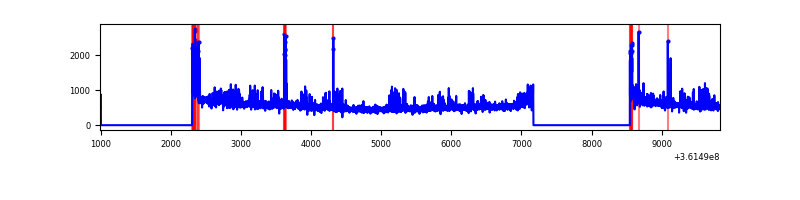 |
| D | 8838 | 6164 | 57 | 57 | 0.64% | 0.92% | 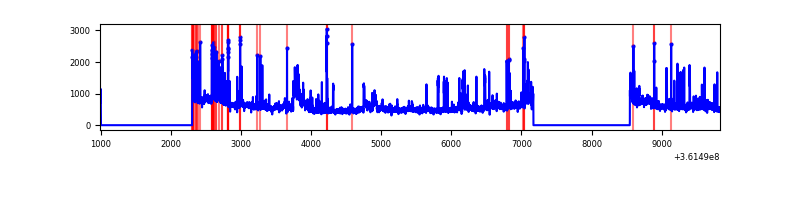 |
Top three noisy pixels from each quadrant. If the there are fewer than three noisy pixels in the level2.evt file, extra rows are filled as -1
| Pixel properties | Quadrant properties | ||||||
|---|---|---|---|---|---|---|---|
| Quadrant | DetID | PixID | Counts | Sigma | Mean | Median | Sigma |
| A | 0 | 13 | 49509 | 303.75 | 817 | 806 | 160.3 |
| A | 13 | 254 | 11538 | 66.93 | 817 | 806 | 160.3 |
| A | 3 | 137 | 7461 | 41.51 | 817 | 806 | 160.3 |
| B | 6 | 159 | 1822567 | 12092.49 | 819 | 802 | 150.7 |
| B | 6 | 36 | 289363 | 1915.41 | 819 | 802 | 150.7 |
| B | 0 | 190 | 144408 | 953.23 | 819 | 802 | 150.7 |
| C | 14 | 238 | 237214 | 1344.82 | 767 | 773 | 175.8 |
| C | 0 | 10 | 184343 | 1044.11 | 767 | 773 | 175.8 |
| C | 14 | 254 | 160184 | 906.7 | 767 | 773 | 175.8 |
| D | 8 | 195 | 622661 | 3361.27 | 789 | 770 | 185.0 |
| D | 1 | 52 | 156168 | 839.91 | 789 | 770 | 185.0 |
| D | 13 | 174 | 126916 | 681.81 | 789 | 770 | 185.0 |
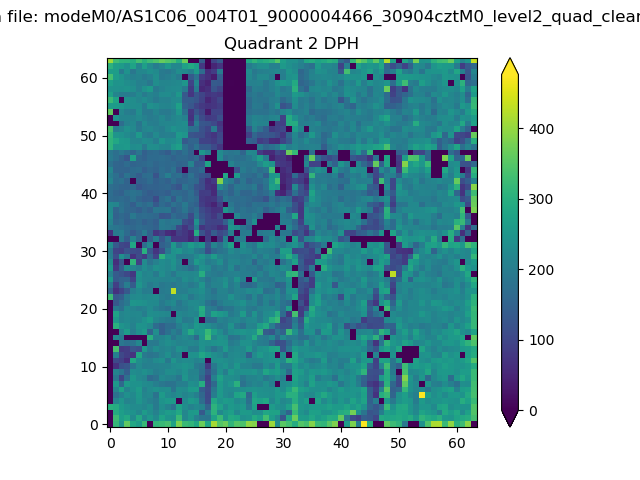
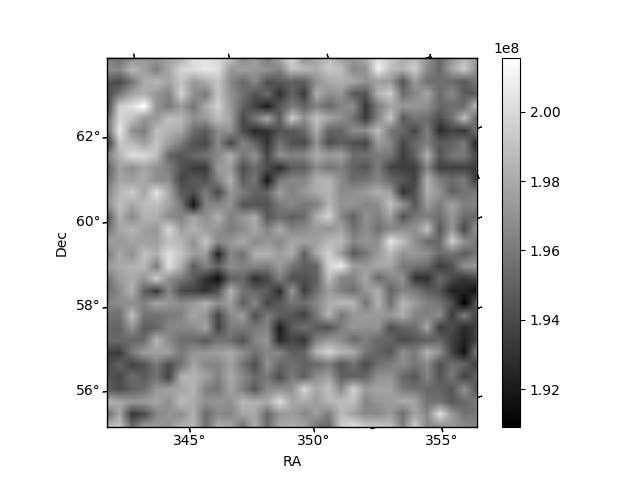
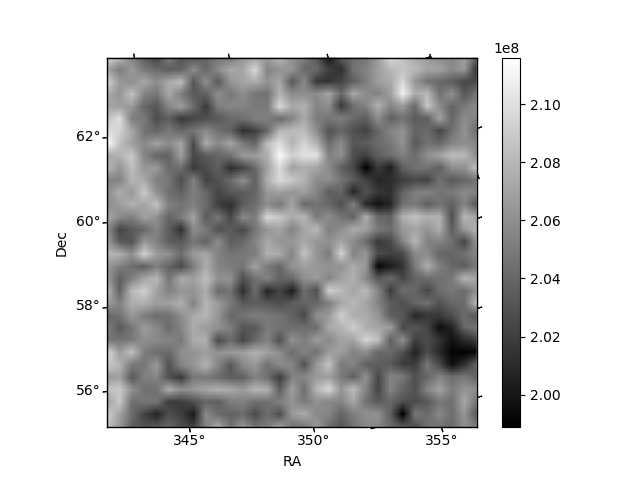
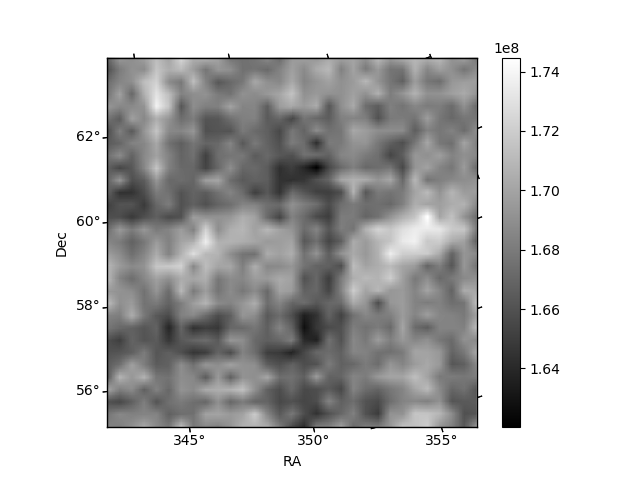
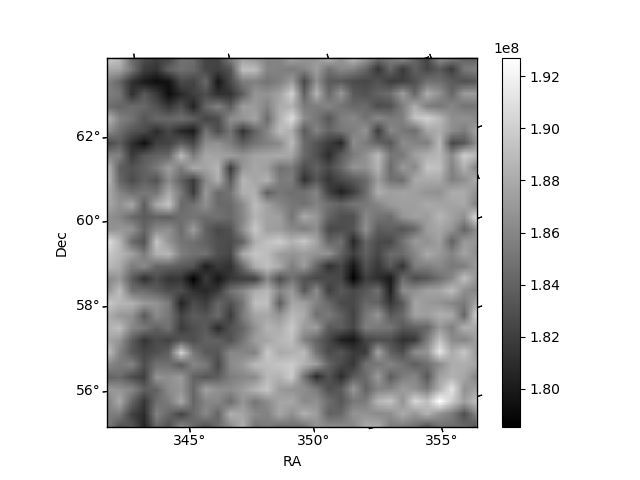
Histogram calculated using DETX and DETY for each event in the final _common_clean file
| Quadrant A | 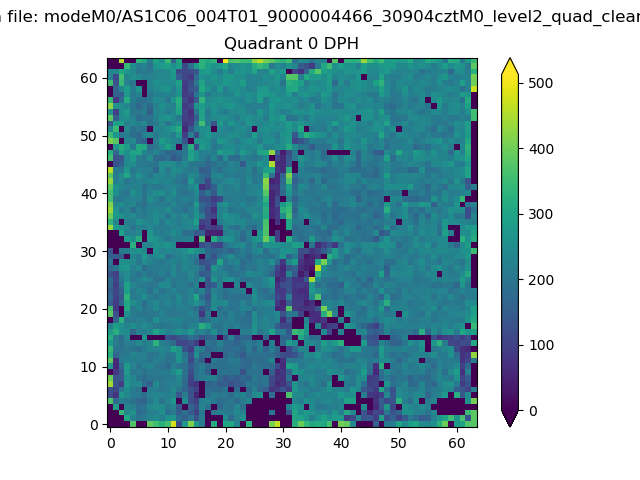 |
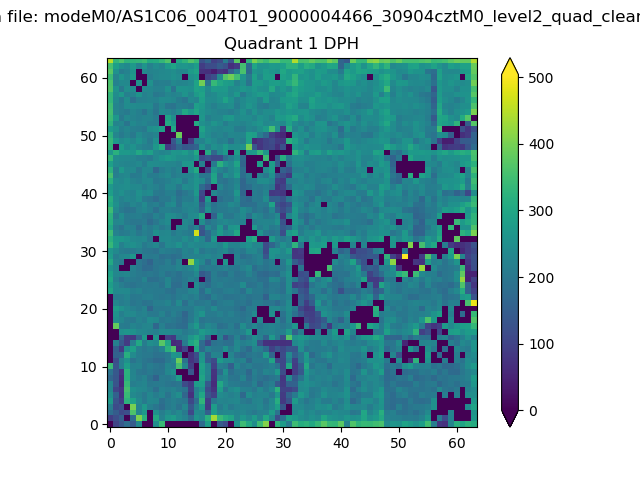 |
Quadrant B |
|---|---|---|---|
| Quadrant D | 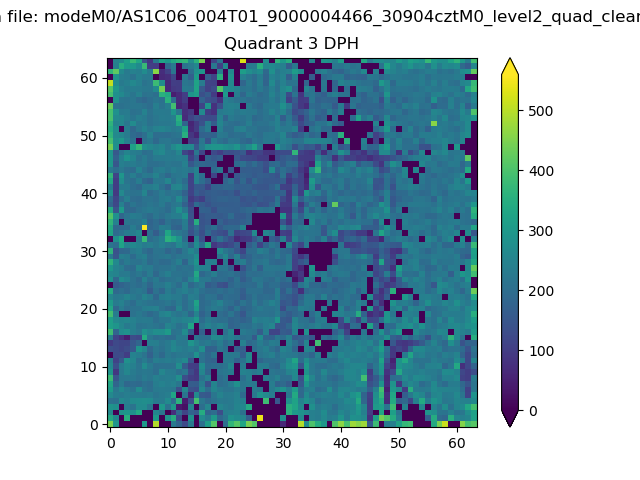 |
 |
Quadrant C |
| Plot type | Count rate plots | Images |
|---|---|---|
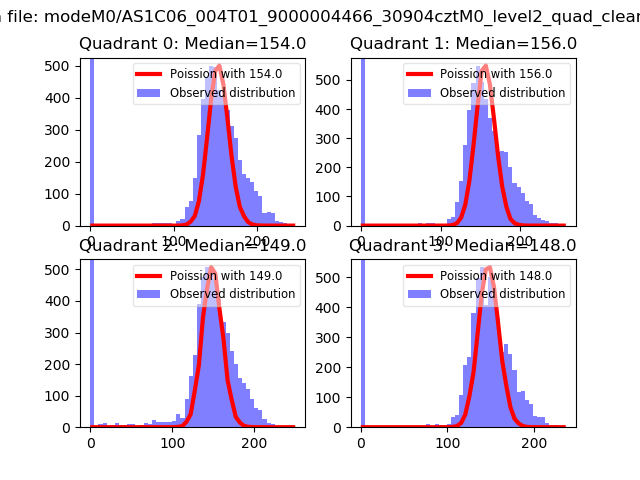
| Comparison with Poisson distribution Blue bars denote a histogram of data divided into 1 sec bins. Red curve is a Poisson curve with rate = median count rate of data. |
 |
 |
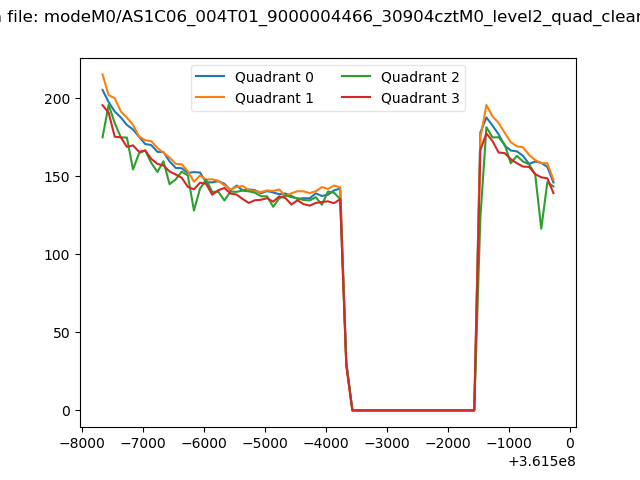
| Quadrant-wise count rates Data is divided into 100 sec bins |
 |
|
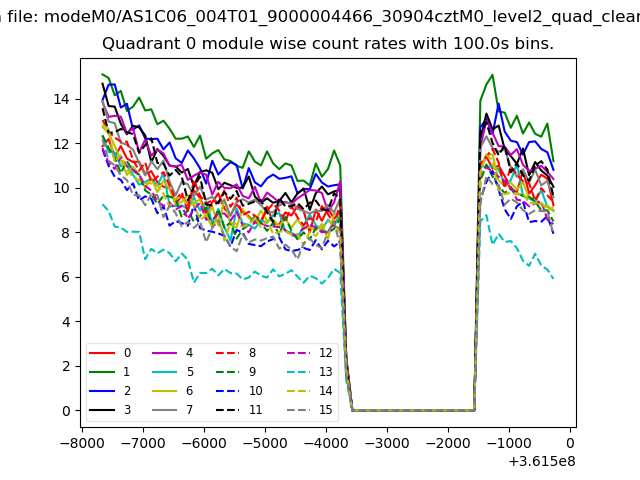
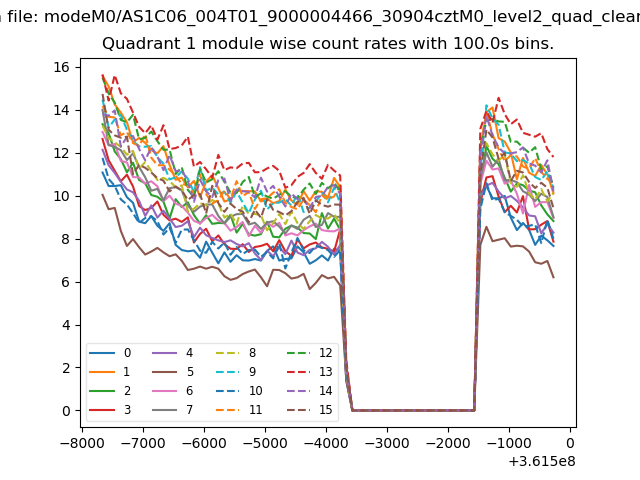
| Module-wise count rates for Quadrant A Data is divided into 100 sec bins |
 |
 |
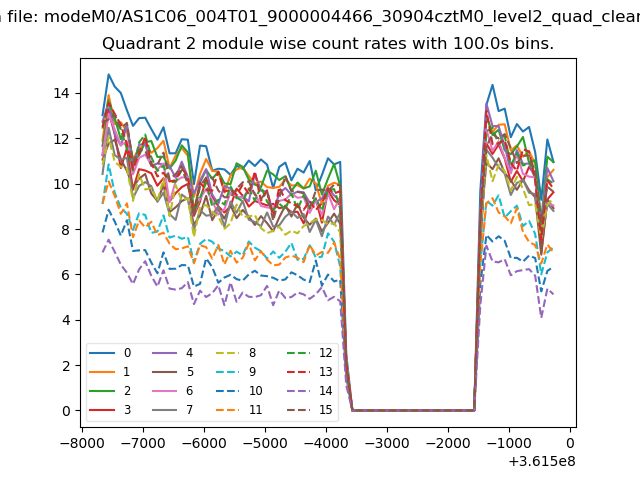
| Module-wise count rates for Quadrant B Data is divided into 100 sec bins |
 |
 |
| Module-wise count rates for Quadrant C Data is divided into 100 sec bins |
 |
 |
| Module-wise count rates for Quadrant D Data is divided into 100 sec bins |
 |
 |
| Parameter | Plot |
|---|---|
| CZT HV Monitor | 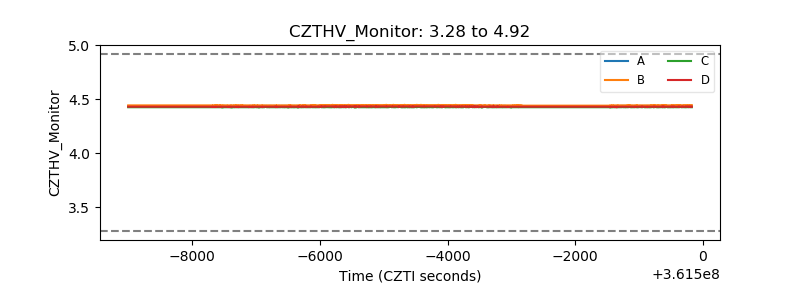 |
| D_VDD |  |
| Temperature 1 | 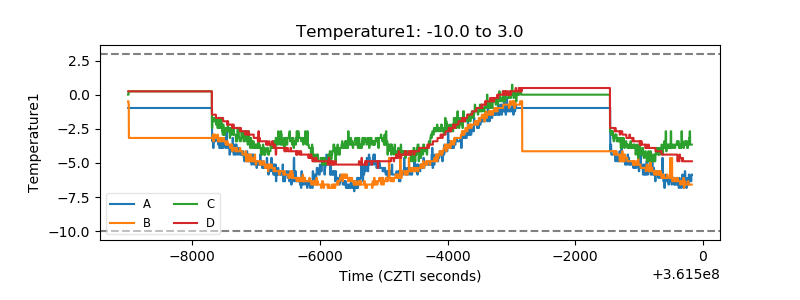 |
| Veto HV Monitor | 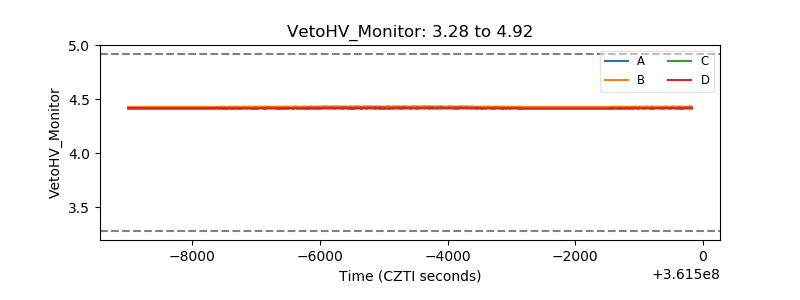 |
| Veto LLD | 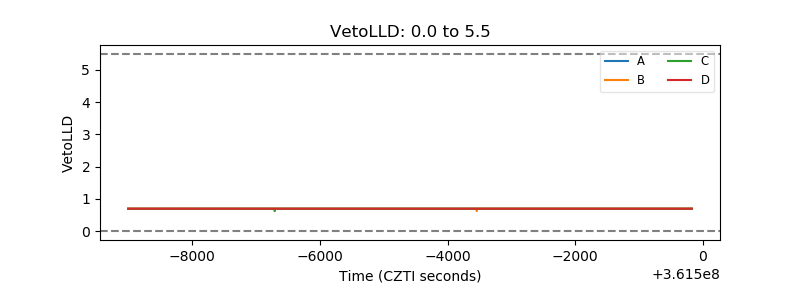 |
| Alpha Counter | 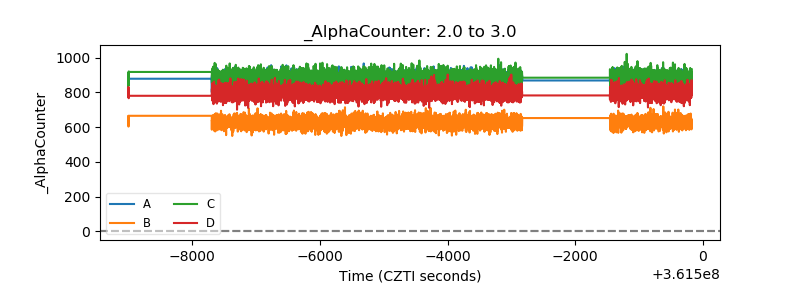 |
| _CPM_Rate | 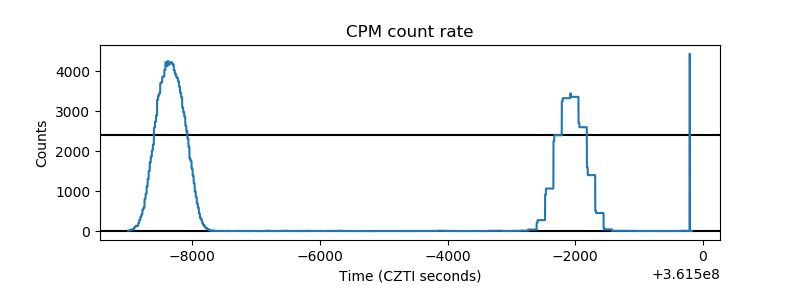 |
| CZT Counter | 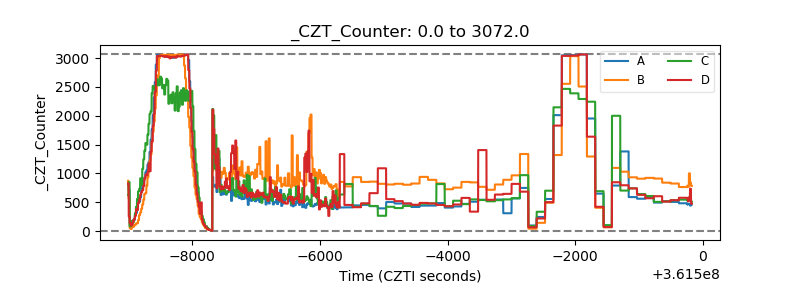 |
| +2.5 Volts monitor |  |
| +5 Volts monitor |  |
| _ROLL_ROT | 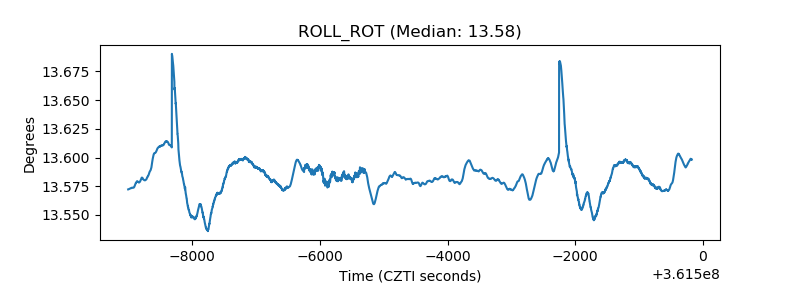 |
| _Roll_DEC | 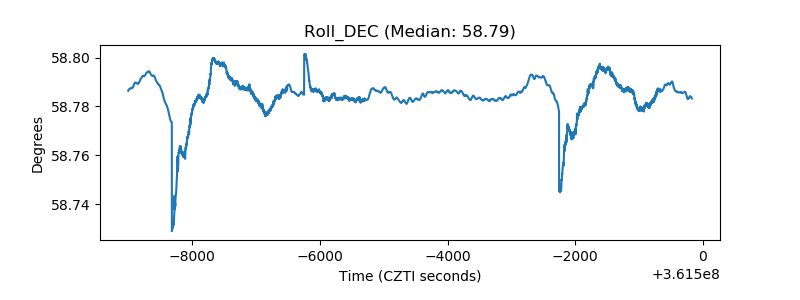 |
| _Roll_RA | 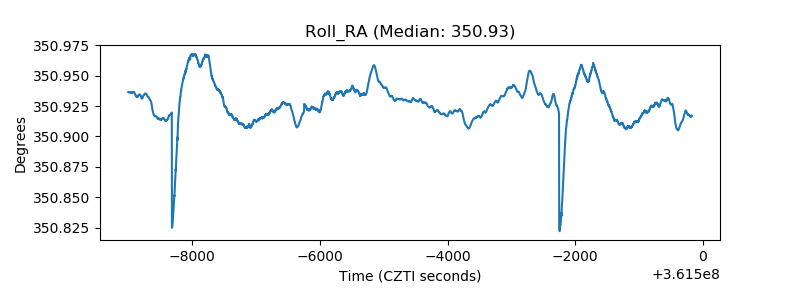 |
| Veto Counter | 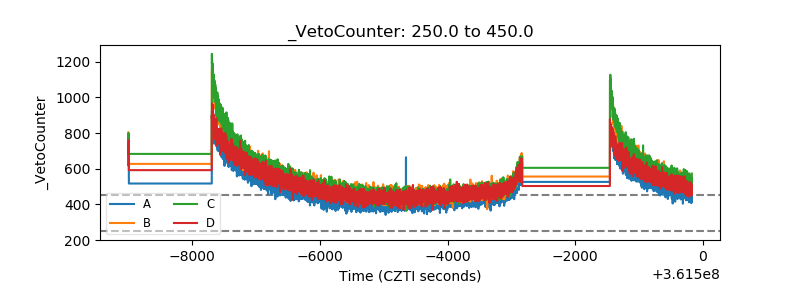 |