| Param | Original file | Final file |
|---|---|---|
| Filename | modeM0/AS1C06_004T01_9000004466_30905cztM0_level2.evt | modeM0/AS1C06_004T01_9000004466_30905cztM0_level2_quad_clean.evt |
| Size (bytes) | 541,091,520 | 110,733,120 |
| Size | 516.0 MB | 105.6 MB |
| Events in quadrant A | 3,106,617 | 744,653 |
| Events in quadrant B | 5,375,432 | 756,819 |
| Events in quadrant C | 3,677,447 | 703,677 |
| Events in quadrant D | 3,804,094 | 712,421 |
| Mode M0 | |||
|---|---|---|---|
| Quadrant | BADHDUFLAG | Total packets | Discarded packets |
| A | 0 | 13192 | 2 |
| B | 0 | 20077 | 2 |
| C | 0 | 14866 | 2 |
| D | 0 | 15342 | 2 |
| Mode M9 | |||
|---|---|---|---|
| Quadrant | BADHDUFLAG | Total packets | Discarded packets |
| A | 0 | 13 | 0 |
| B | 0 | 13 | 0 |
| C | 0 | 13 | 0 |
| D | 0 | 13 | 0 |
| Mode SS | |||
|---|---|---|---|
| Quadrant | BADHDUFLAG | Total packets | Discarded packets |
| A | 0 | 128 | 0 |
| B | 0 | 128 | 0 |
| C | 0 | 128 | 0 |
| D | 0 | 128 | 0 |
| Quadrant | Total seconds | Saturated seconds | Saturation percentage |
|---|---|---|---|
| A | 6243 | 39 | 0.624700% |
| B | 6244 | 198 | 3.171044% |
| C | 6244 | 655 | 10.490070% |
| D | 6244 | 52 | 0.832799% |
Noise dominated data is calculated using 1-second bins in cleaned event files. If a bin has >2000 counts, and if more than 50% of those come from <1% of pixels, then it is considered to be noise-dominated and hence unusable.
| Quadrant | # 1 sec bins | Bins with >0 counts | Bins with >2000 counts | High rate bins dominated by noise | Noise dominated (total time) | Noise dominated (detector-on time) | Marked lightcurve |
|---|---|---|---|---|---|---|---|
| A | 7558 | 6244 | 4 | 4 | 0.05% | 0.06% | 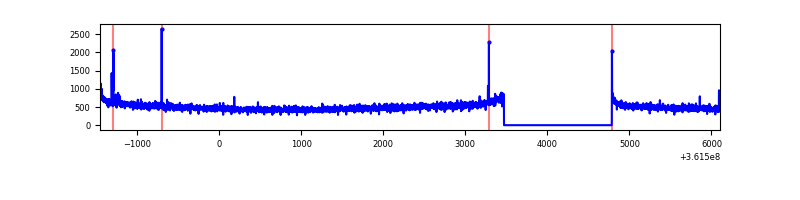 |
| B | 7559 | 6244 | 18 | 18 | 0.24% | 0.29% | 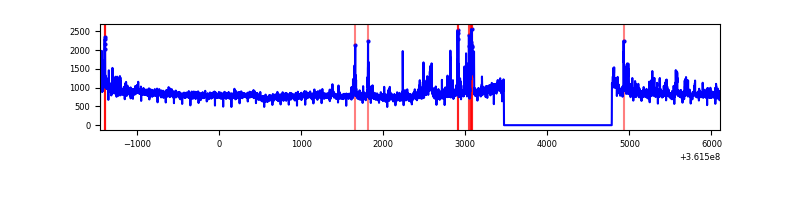 |
| C | 7558 | 6243 | 27 | 27 | 0.36% | 0.43% | 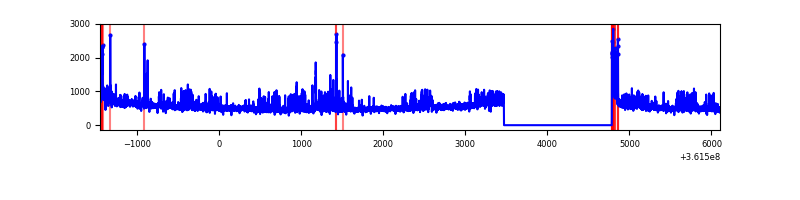 |
| D | 7559 | 6245 | 23 | 23 | 0.30% | 0.37% | 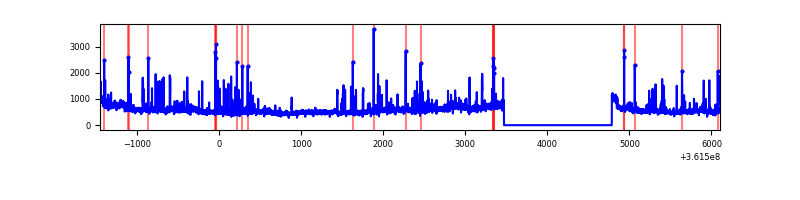 |
Top three noisy pixels from each quadrant. If the there are fewer than three noisy pixels in the level2.evt file, extra rows are filled as -1
| Pixel properties | Quadrant properties | ||||||
|---|---|---|---|---|---|---|---|
| Quadrant | DetID | PixID | Counts | Sigma | Mean | Median | Sigma |
| A | 0 | 13 | 13380 | 79.8 | 798 | 784 | 157.8 |
| A | 13 | 254 | 11179 | 65.86 | 798 | 784 | 157.8 |
| A | 3 | 137 | 7481 | 42.43 | 798 | 784 | 157.8 |
| B | 6 | 159 | 1850143 | 12673.17 | 802 | 784 | 145.9 |
| B | 6 | 36 | 139812 | 952.72 | 802 | 784 | 145.9 |
| B | 0 | 190 | 123088 | 838.12 | 802 | 784 | 145.9 |
| C | 14 | 238 | 264877 | 1548.61 | 743 | 749 | 170.6 |
| C | 14 | 254 | 204741 | 1196.02 | 743 | 749 | 170.6 |
| C | 0 | 10 | 196108 | 1145.41 | 743 | 749 | 170.6 |
| D | 8 | 195 | 599646 | 3297.59 | 770 | 753 | 181.6 |
| D | 1 | 52 | 62904 | 342.21 | 770 | 753 | 181.6 |
| D | 12 | 233 | 56604 | 307.52 | 770 | 753 | 181.6 |
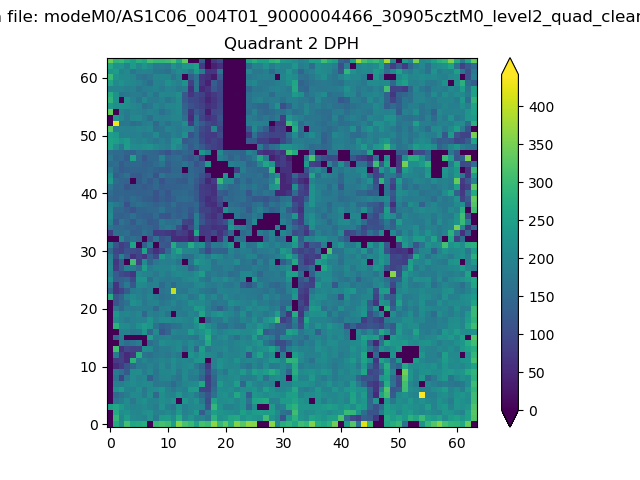
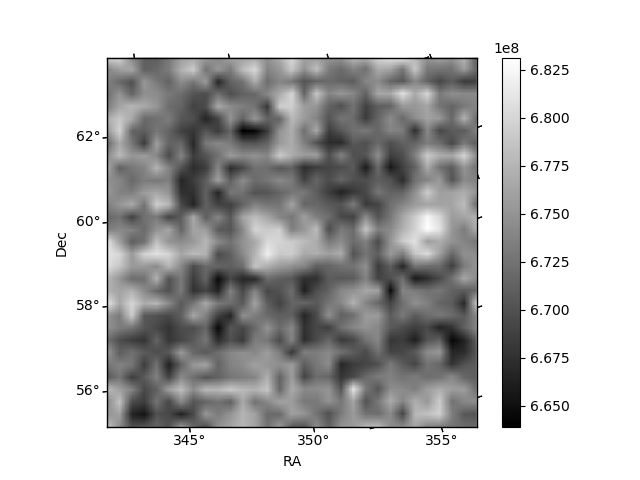
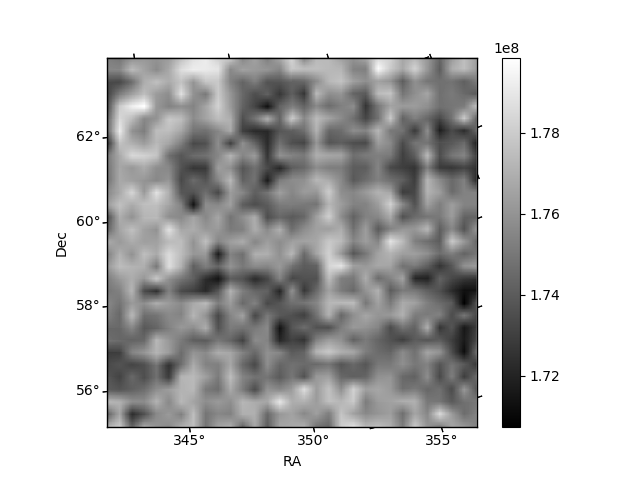
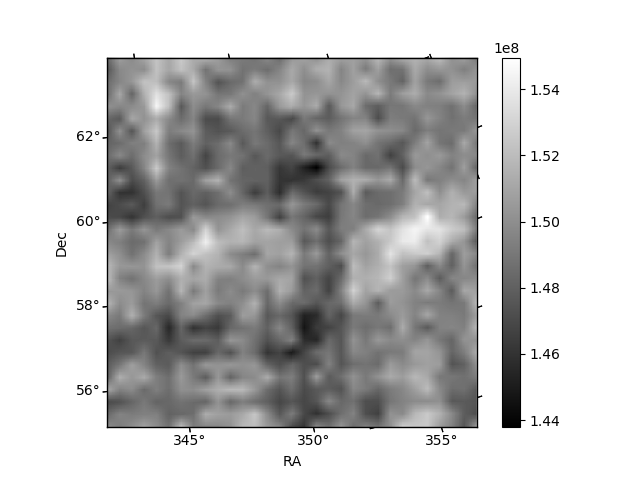
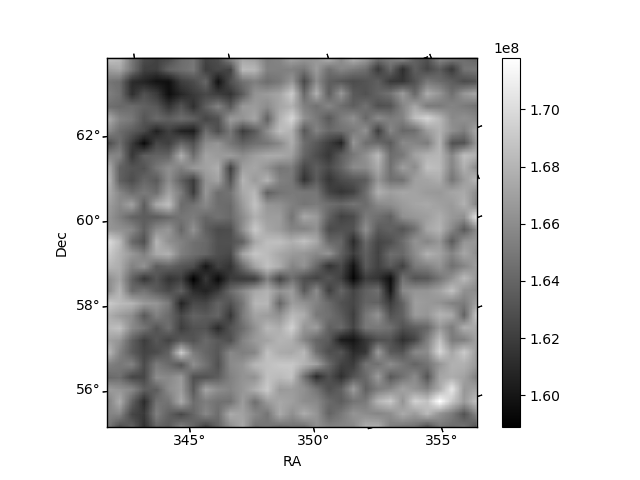
Histogram calculated using DETX and DETY for each event in the final _common_clean file
| Quadrant A | 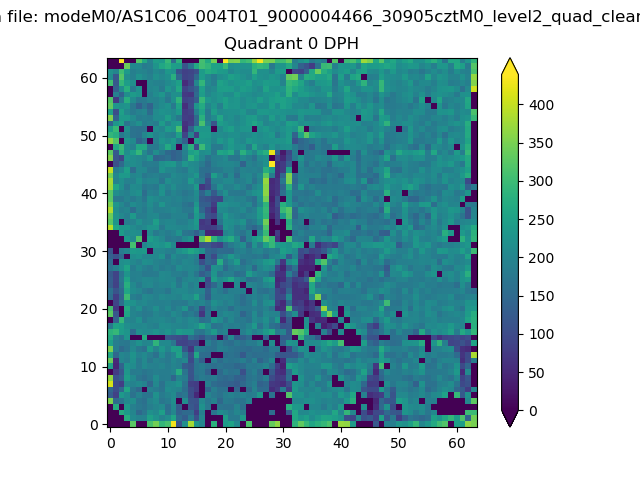 |
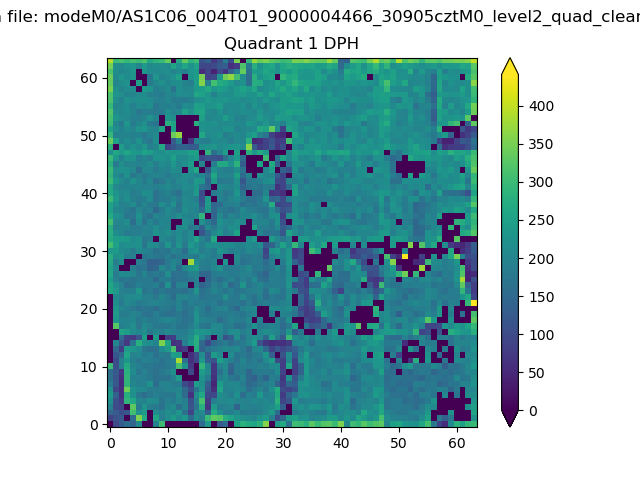 |
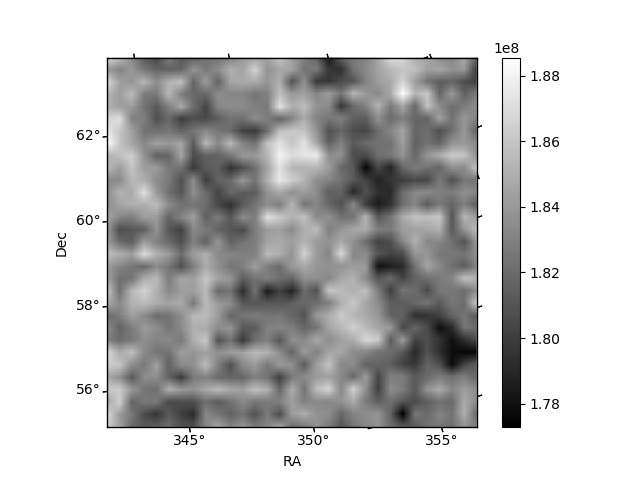
Quadrant B |
|---|---|---|---|
| Quadrant D | 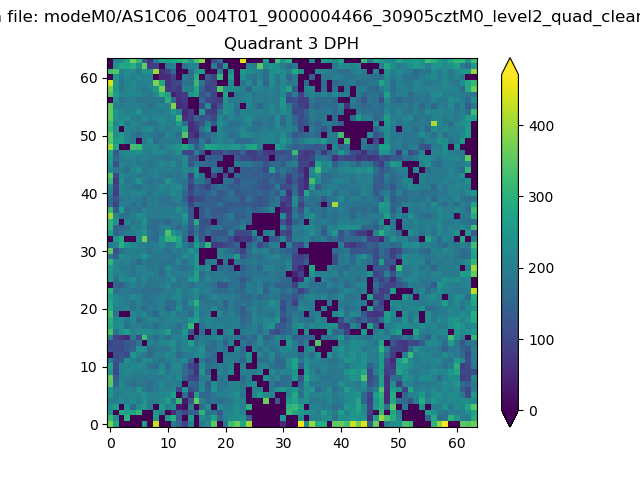 |
 |
Quadrant C |
| Plot type | Count rate plots | Images |
|---|---|---|
| Comparison with Poisson distribution Blue bars denote a histogram of data divided into 1 sec bins. Red curve is a Poisson curve with rate = median count rate of data. |
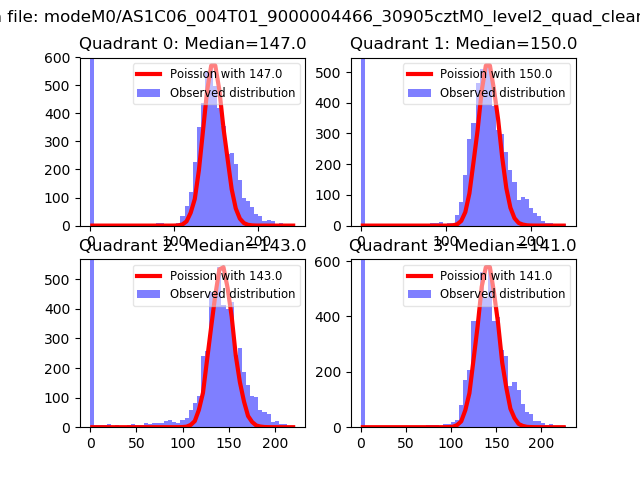 |
 |
| Quadrant-wise count rates Data is divided into 100 sec bins |
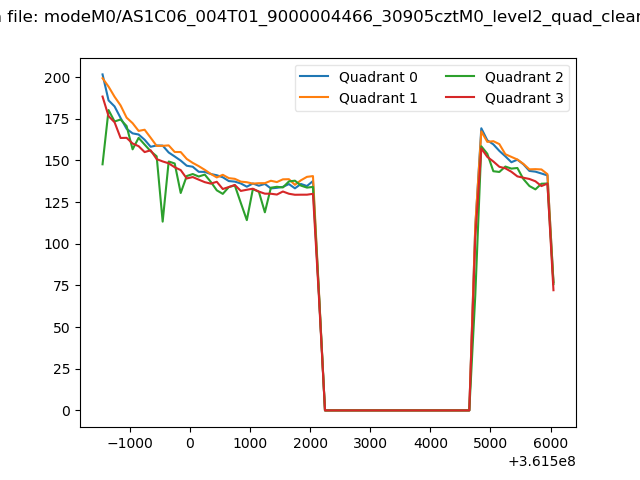 |
|
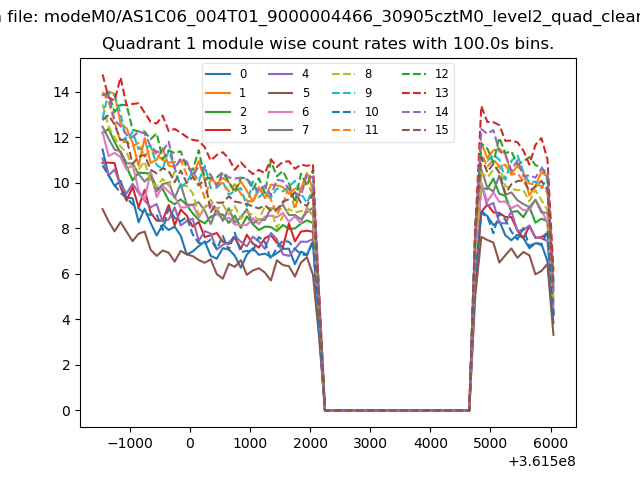
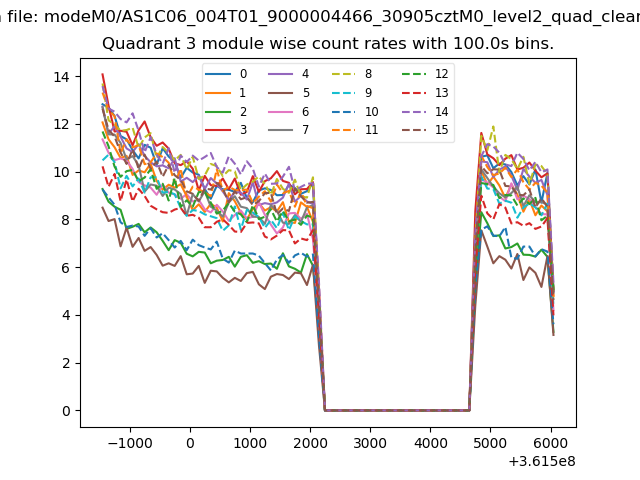
| Module-wise count rates for Quadrant A Data is divided into 100 sec bins |
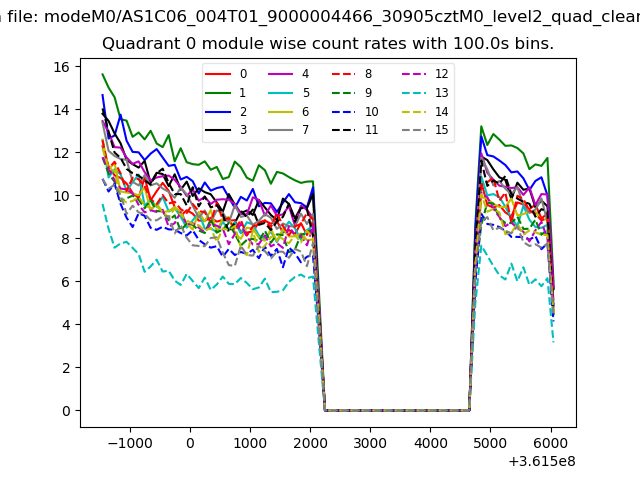 |
 |
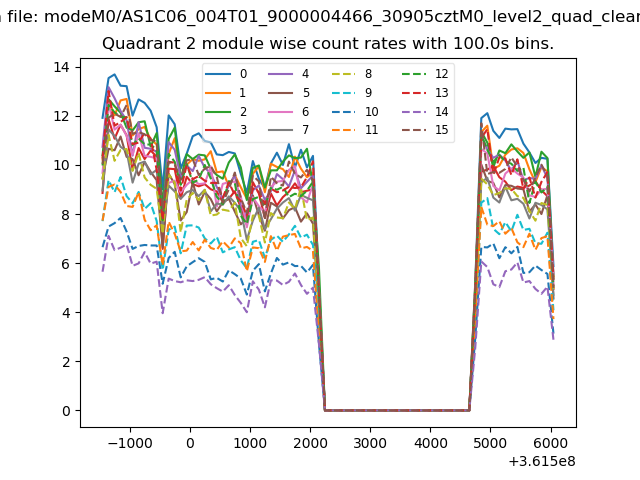
| Module-wise count rates for Quadrant B Data is divided into 100 sec bins |
 |
 |
| Module-wise count rates for Quadrant C Data is divided into 100 sec bins |
 |
 |
| Module-wise count rates for Quadrant D Data is divided into 100 sec bins |
 |
 |
| Parameter | Plot |
|---|---|
| CZT HV Monitor | 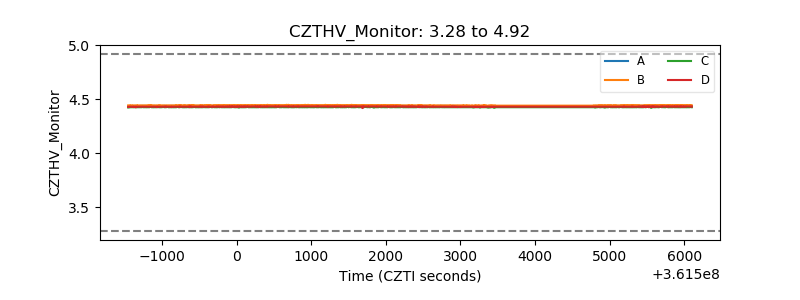 |
| D_VDD | 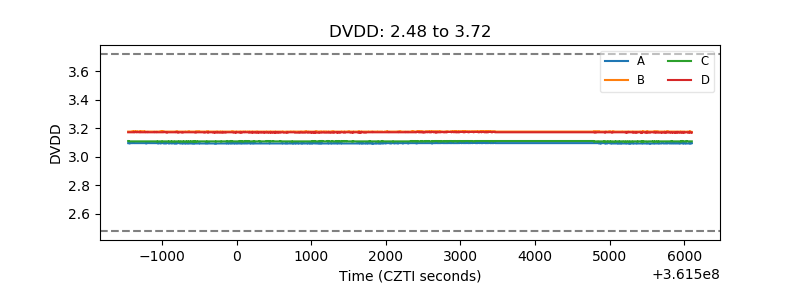 |
| Temperature 1 |  |
| Veto HV Monitor | 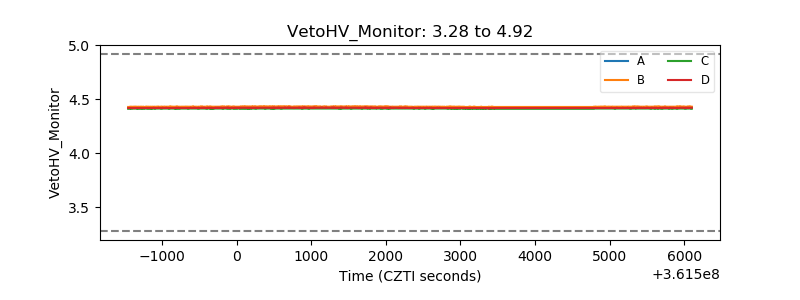 |
| Veto LLD |  |
| Alpha Counter | 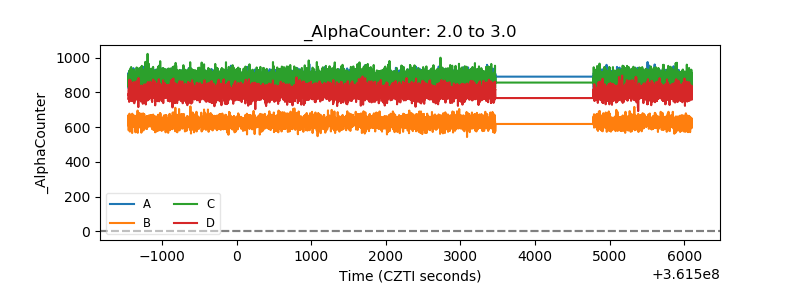 |
| _CPM_Rate | 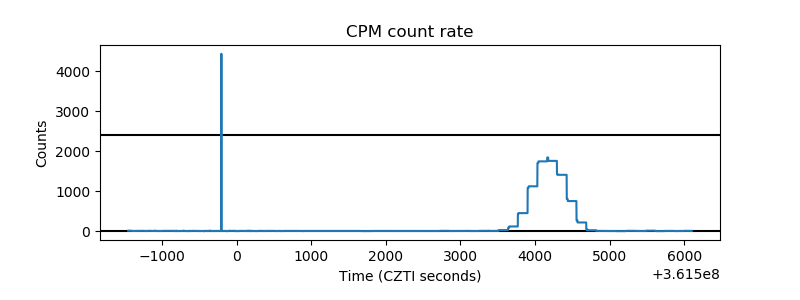 |
| CZT Counter | 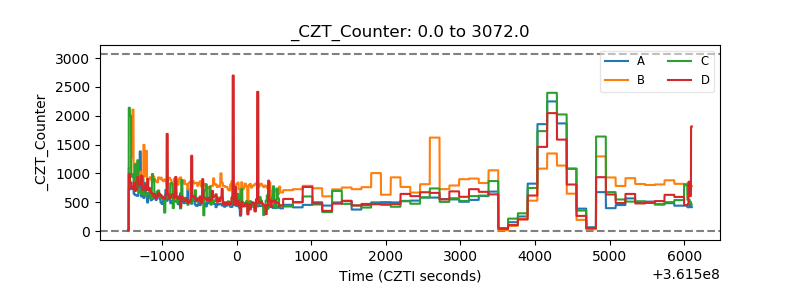 |
| +2.5 Volts monitor |  |
| +5 Volts monitor |  |
| _ROLL_ROT |  |
| _Roll_DEC |  |
| _Roll_RA | 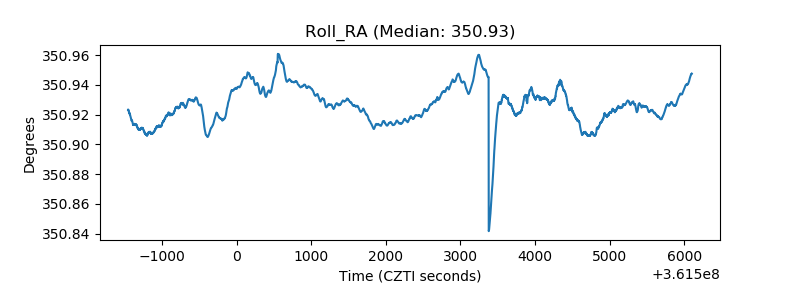 |
| Veto Counter |  |