| Param | Original file | Final file |
|---|---|---|
| Filename | modeM0/AS1C06_004T01_9000004466_30906cztM0_level2.evt | modeM0/AS1C06_004T01_9000004466_30906cztM0_level2_quad_clean.evt |
| Size (bytes) | 614,165,760 | 102,018,240 |
| Size | 585.7 MB | 97.3 MB |
| Events in quadrant A | 3,207,410 | 674,459 |
| Events in quadrant B | 6,197,047 | 675,346 |
| Events in quadrant C | 3,667,232 | 634,286 |
| Events in quadrant D | 5,076,557 | 640,056 |
| Mode M0 | |||
|---|---|---|---|
| Quadrant | BADHDUFLAG | Total packets | Discarded packets |
| A | 0 | 13928 | 2 |
| B | 0 | 22930 | 2 |
| C | 0 | 15218 | 2 |
| D | 0 | 19414 | 2 |
| Mode M9 | |||
|---|---|---|---|
| Quadrant | BADHDUFLAG | Total packets | Discarded packets |
| A | 0 | 14 | 0 |
| B | 0 | 15 | 0 |
| C | 0 | 15 | 0 |
| D | 0 | 15 | 0 |
| Mode SS | |||
|---|---|---|---|
| Quadrant | BADHDUFLAG | Total packets | Discarded packets |
| A | 0 | 136 | 0 |
| B | 0 | 136 | 0 |
| C | 0 | 136 | 0 |
| D | 0 | 136 | 0 |
| Quadrant | Total seconds | Saturated seconds | Saturation percentage |
|---|---|---|---|
| A | 6674 | 26 | 0.389571% |
| B | 6674 | 235 | 3.521127% |
| C | 6674 | 505 | 7.566677% |
| D | 6674 | 515 | 7.716512% |
Noise dominated data is calculated using 1-second bins in cleaned event files. If a bin has >2000 counts, and if more than 50% of those come from <1% of pixels, then it is considered to be noise-dominated and hence unusable.
| Quadrant | # 1 sec bins | Bins with >0 counts | Bins with >2000 counts | High rate bins dominated by noise | Noise dominated (total time) | Noise dominated (detector-on time) | Marked lightcurve |
|---|---|---|---|---|---|---|---|
| A | 7814 | 6675 | 2 | 2 | 0.03% | 0.03% | 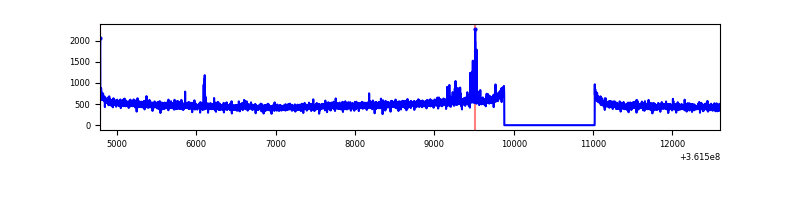 |
| B | 7814 | 6674 | 108 | 108 | 1.38% | 1.62% | 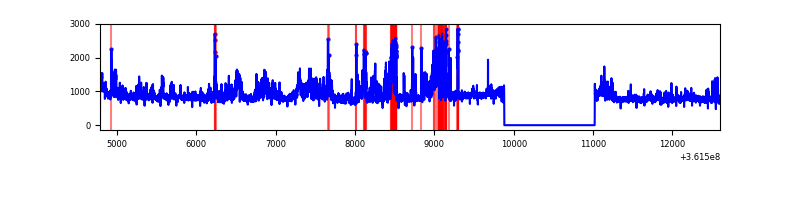 |
| C | 7814 | 6675 | 34 | 34 | 0.44% | 0.51% | 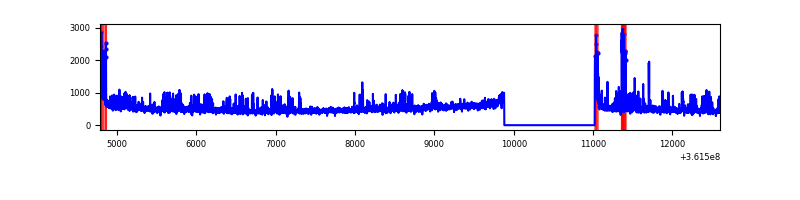 |
| D | 7814 | 6674 | 413 | 413 | 5.29% | 6.19% | 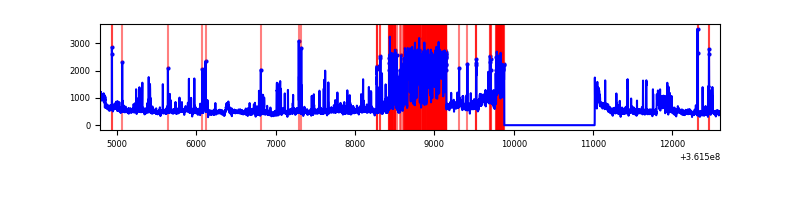 |
Top three noisy pixels from each quadrant. If the there are fewer than three noisy pixels in the level2.evt file, extra rows are filled as -1
| Pixel properties | Quadrant properties | ||||||
|---|---|---|---|---|---|---|---|
| Quadrant | DetID | PixID | Counts | Sigma | Mean | Median | Sigma |
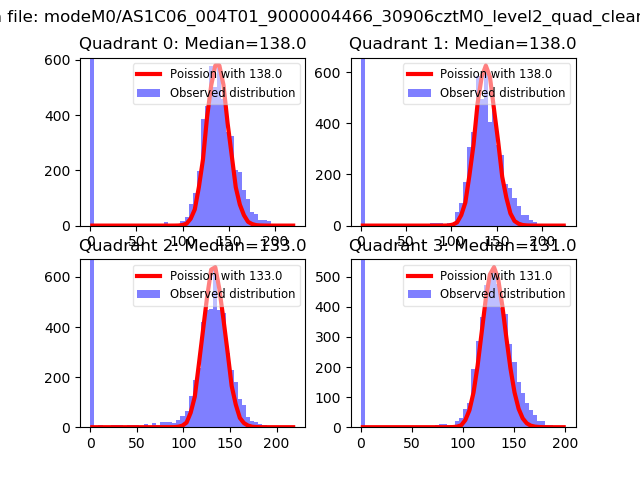
| A | 0 | 13 | 55049 | 333.83 | 816 | 802 | 162.5 |
| A | 13 | 254 | 12034 | 69.12 | 816 | 802 | 162.5 |
| A | 3 | 137 | 7780 | 42.94 | 816 | 802 | 162.5 |
| B | 6 | 159 | 1963058 | 12914.38 | 812 | 792 | 151.9 |
| B | 6 | 36 | 680993 | 4476.65 | 812 | 792 | 151.9 |
| B | 0 | 190 | 148246 | 970.45 | 812 | 792 | 151.9 |
| C | 14 | 238 | 247522 | 1397.26 | 764 | 770 | 176.6 |
| C | 0 | 10 | 177028 | 998.08 | 764 | 770 | 176.6 |
| C | 14 | 254 | 170940 | 963.61 | 764 | 770 | 176.6 |
| D | 2 | 250 | 1065810 | 5968.36 | 760 | 741 | 178.5 |
| D | 8 | 195 | 704858 | 3945.68 | 760 | 741 | 178.5 |
| D | 12 | 218 | 130618 | 727.8 | 760 | 741 | 178.5 |
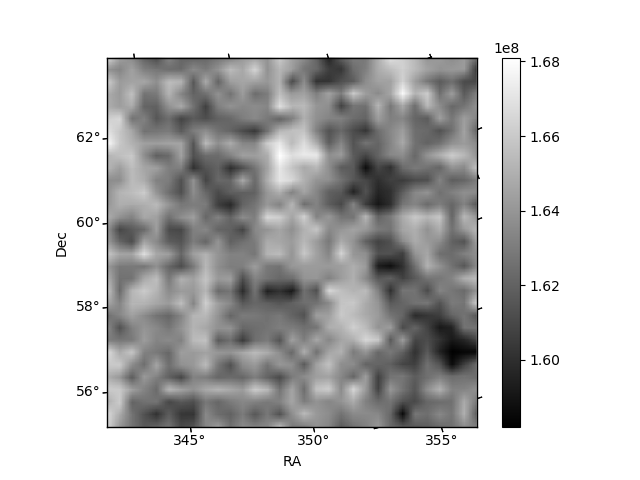
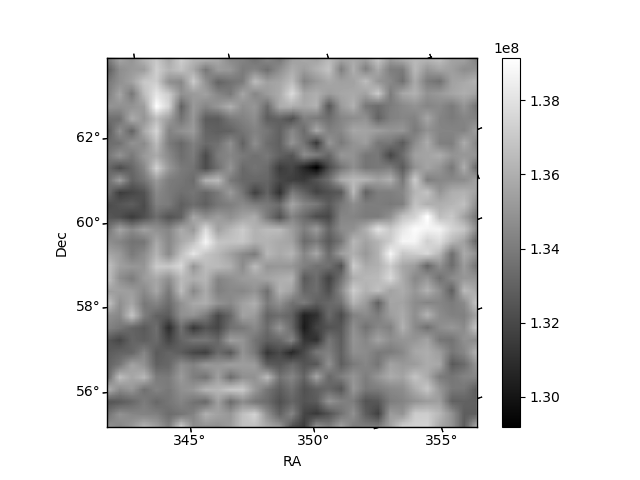
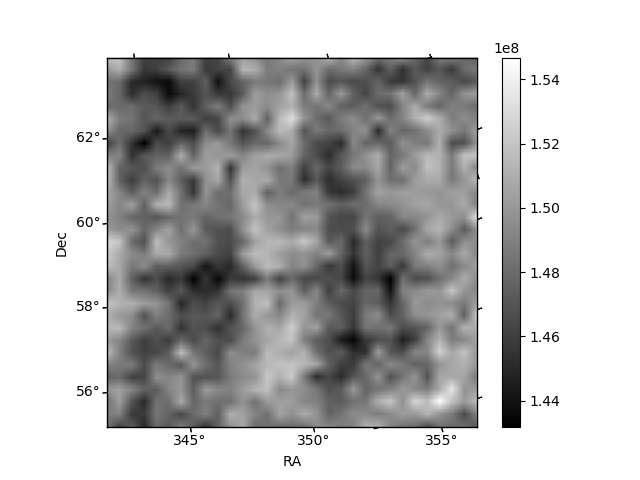
Histogram calculated using DETX and DETY for each event in the final _common_clean file
| Quadrant A | 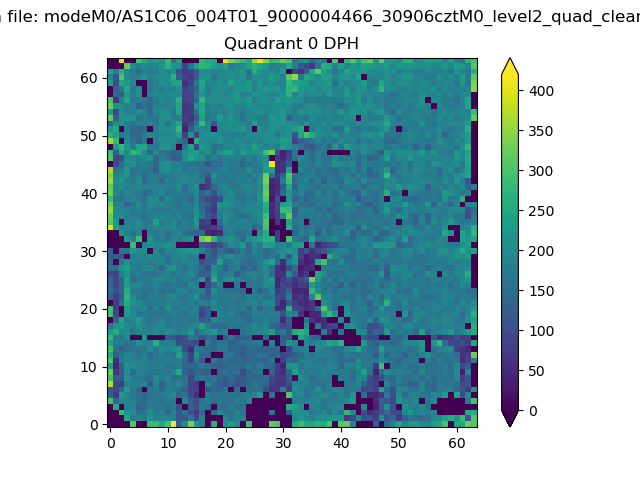 |
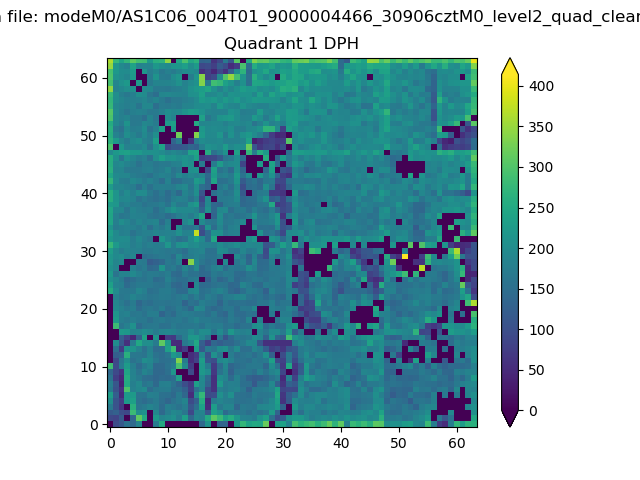 |
Quadrant B |
|---|---|---|---|
| Quadrant D | 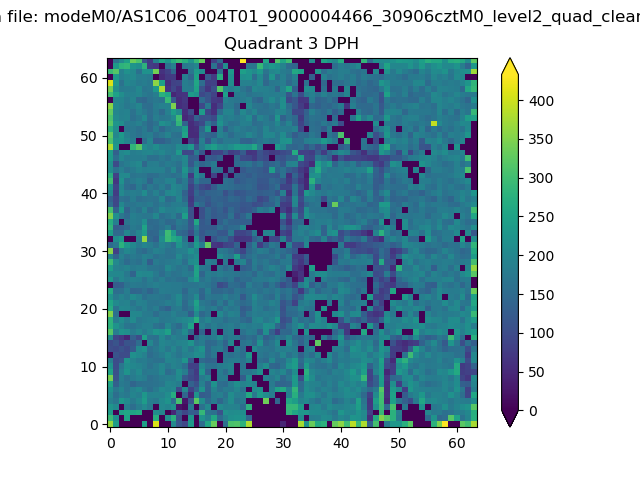 |
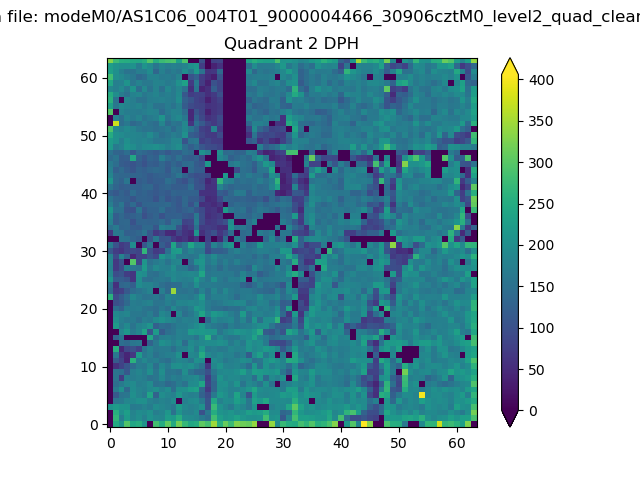 |
Quadrant C |
| Plot type | Count rate plots | Images |
|---|---|---|
| Comparison with Poisson distribution Blue bars denote a histogram of data divided into 1 sec bins. Red curve is a Poisson curve with rate = median count rate of data. |
 |
 |
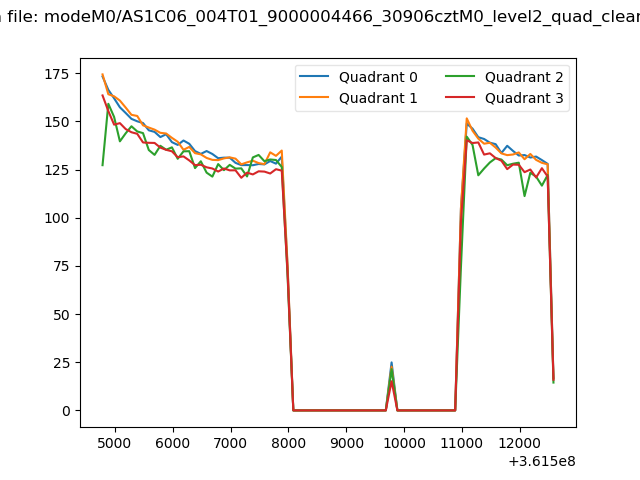
| Quadrant-wise count rates Data is divided into 100 sec bins |
 |
|
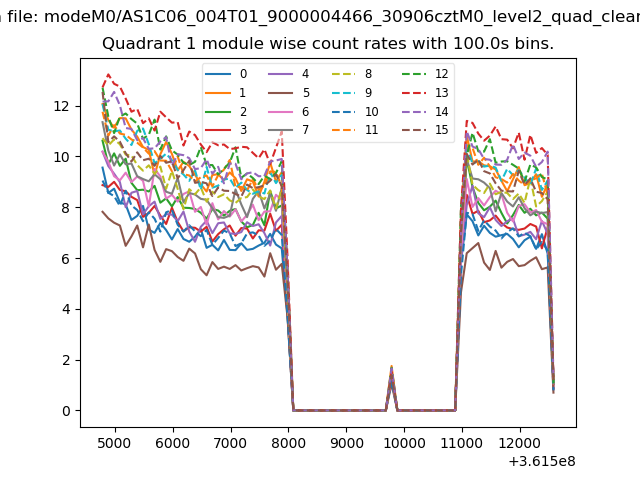
| Module-wise count rates for Quadrant A Data is divided into 100 sec bins |
 |
 |
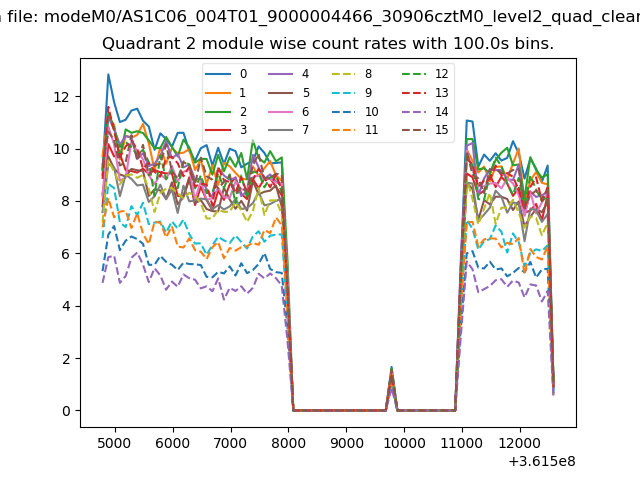
| Module-wise count rates for Quadrant B Data is divided into 100 sec bins |
 |
 |
| Module-wise count rates for Quadrant C Data is divided into 100 sec bins |
 |
 |
| Module-wise count rates for Quadrant D Data is divided into 100 sec bins |
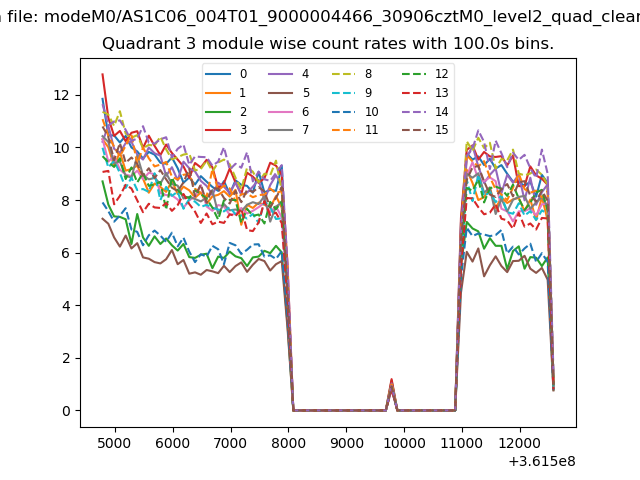 |
 |
| Parameter | Plot |
|---|---|
| CZT HV Monitor | 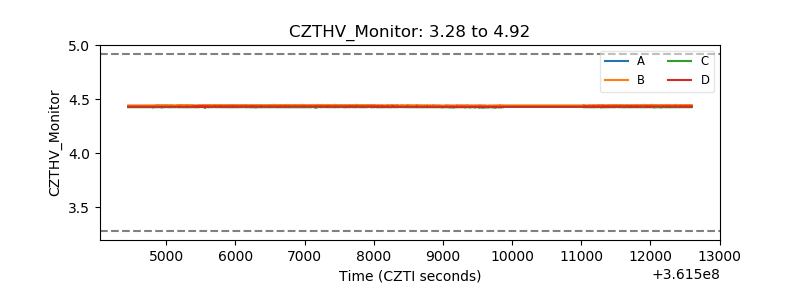 |
| D_VDD | 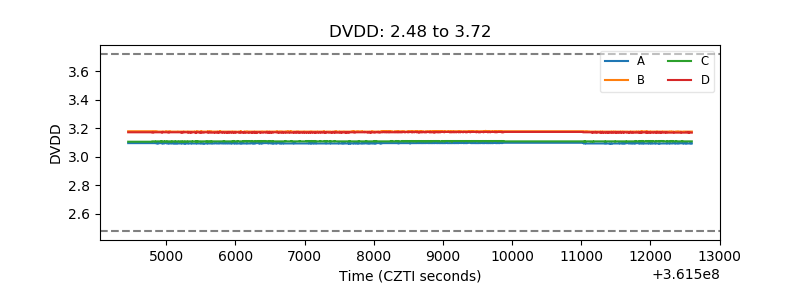 |
| Temperature 1 |  |
| Veto HV Monitor | 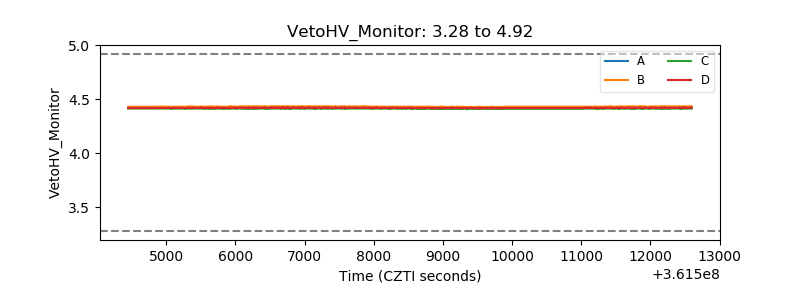 |
| Veto LLD | 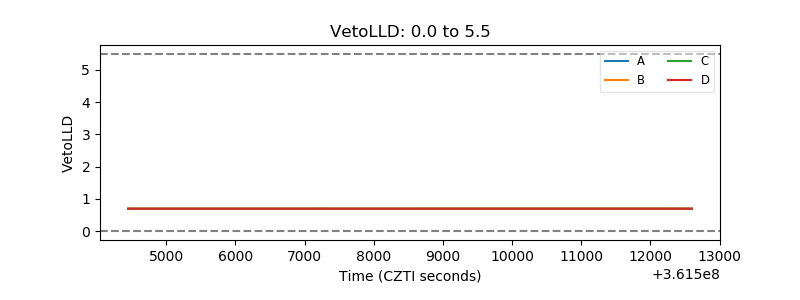 |
| Alpha Counter | 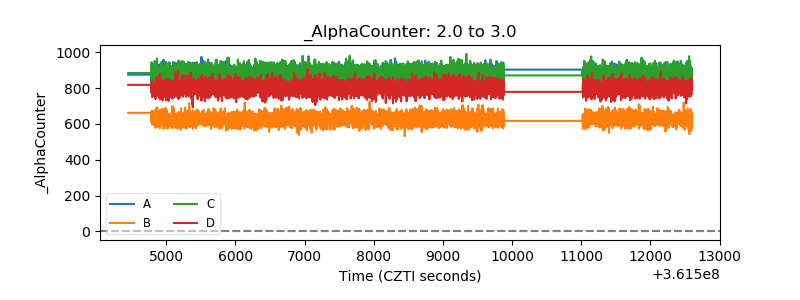 |
| _CPM_Rate | 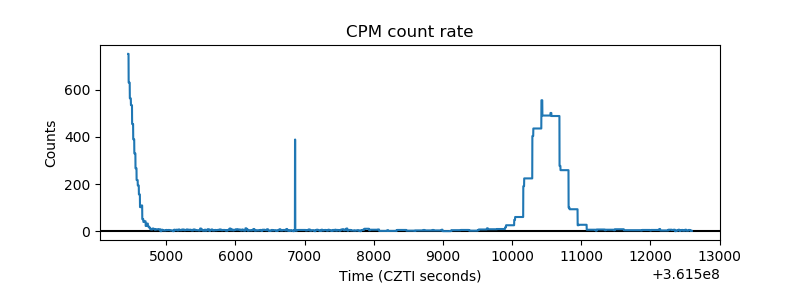 |
| CZT Counter | 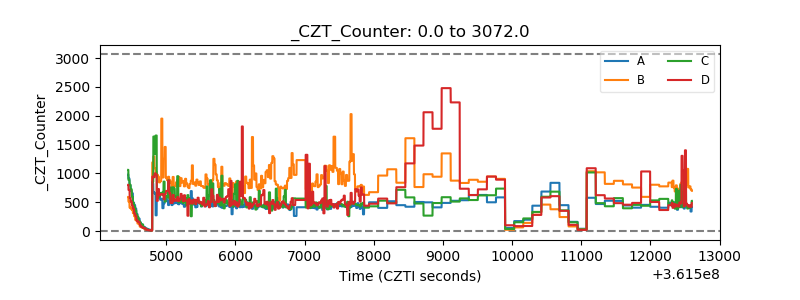 |
| +2.5 Volts monitor |  |
| +5 Volts monitor |  |
| _ROLL_ROT |  |
| _Roll_DEC | 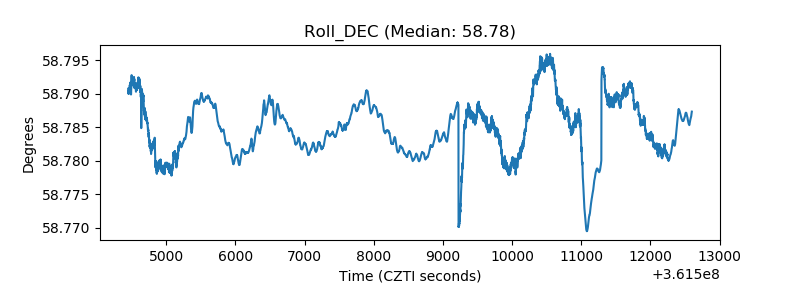 |
| _Roll_RA | 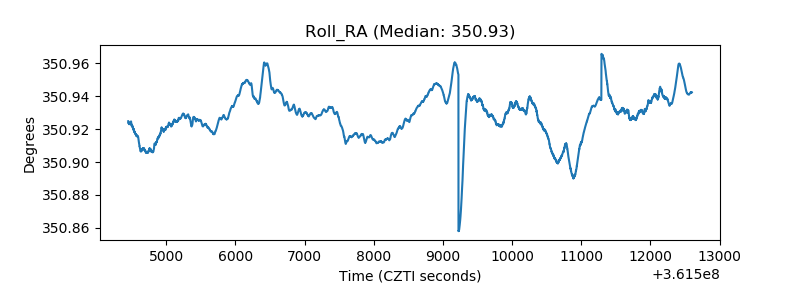 |
| Veto Counter |  |