| Param | Original file | Final file |
|---|---|---|
| Filename | modeM0/AS1C06_004T01_9000004466_30908cztM0_level2.evt | modeM0/AS1C06_004T01_9000004466_30908cztM0_level2_quad_clean.evt |
| Size (bytes) | 974,557,440 | 150,183,360 |
| Size | 929.4 MB | 143.2 MB |
| Events in quadrant A | 5,452,409 | 981,206 |
| Events in quadrant B | 9,223,433 | 963,956 |
| Events in quadrant C | 5,946,356 | 901,659 |
| Events in quadrant D | 8,140,586 | 930,794 |
| Mode M0 | |||
|---|---|---|---|
| Quadrant | BADHDUFLAG | Total packets | Discarded packets |
| A | 0 | 24699 | 1210 |
| B | 0 | 37384 | 2057 |
| C | 0 | 26132 | 1332 |
| D | 0 | 33477 | 1558 |
| Mode M9 | |||
|---|---|---|---|
| Quadrant | BADHDUFLAG | Total packets | Discarded packets |
| A | 0 | 10 | 1 |
| B | 0 | 9 | 0 |
| C | 0 | 11 | 2 |
| D | 0 | 9 | 0 |
| Mode SS | |||
|---|---|---|---|
| Quadrant | BADHDUFLAG | Total packets | Discarded packets |
| A | 0 | 240 | 8 |
| B | 0 | 242 | 12 |
| C | 0 | 241 | 9 |
| D | 0 | 240 | 14 |
| Quadrant | Total seconds | Saturated seconds | Saturation percentage |
|---|---|---|---|
| A | 11150 | 194 | 1.739910% |
| B | 11066 | 397 | 3.587566% |
| C | 11127 | 1139 | 10.236362% |
| D | 11104 | 631 | 5.682637% |
Noise dominated data is calculated using 1-second bins in cleaned event files. If a bin has >2000 counts, and if more than 50% of those come from <1% of pixels, then it is considered to be noise-dominated and hence unusable.
| Quadrant | # 1 sec bins | Bins with >0 counts | Bins with >2000 counts | High rate bins dominated by noise | Noise dominated (total time) | Noise dominated (detector-on time) | Marked lightcurve |
|---|---|---|---|---|---|---|---|
| A | 12657 | 11277 | 12 | 12 | 0.09% | 0.11% | 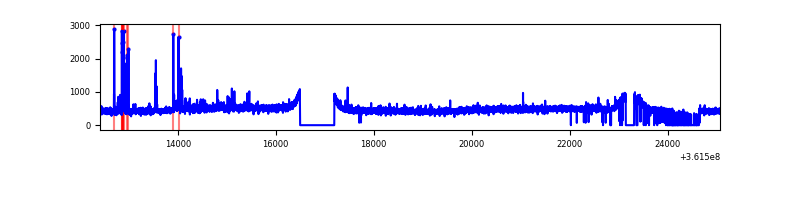 |
| B | 12657 | 11178 | 10 | 10 | 0.08% | 0.09% | 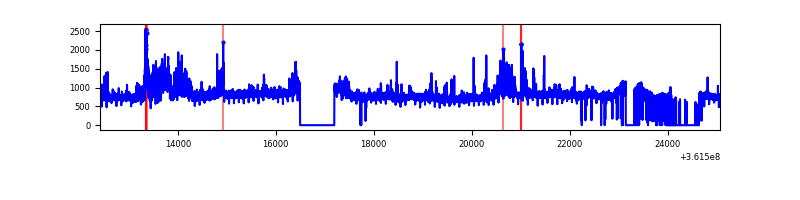 |
| C | 12657 | 11258 | 12 | 12 | 0.09% | 0.11% | 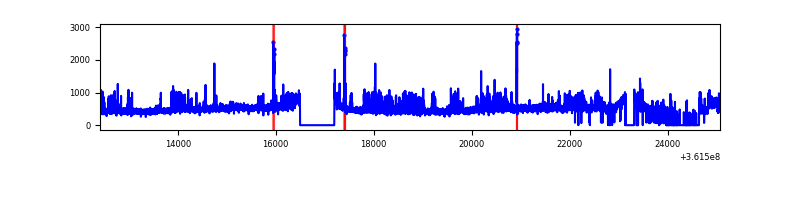 |
| D | 12657 | 11225 | 414 | 414 | 3.27% | 3.69% | 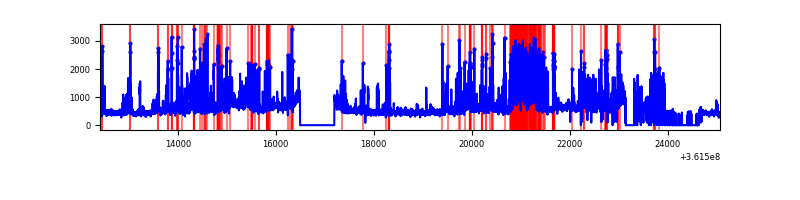 |
Top three noisy pixels from each quadrant. If the there are fewer than three noisy pixels in the level2.evt file, extra rows are filled as -1
| Pixel properties | Quadrant properties | ||||||
|---|---|---|---|---|---|---|---|
| Quadrant | DetID | PixID | Counts | Sigma | Mean | Median | Sigma |
| A | 0 | 13 | 183825 | 665.95 | 1364 | 1334 | 274.0 |
| A | 13 | 254 | 20559 | 70.16 | 1364 | 1334 | 274.0 |
| A | 3 | 137 | 13655 | 44.96 | 1364 | 1334 | 274.0 |
| B | 6 | 159 | 3114591 | 12280.6 | 1333 | 1302 | 253.5 |
| B | 6 | 36 | 385609 | 1515.93 | 1333 | 1302 | 253.5 |
| B | 0 | 190 | 329218 | 1293.49 | 1333 | 1302 | 253.5 |
| C | 14 | 238 | 476677 | 1649.96 | 1242 | 1247 | 288.1 |
| C | 14 | 254 | 380896 | 1317.55 | 1242 | 1247 | 288.1 |
| C | 3 | 233 | 108002 | 370.49 | 1242 | 1247 | 288.1 |
| D | 8 | 195 | 1339104 | 4443.49 | 1285 | 1254 | 301.1 |
| D | 12 | 218 | 774484 | 2568.18 | 1285 | 1254 | 301.1 |
| D | 2 | 250 | 447275 | 1481.4 | 1285 | 1254 | 301.1 |
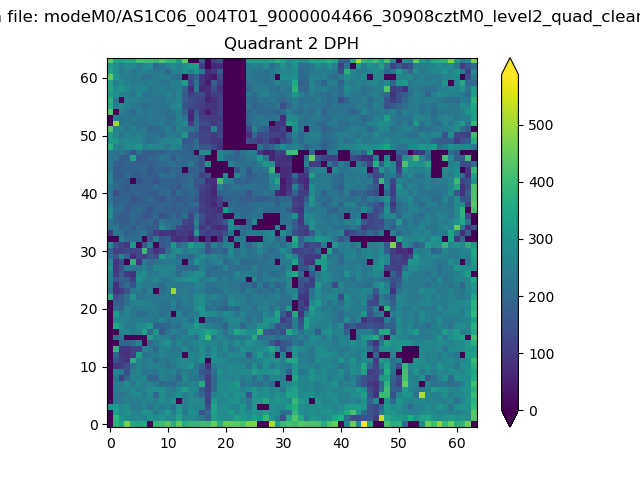
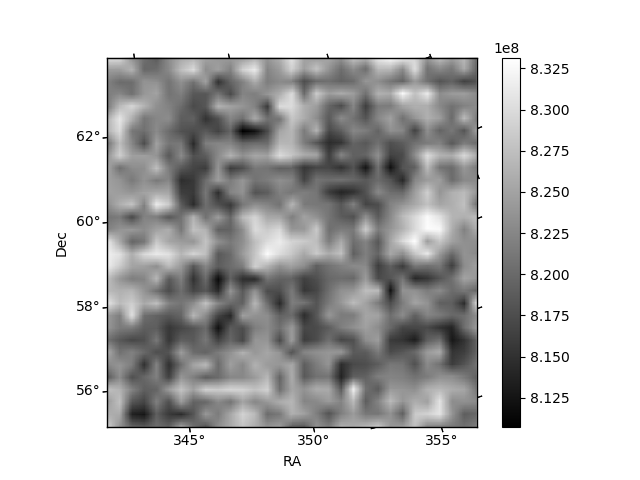
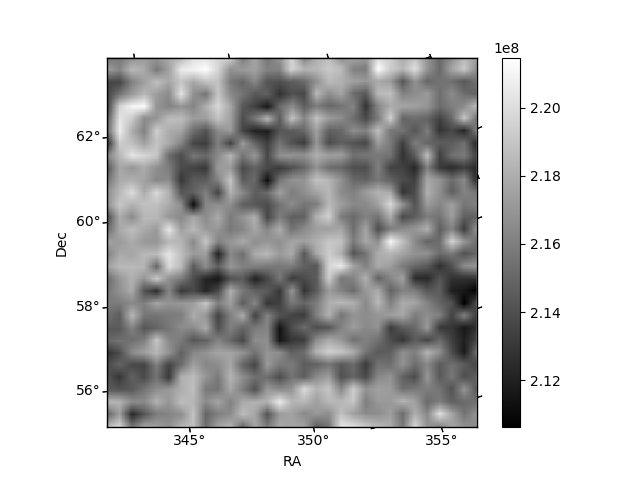
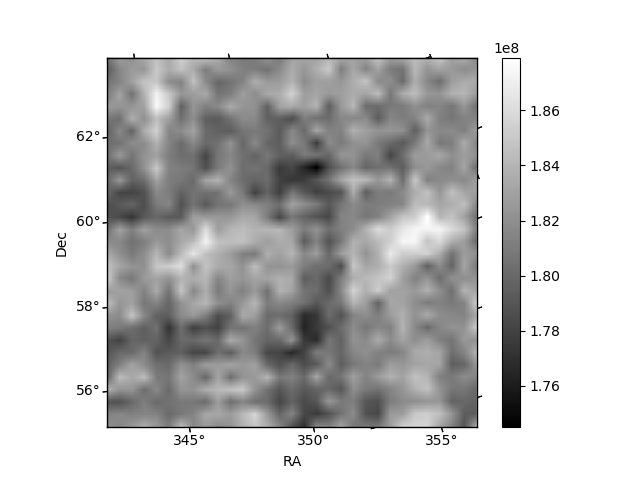
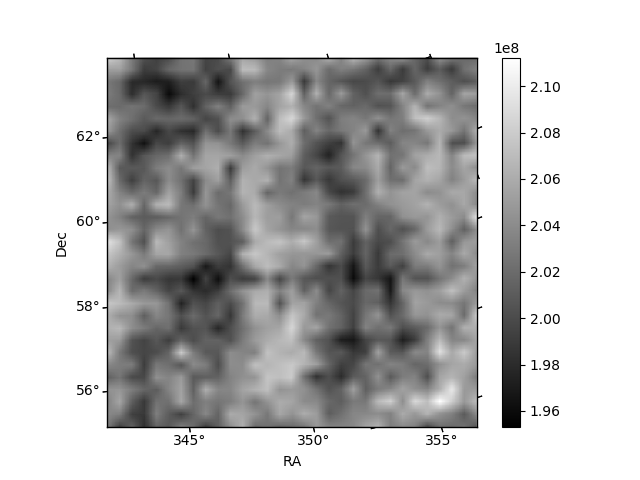
Histogram calculated using DETX and DETY for each event in the final _common_clean file
| Quadrant A | 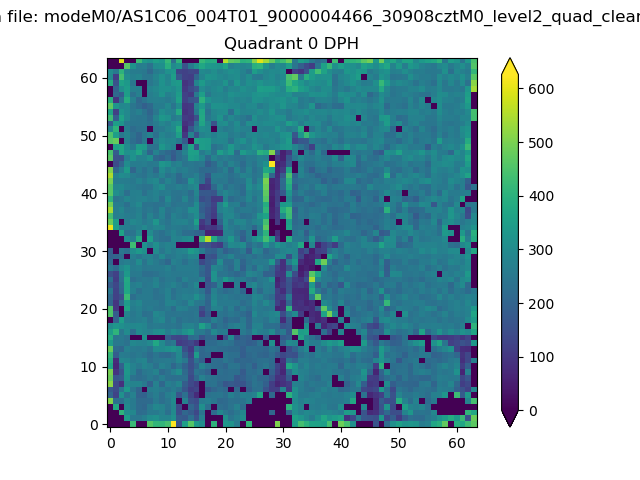 |
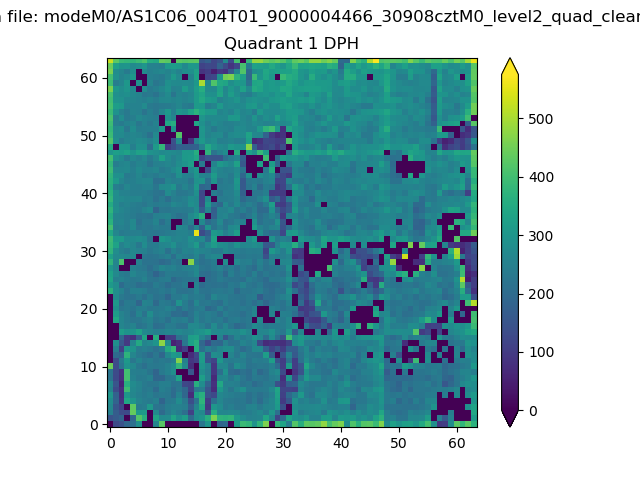 |
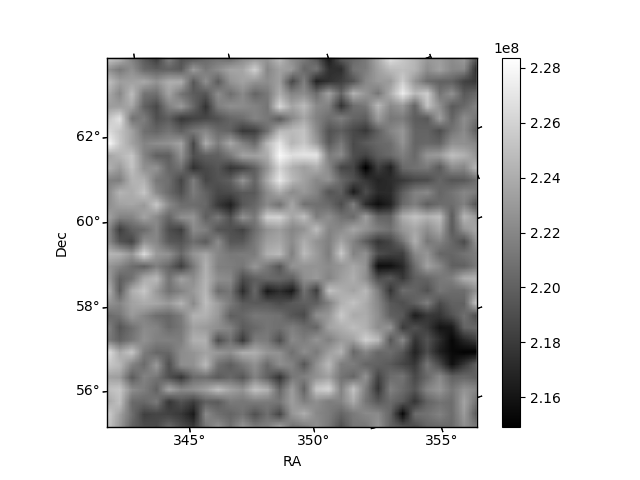
Quadrant B |
|---|---|---|---|
| Quadrant D | 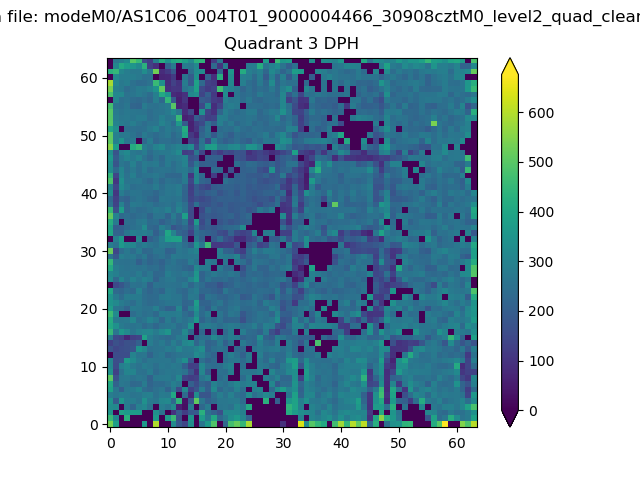 |
 |
Quadrant C |
| Plot type | Count rate plots | Images |
|---|---|---|
| Comparison with Poisson distribution Blue bars denote a histogram of data divided into 1 sec bins. Red curve is a Poisson curve with rate = median count rate of data. |
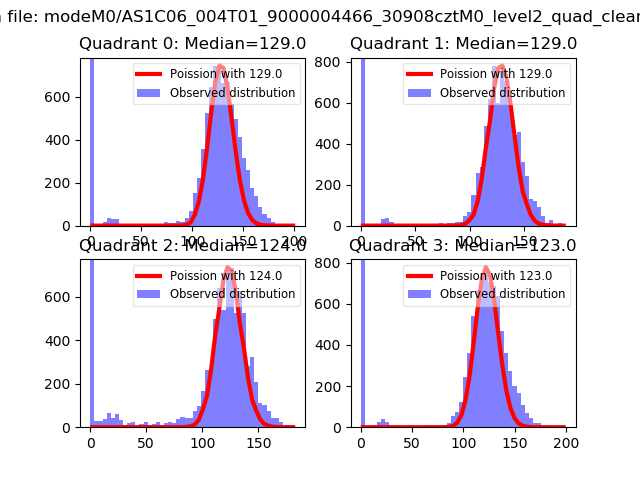 |
 |
| Quadrant-wise count rates Data is divided into 100 sec bins |
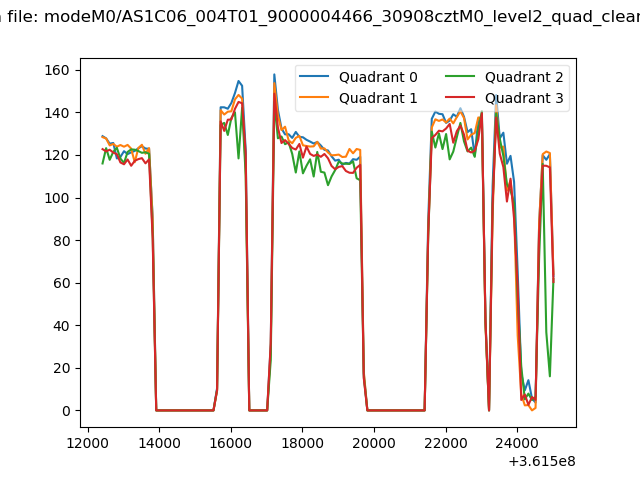 |
|
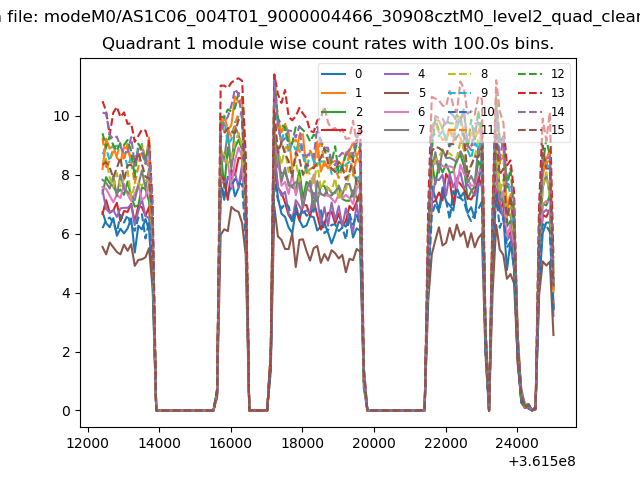
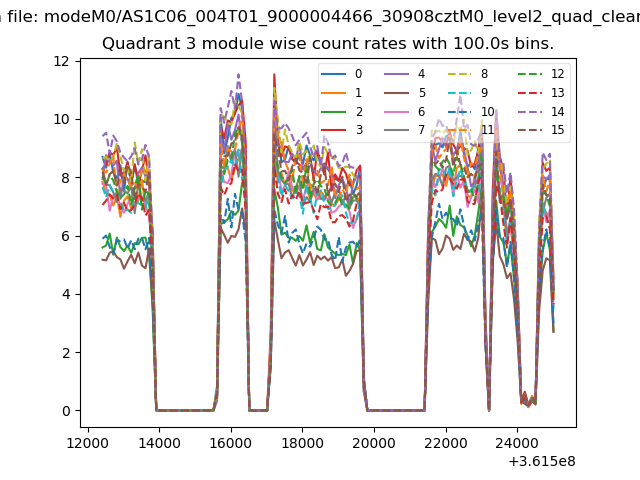
| Module-wise count rates for Quadrant A Data is divided into 100 sec bins |
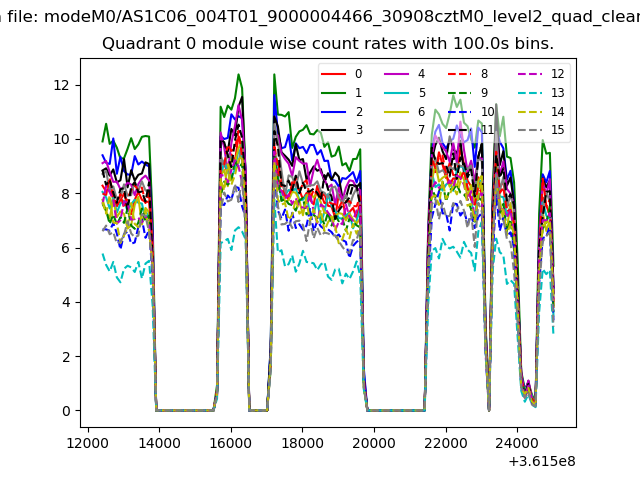 |
 |
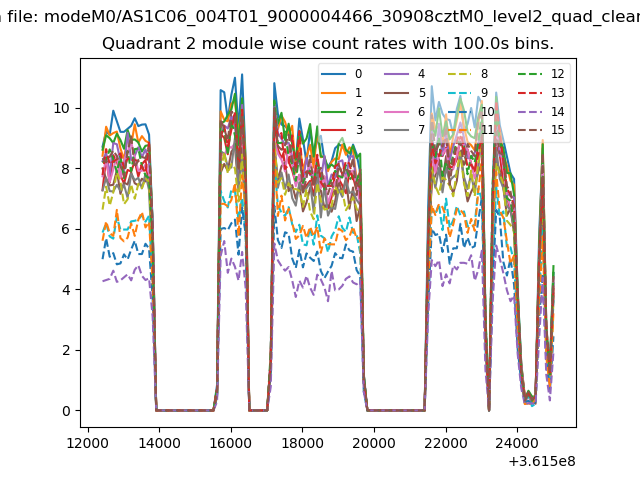
| Module-wise count rates for Quadrant B Data is divided into 100 sec bins |
 |
 |
| Module-wise count rates for Quadrant C Data is divided into 100 sec bins |
 |
 |
| Module-wise count rates for Quadrant D Data is divided into 100 sec bins |
 |
 |
| Parameter | Plot |
|---|---|
| CZT HV Monitor | 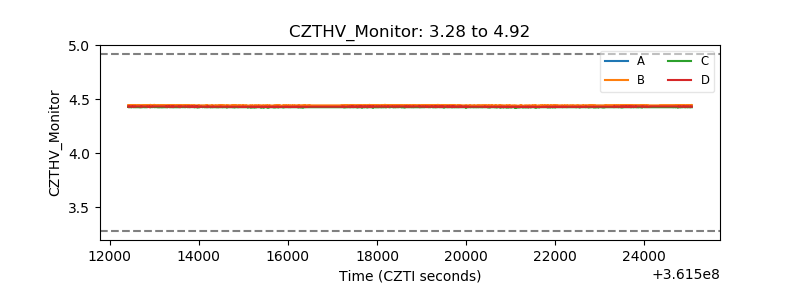 |
| D_VDD | 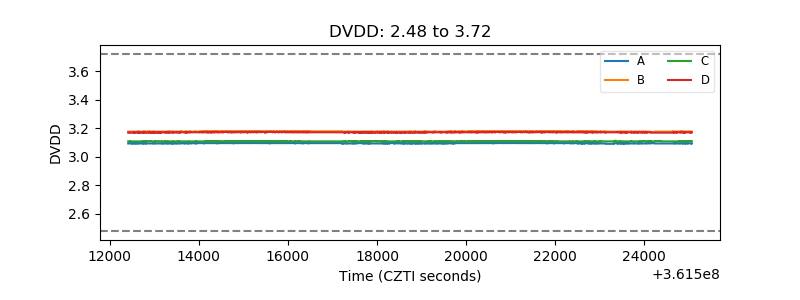 |
| Temperature 1 | 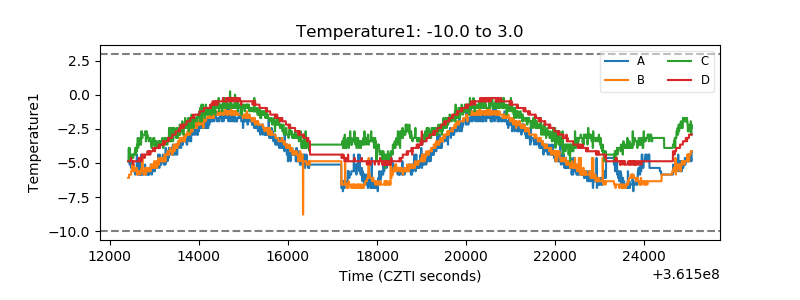 |
| Veto HV Monitor |  |
| Veto LLD | 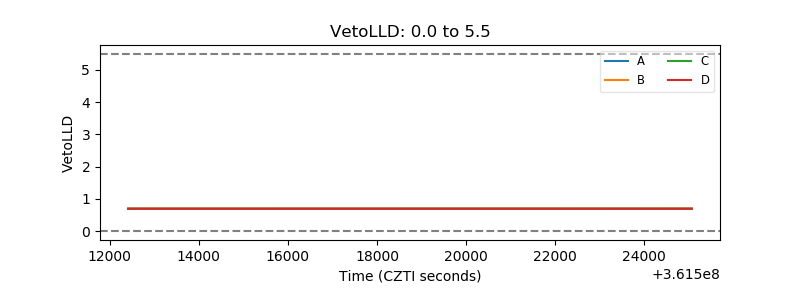 |
| Alpha Counter | 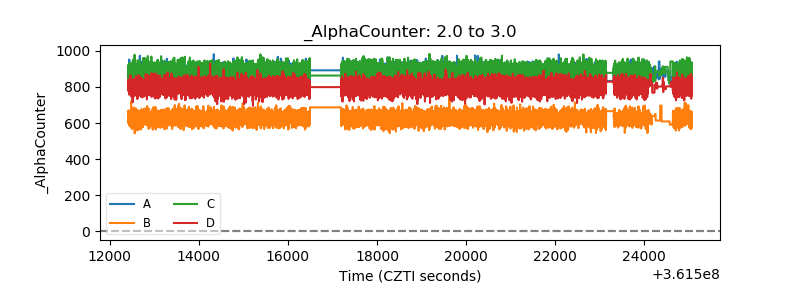 |
| _CPM_Rate | 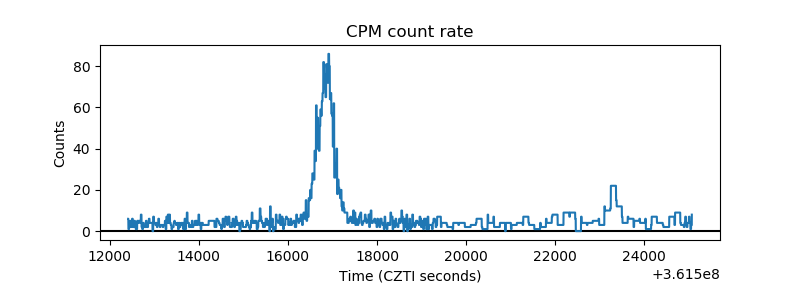 |
| CZT Counter | 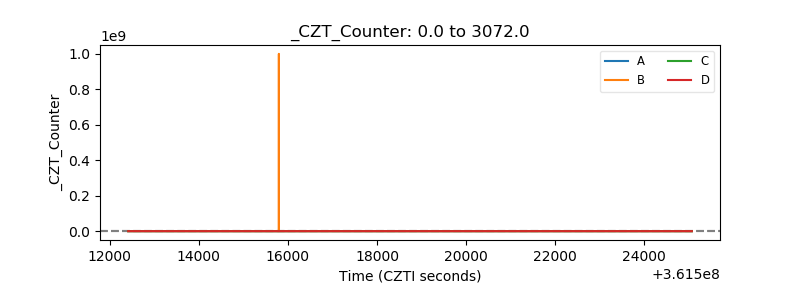 |
| +2.5 Volts monitor |  |
| +5 Volts monitor |  |
| _ROLL_ROT | 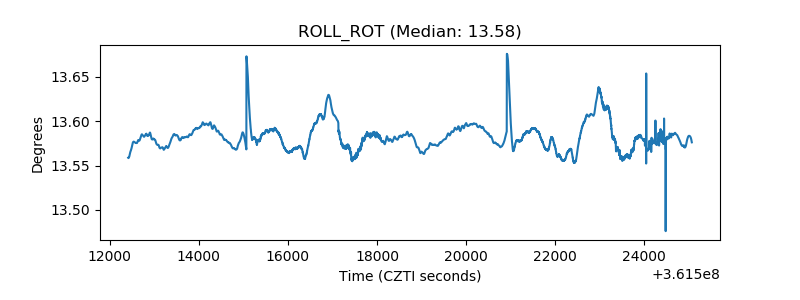 |
| _Roll_DEC | 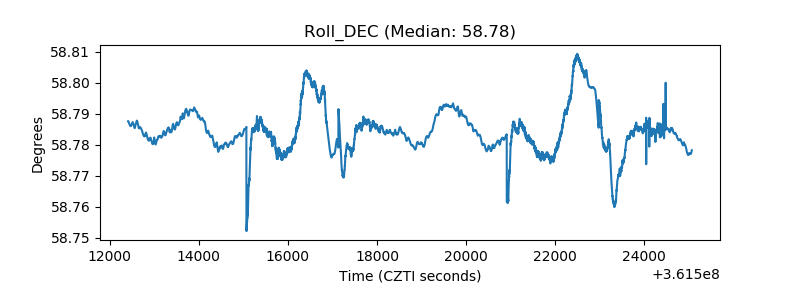 |
| _Roll_RA | 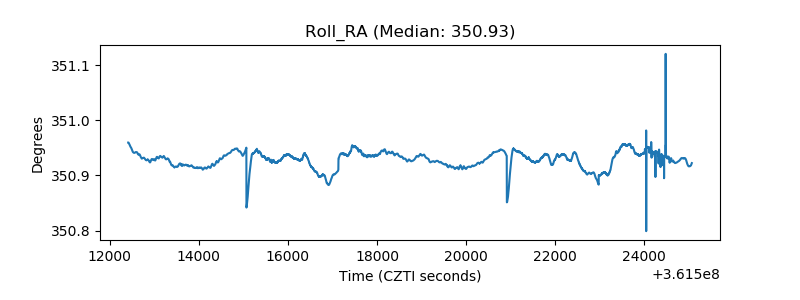 |
| Veto Counter | 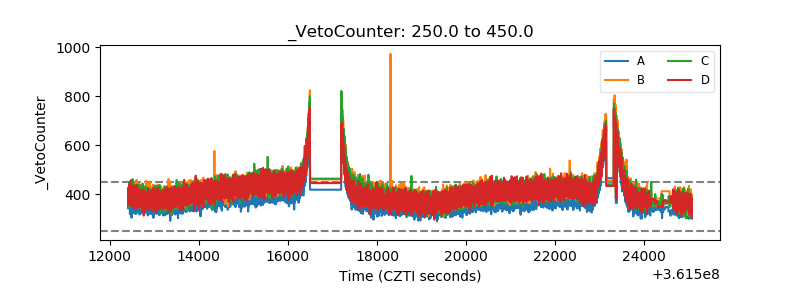 |