| Param | Original file | Final file |
|---|---|---|
| Filename | modeM0/AS1C06_004T01_9000004466_30909cztM0_level2.evt | modeM0/AS1C06_004T01_9000004466_30909cztM0_level2_quad_clean.evt |
| Size (bytes) | 1,336,446,720 | 198,532,800 |
| Size | 1.2 GB | 189.3 MB |
| Events in quadrant A | 7,466,340 | 1,278,905 |
| Events in quadrant B | 12,611,235 | 1,271,423 |
| Events in quadrant C | 8,017,638 | 1,189,314 |
| Events in quadrant D | 11,346,693 | 1,216,283 |
| Mode M0 | |||
|---|---|---|---|
| Quadrant | BADHDUFLAG | Total packets | Discarded packets |
| A | 0 | 32216 | 3 |
| B | 0 | 48643 | 3 |
| C | 0 | 33546 | 3 |
| D | 0 | 44346 | 3 |
| Mode M9 | |||
|---|---|---|---|
| Quadrant | BADHDUFLAG | Total packets | Discarded packets |
| A | 0 | 9 | 0 |
| B | 0 | 9 | 0 |
| C | 0 | 9 | 0 |
| D | 0 | 9 | 0 |
| Mode SS | |||
|---|---|---|---|
| Quadrant | BADHDUFLAG | Total packets | Discarded packets |
| A | 0 | 310 | 0 |
| B | 0 | 310 | 0 |
| C | 0 | 310 | 0 |
| D | 0 | 310 | 0 |
| Quadrant | Total seconds | Saturated seconds | Saturation percentage |
|---|---|---|---|
| A | 15309 | 234 | 1.528513% |
| B | 15310 | 440 | 2.873939% |
| C | 15310 | 1292 | 8.438929% |
| D | 15310 | 836 | 5.460483% |
Noise dominated data is calculated using 1-second bins in cleaned event files. If a bin has >2000 counts, and if more than 50% of those come from <1% of pixels, then it is considered to be noise-dominated and hence unusable.
| Quadrant | # 1 sec bins | Bins with >0 counts | Bins with >2000 counts | High rate bins dominated by noise | Noise dominated (total time) | Noise dominated (detector-on time) | Marked lightcurve |
|---|---|---|---|---|---|---|---|
| A | 16204 | 15311 | 39 | 39 | 0.24% | 0.25% | 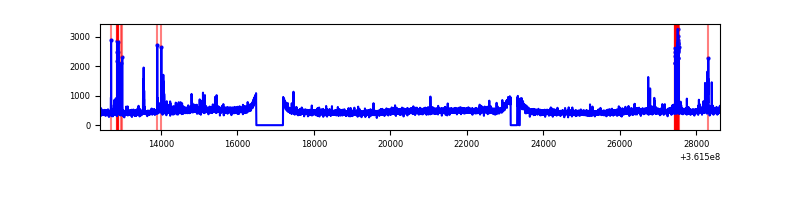 |
| B | 16205 | 15310 | 18 | 18 | 0.11% | 0.12% | 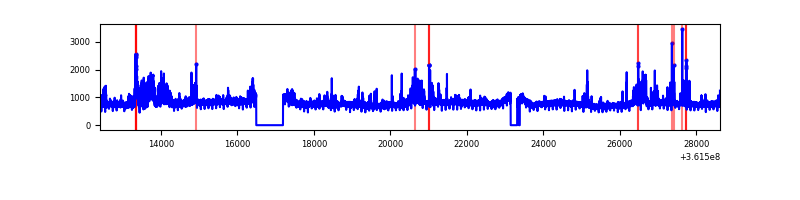 |
| C | 16205 | 15312 | 12 | 12 | 0.07% | 0.08% | 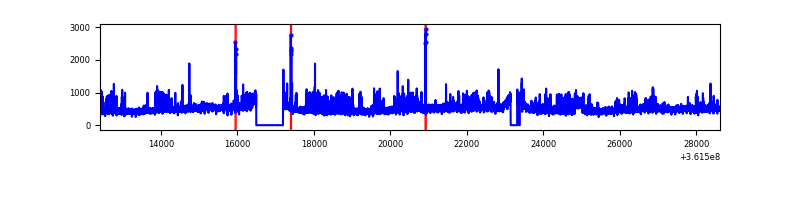 |
| D | 16205 | 15312 | 603 | 603 | 3.72% | 3.94% | 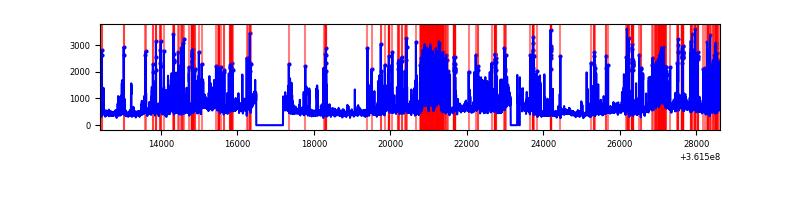 |
Top three noisy pixels from each quadrant. If the there are fewer than three noisy pixels in the level2.evt file, extra rows are filled as -1
| Pixel properties | Quadrant properties | ||||||
|---|---|---|---|---|---|---|---|
| Quadrant | DetID | PixID | Counts | Sigma | Mean | Median | Sigma |
| A | 0 | 13 | 324060 | 870.2 | 1849 | 1809 | 370.3 |
| A | 13 | 254 | 28643 | 72.46 | 1849 | 1809 | 370.3 |
| A | 3 | 137 | 18240 | 44.37 | 1849 | 1809 | 370.3 |
| B | 6 | 159 | 4302893 | 12489.63 | 1823 | 1777 | 344.4 |
| B | 0 | 190 | 467655 | 1352.82 | 1823 | 1777 | 344.4 |
| B | 6 | 36 | 394183 | 1139.47 | 1823 | 1777 | 344.4 |
| C | 14 | 238 | 605833 | 1538.54 | 1703 | 1709 | 392.7 |
| C | 14 | 254 | 457592 | 1161.01 | 1703 | 1709 | 392.7 |
| C | 3 | 233 | 157448 | 396.62 | 1703 | 1709 | 392.7 |
| D | 8 | 195 | 1915312 | 4649.25 | 1753 | 1712 | 411.6 |
| D | 12 | 218 | 1094188 | 2654.26 | 1753 | 1712 | 411.6 |
| D | 2 | 250 | 553357 | 1340.27 | 1753 | 1712 | 411.6 |
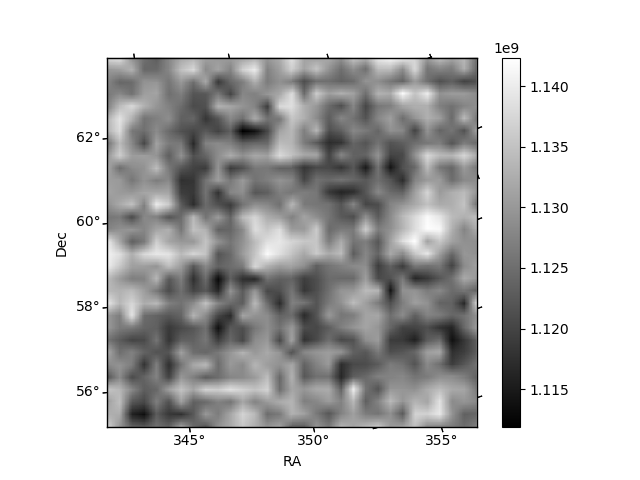
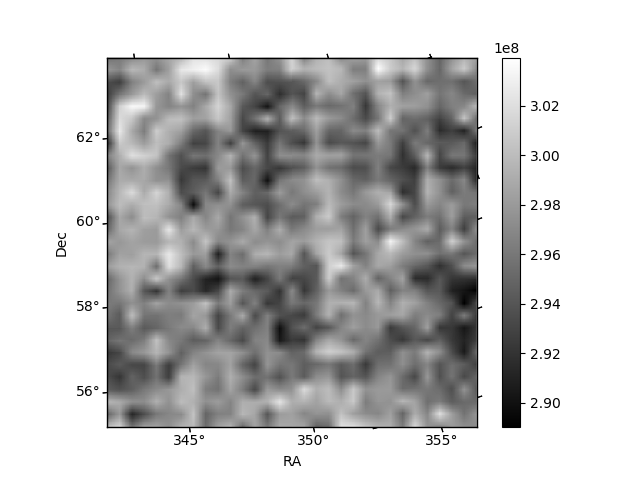
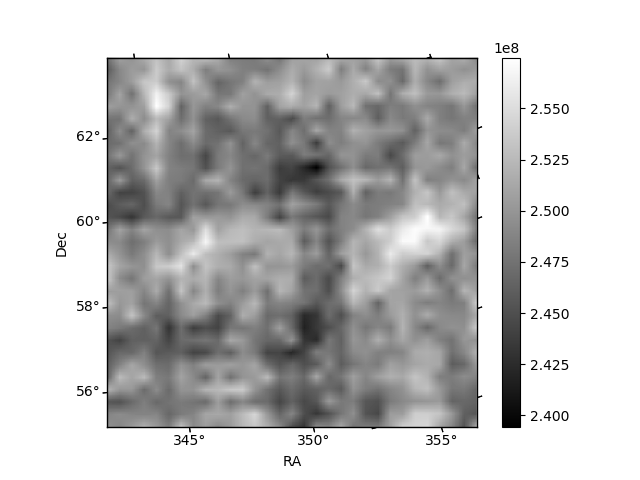
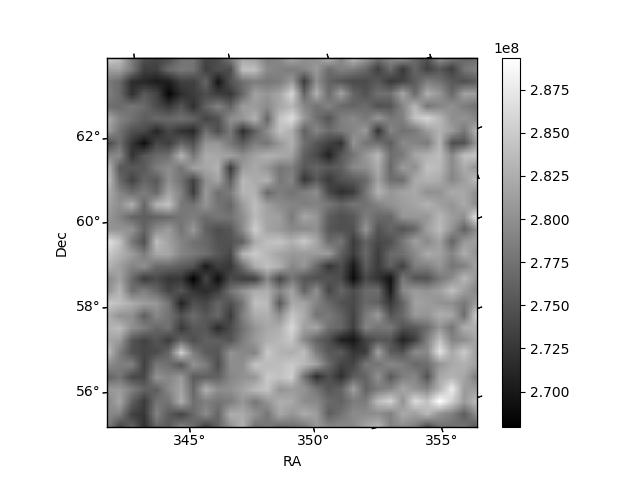
Histogram calculated using DETX and DETY for each event in the final _common_clean file
| Quadrant A | 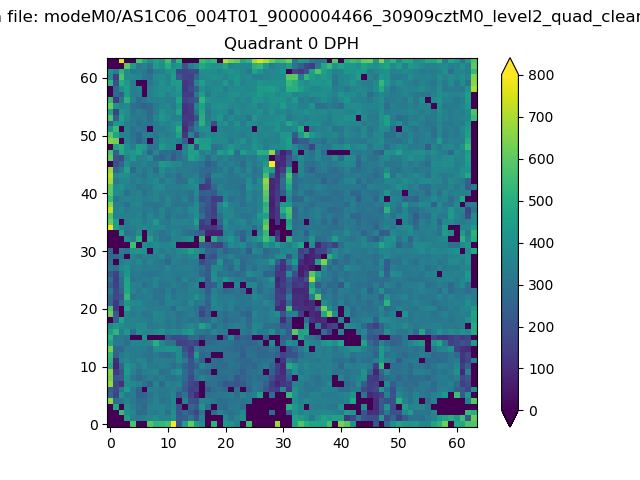 |
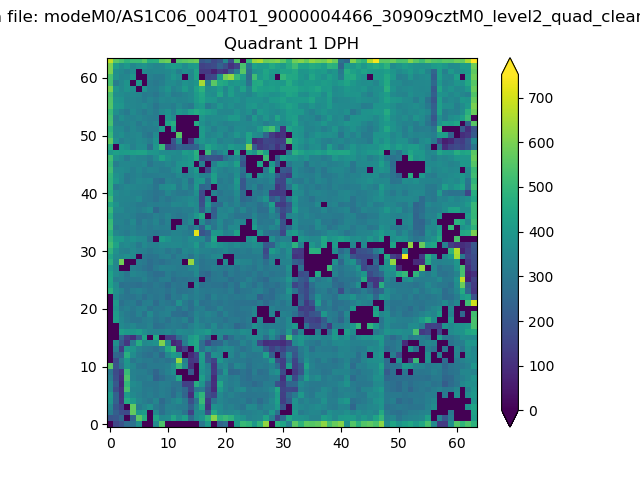 |
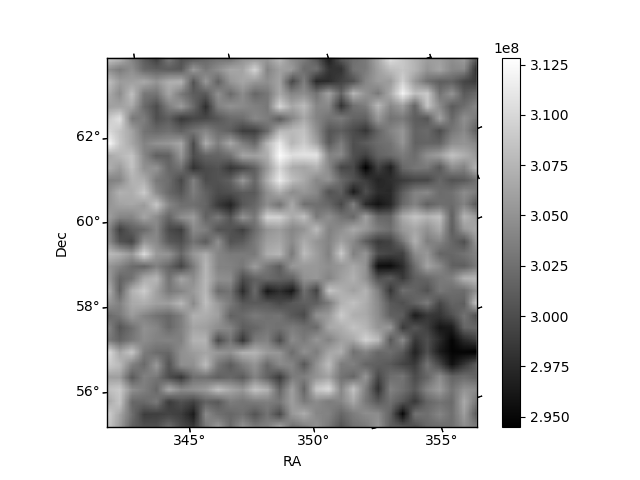
Quadrant B |
|---|---|---|---|
| Quadrant D | 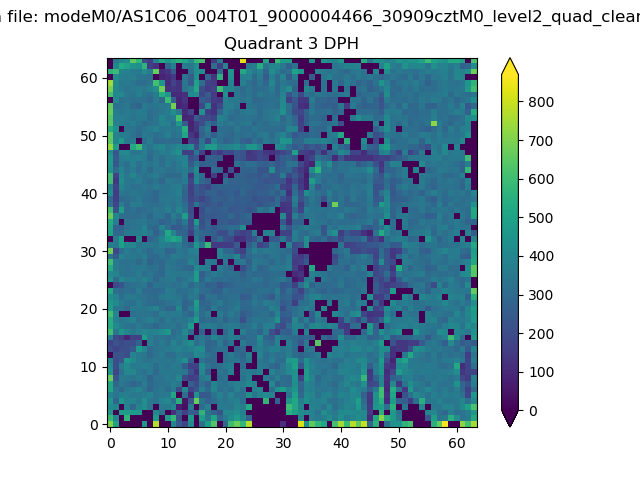 |
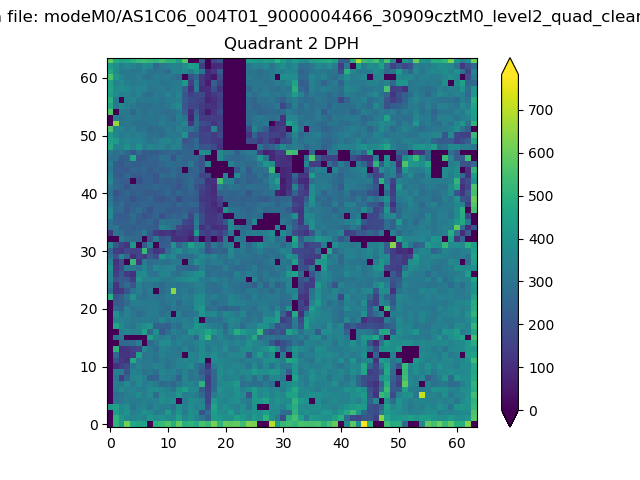 |
Quadrant C |
| Plot type | Count rate plots | Images |
|---|---|---|
| Comparison with Poisson distribution Blue bars denote a histogram of data divided into 1 sec bins. Red curve is a Poisson curve with rate = median count rate of data. |
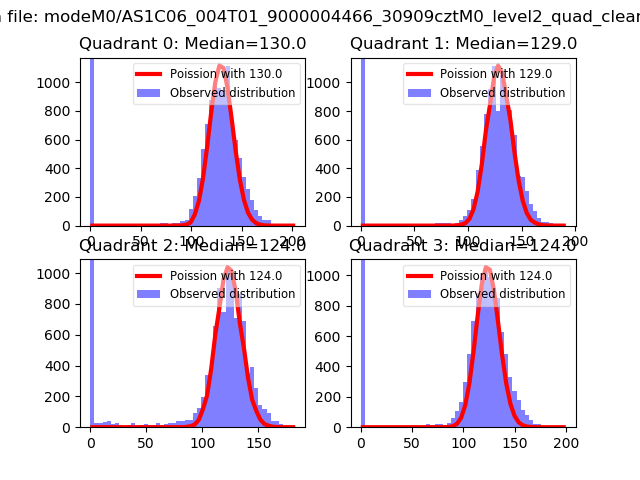 |
 |
| Quadrant-wise count rates Data is divided into 100 sec bins |
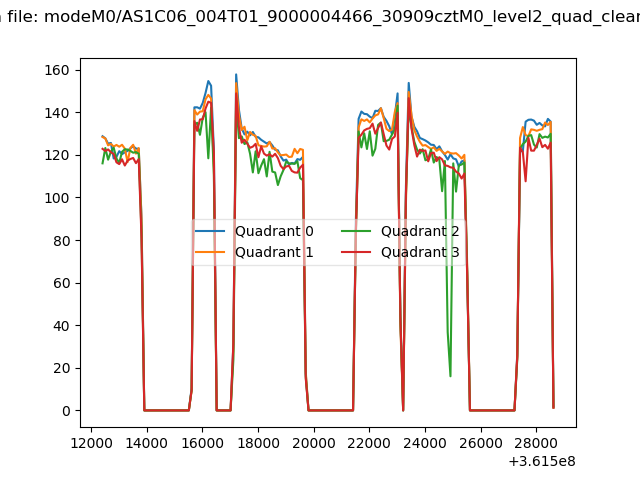 |
|
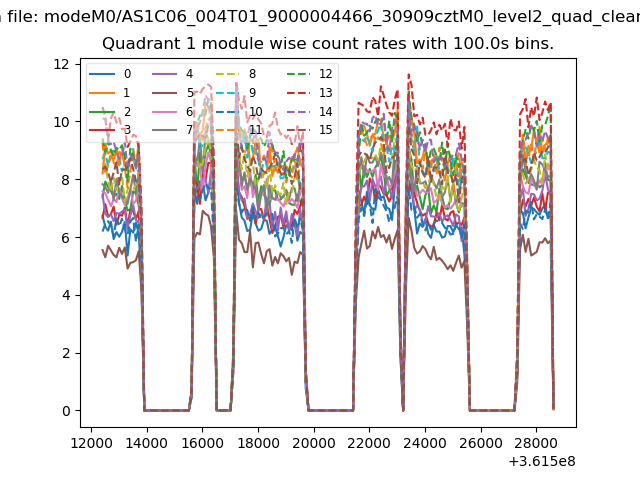
| Module-wise count rates for Quadrant A Data is divided into 100 sec bins |
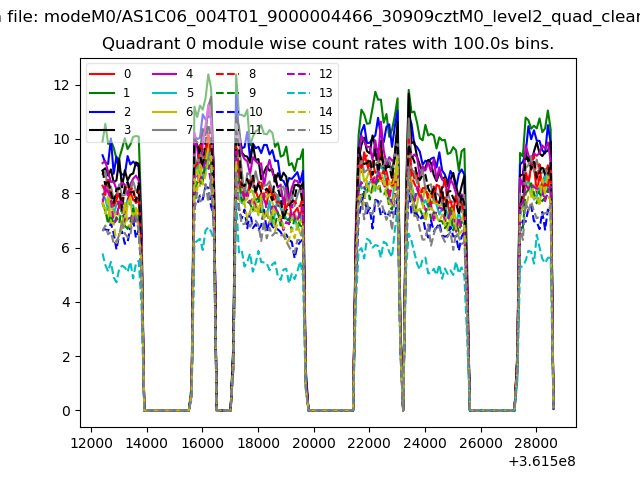 |
 |
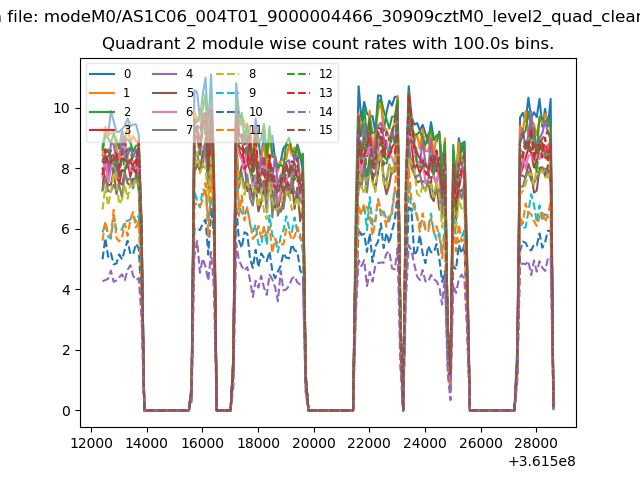
| Module-wise count rates for Quadrant B Data is divided into 100 sec bins |
 |
 |
| Module-wise count rates for Quadrant C Data is divided into 100 sec bins |
 |
 |
| Module-wise count rates for Quadrant D Data is divided into 100 sec bins |
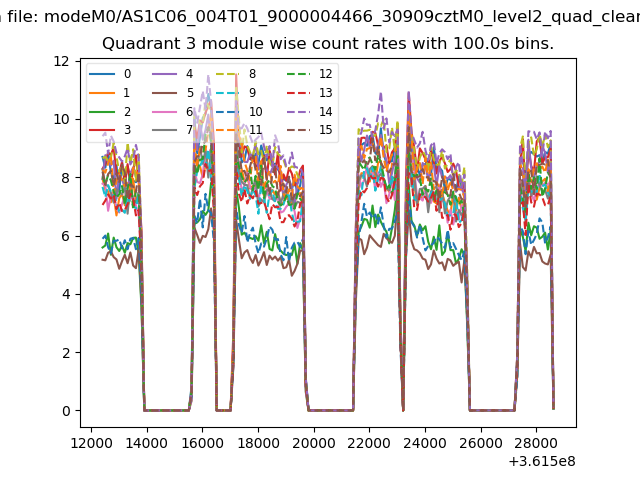 |
 |
| Parameter | Plot |
|---|---|
| CZT HV Monitor | 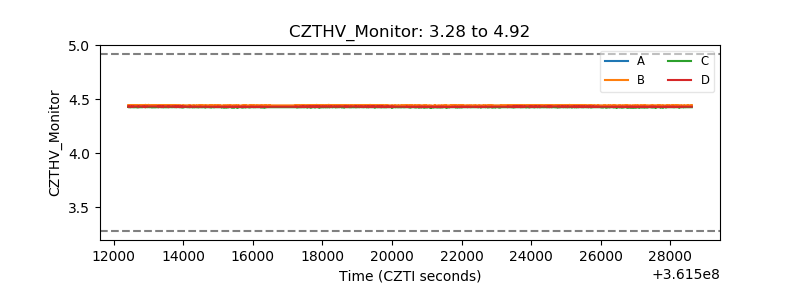 |
| D_VDD | 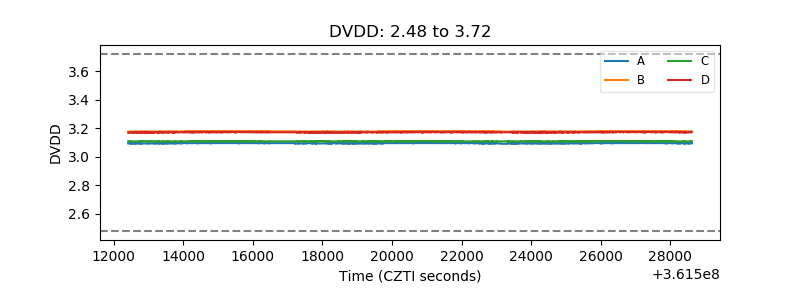 |
| Temperature 1 | 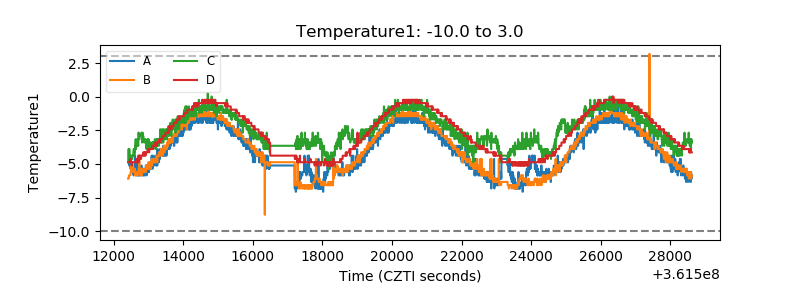 |
| Veto HV Monitor | 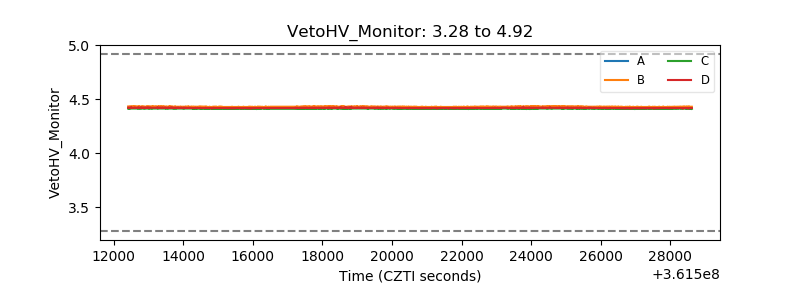 |
| Veto LLD | 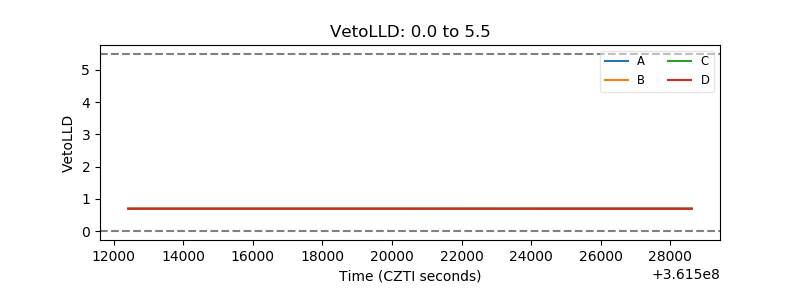 |
| Alpha Counter | 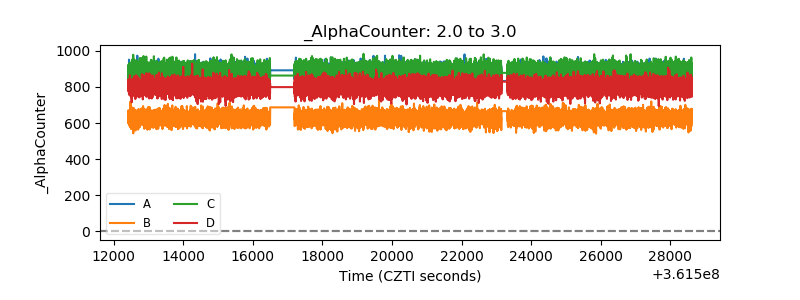 |
| _CPM_Rate | 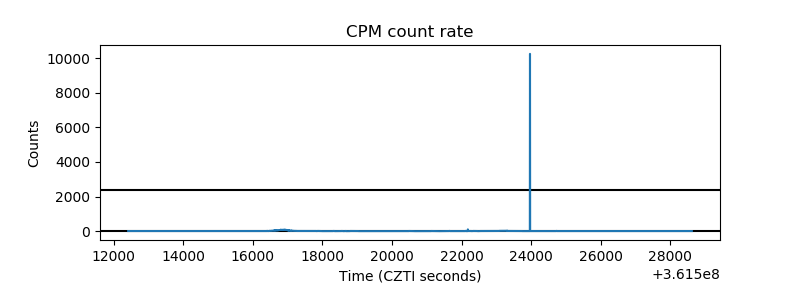 |
| CZT Counter | 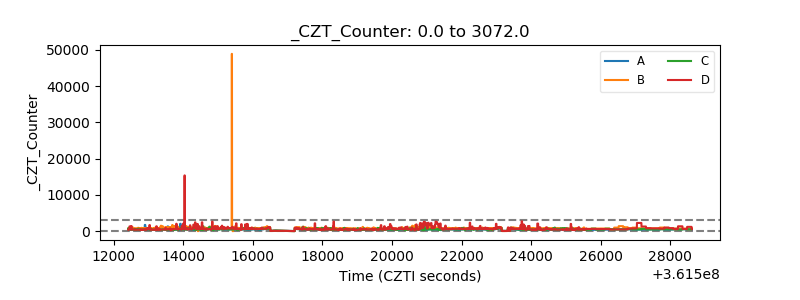 |
| +2.5 Volts monitor |  |
| +5 Volts monitor |  |
| _ROLL_ROT | 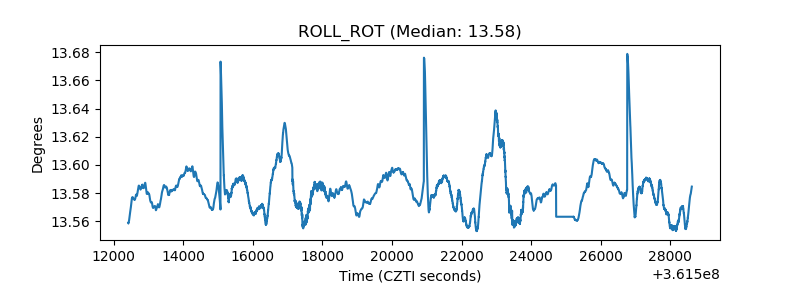 |
| _Roll_DEC | 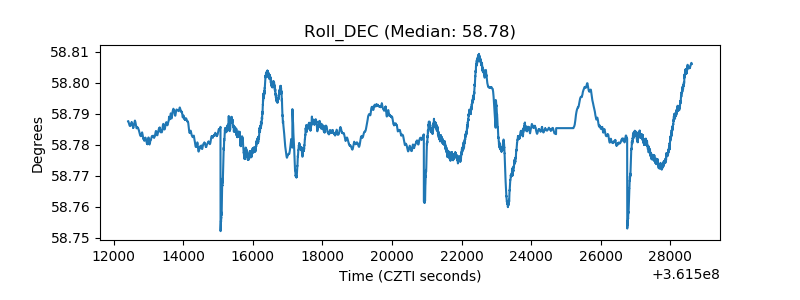 |
| _Roll_RA | 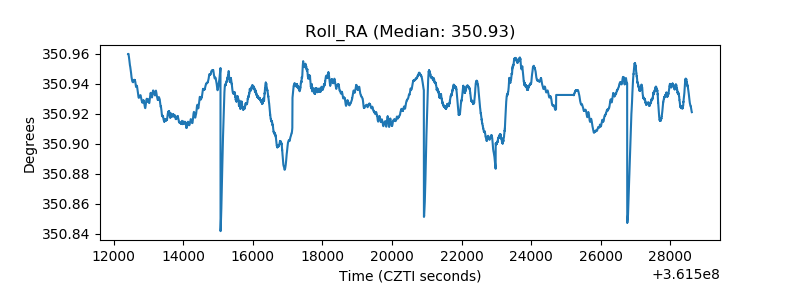 |
| Veto Counter | 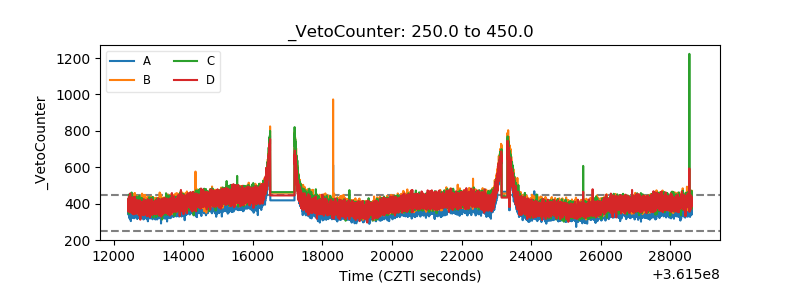 |