| Param | Original file | Final file |
|---|---|---|
| Filename | modeM0/AS1C06_006T02_9000004468cztM0_level2.fits | modeM0/AS1C06_006T02_9000004468cztM0_level2_quad_clean.evt |
| Size (bytes) | 50,901,120 | 36,521,280 |
| Size | 48.5 MB | 34.8 MB |
| Events in quadrant A | 311,238 | 193,401 |
| Events in quadrant B | 291,252 | 190,295 |
| Events in quadrant C | 296,626 | 179,029 |
| Events in quadrant D | 263,158 | 163,188 |
| Mode SS | |||
|---|---|---|---|
| Quadrant | BADHDUFLAG | Total packets | Discarded packets |
| A | 0 | 108 | 0 |
| B | 0 | 108 | 0 |
| C | 0 | 108 | 0 |
| D | 0 | 108 | 0 |
| Mode M0 | |||
|---|---|---|---|
| Quadrant | BADHDUFLAG | Total packets | Discarded packets |
| A | 0 | 11158 | 0 |
| B | 0 | 16678 | 0 |
| C | 0 | 11573 | 0 |
| D | 0 | 14791 | 0 |
| Quadrant | Total seconds | Saturated seconds | Saturation percentage |
|---|---|---|---|
| A | 5414 | 226 | 4.174363% |
| B | 5414 | 311 | 5.744366% |
| C | 5414 | 387 | 7.148134% |
| D | 5414 | 279 | 5.153306% |
Noise dominated data is calculated using 1-second bins in cleaned event files. If a bin has >2000 counts, and if more than 50% of those come from <1% of pixels, then it is considered to be noise-dominated and hence unusable.
| Quadrant | # 1 sec bins | Bins with >0 counts | Bins with >2000 counts | High rate bins dominated by noise | Noise dominated (total time) | Noise dominated (detector-on time) | Marked lightcurve |
|---|---|---|---|---|---|---|---|
| A | 5414 | 5414 | 0 | 0 | 0.00% | 0.00% |  |
| B | 5414 | 5414 | 0 | 0 | 0.00% | 0.00% |  |
| C | 5414 | 5411 | 0 | 0 | 0.00% | 0.00% |  |
| D | 5413 | 5411 | 0 | 0 | 0.00% | 0.00% | 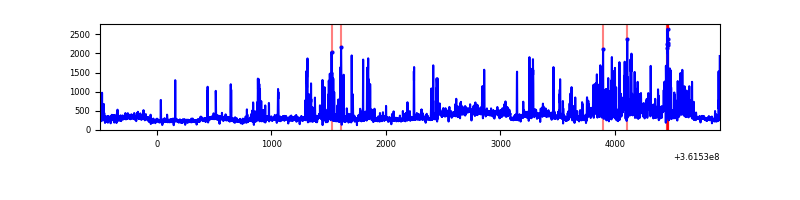 |
Top three noisy pixels from each quadrant. If the there are fewer than three noisy pixels in the level2.evt file, extra rows are filled as -1
| Pixel properties | Quadrant properties | ||||||
|---|---|---|---|---|---|---|---|
| Quadrant | DetID | PixID | Counts | Sigma | Mean | Median | Sigma |
| A | 0 | 29 | 336 | 11.65 | 81 | 76 | 22.3 |
| A | 0 | 30 | 253 | 7.93 | 81 | 76 | 22.3 |
| A | 15 | 236 | 249 | 7.75 | 81 | 76 | 22.3 |
| B | 2 | 9 | 264 | 10.45 | 77 | 73 | 18.3 |
| B | 2 | 8 | 226 | 8.37 | 77 | 73 | 18.3 |
| B | 5 | 128 | 200 | 6.95 | 77 | 73 | 18.3 |
| C | 12 | 242 | 217 | 6.72 | 78 | 73 | 21.4 |
| C | 12 | 241 | 217 | 6.72 | 78 | 73 | 21.4 |
| C | 4 | 254 | 207 | 6.26 | 78 | 73 | 21.4 |
| D | 4 | 246 | 213 | 6.84 | 74 | 68 | 21.2 |
| D | 15 | 63 | 210 | 6.7 | 74 | 68 | 21.2 |
| D | 15 | 47 | 203 | 6.37 | 74 | 68 | 21.2 |
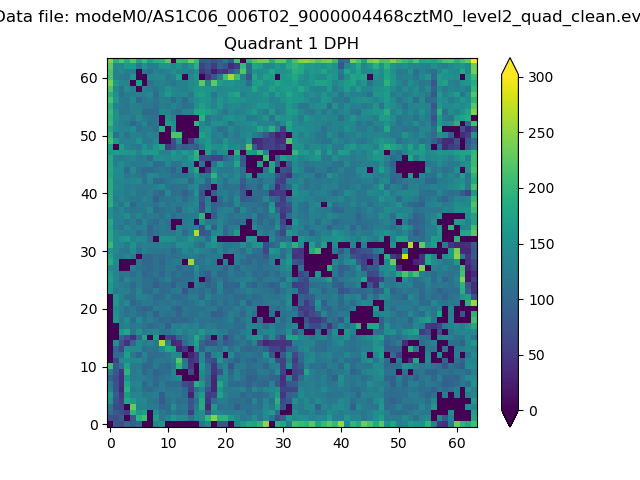
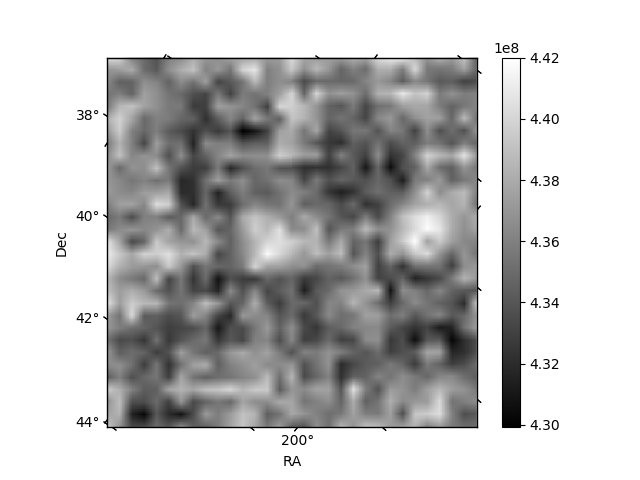
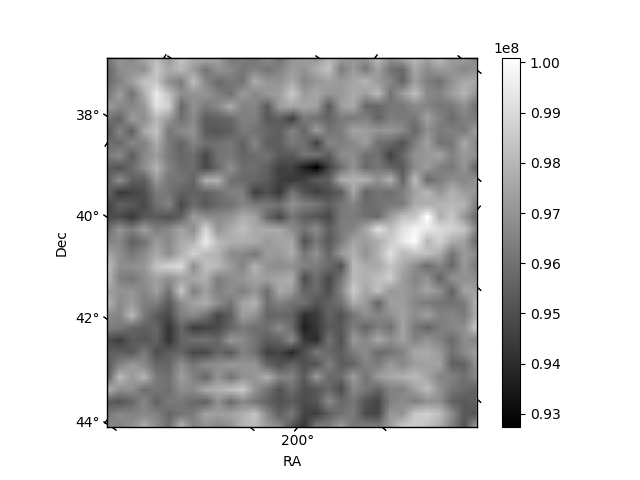
Histogram calculated using DETX and DETY for each event in the final _common_clean file
| Quadrant A |  |
 |
Quadrant B |
|---|---|---|---|
| Quadrant D | 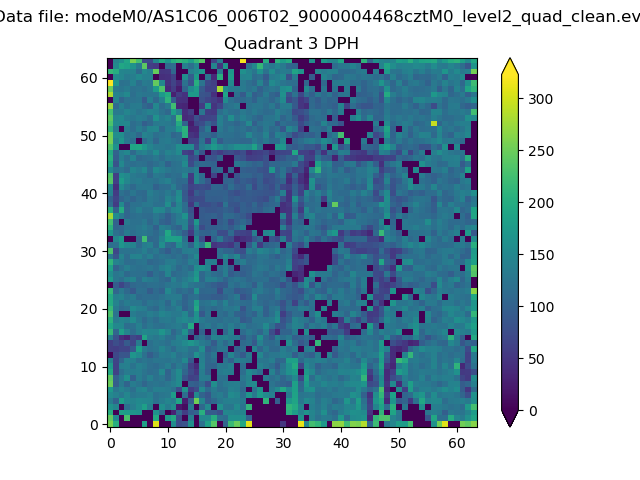 |
 |
Quadrant C |
| Plot type | Count rate plots | Images |
|---|---|---|
| Comparison with Poisson distribution Blue bars denote a histogram of data divided into 1 sec bins. Red curve is a Poisson curve with rate = median count rate of data. |
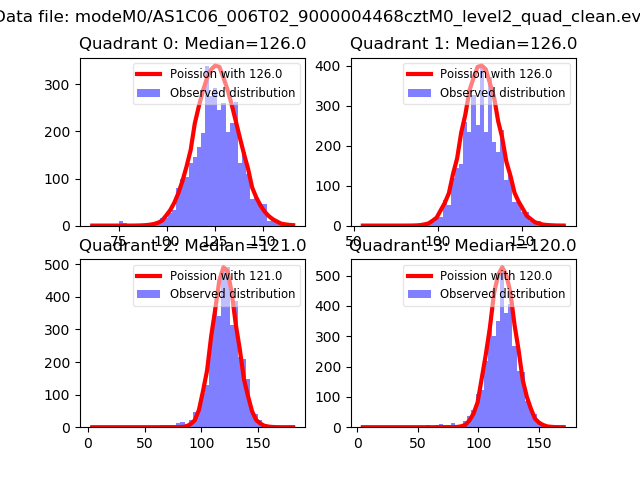 |
 |
| Quadrant-wise count rates Data is divided into 100 sec bins |
 |
|
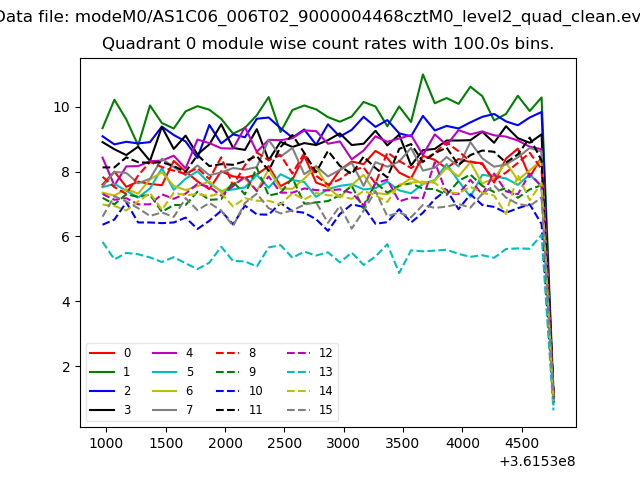
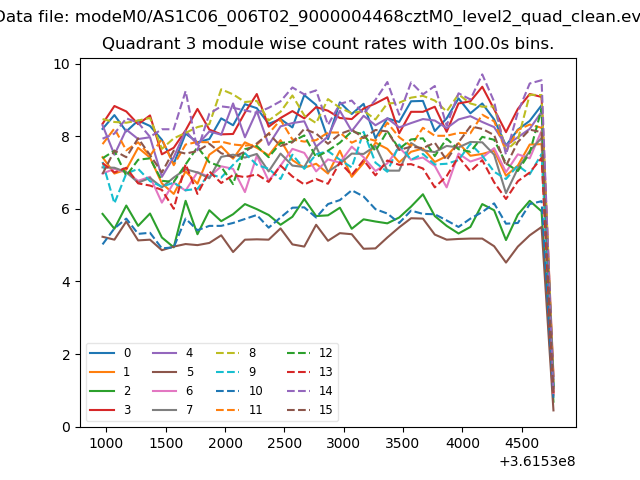
| Module-wise count rates for Quadrant A Data is divided into 100 sec bins |
 |
 |
| Module-wise count rates for Quadrant B Data is divided into 100 sec bins |
 |
 |
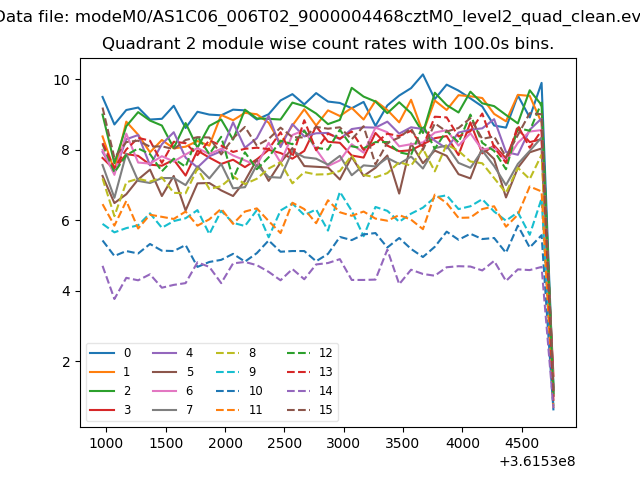
| Module-wise count rates for Quadrant C Data is divided into 100 sec bins |
 |
 |
| Module-wise count rates for Quadrant D Data is divided into 100 sec bins |
 |
 |
| Parameter | Plot |
|---|---|
| CZT HV Monitor |  |
| D_VDD | 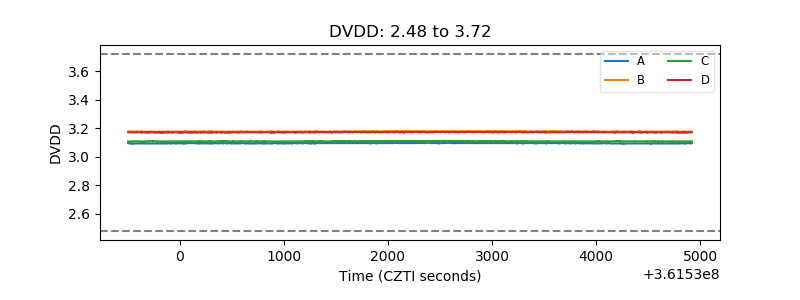 |
| Temperature 1 |  |
| Veto HV Monitor |  |
| Veto LLD |  |
| Alpha Counter |  |
| _CPM_Rate |  |
| CZT Counter |  |
| +2.5 Volts monitor | 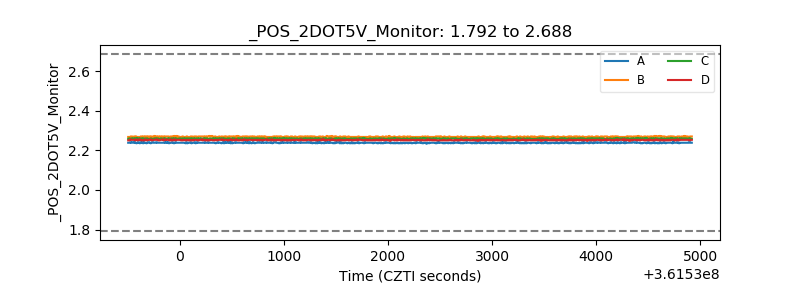 |
| +5 Volts monitor | 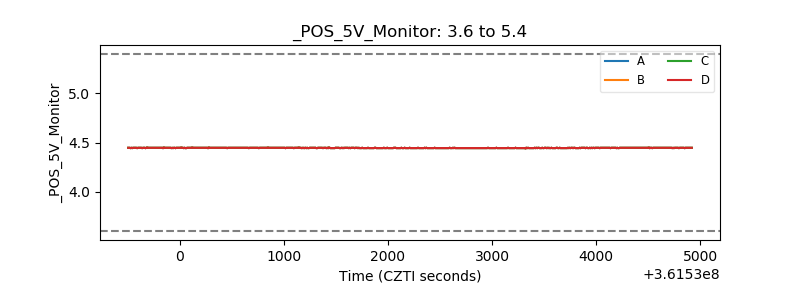 |
| _ROLL_ROT |  |
| _Roll_DEC |  |
| _Roll_RA | 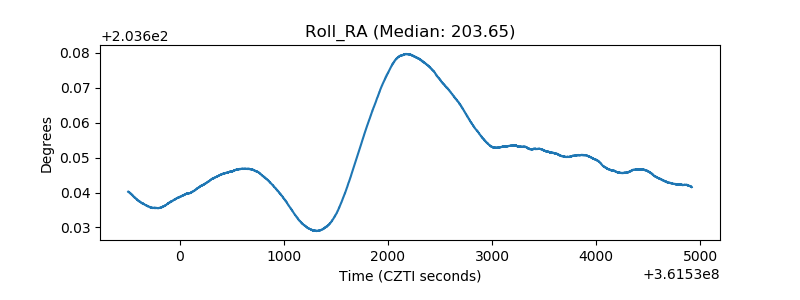 |
| Veto Counter |  |