| Param | Original file | Final file |
|---|---|---|
| Filename | modeM0/AS1C06_006T02_9000004468_30909cztM0_level2.evt | modeM0/AS1C06_006T02_9000004468_30909cztM0_level2_quad_clean.evt |
| Size (bytes) | 164,531,520 | 12,464,640 |
| Size | 156.9 MB | 11.9 MB |
| Events in quadrant A | 1,008,989 | 59,525 |
| Events in quadrant B | 1,575,080 | 61,981 |
| Events in quadrant C | 1,070,305 | 56,458 |
| Events in quadrant D | 1,192,954 | 56,292 |
| Mode SS | |||
|---|---|---|---|
| Quadrant | BADHDUFLAG | Total packets | Discarded packets |
| A | 0 | 40 | 0 |
| B | 0 | 40 | 0 |
| C | 0 | 40 | 0 |
| D | 0 | 40 | 0 |
| Mode M0 | |||
|---|---|---|---|
| Quadrant | BADHDUFLAG | Total packets | Discarded packets |
| A | 0 | 4229 | 0 |
| B | 0 | 6079 | 1 |
| C | 0 | 4422 | 0 |
| D | 0 | 4696 | 0 |
| Quadrant | Total seconds | Saturated seconds | Saturation percentage |
|---|---|---|---|
| A | 1952 | 225 | 11.526639% |
| B | 1951 | 300 | 15.376730% |
| C | 1951 | 310 | 15.889288% |
| D | 1951 | 177 | 9.072271% |
Noise dominated data is calculated using 1-second bins in cleaned event files. If a bin has >2000 counts, and if more than 50% of those come from <1% of pixels, then it is considered to be noise-dominated and hence unusable.
| Quadrant | # 1 sec bins | Bins with >0 counts | Bins with >2000 counts | High rate bins dominated by noise | Noise dominated (total time) | Noise dominated (detector-on time) | Marked lightcurve |
|---|---|---|---|---|---|---|---|
| A | 1952 | 1952 | 0 | 0 | 0.00% | 0.00% | 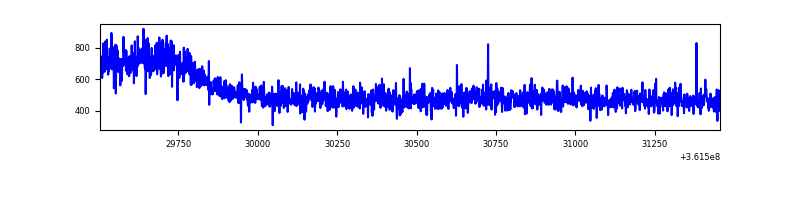 |
| B | 1951 | 1951 | 4 | 4 | 0.21% | 0.21% | 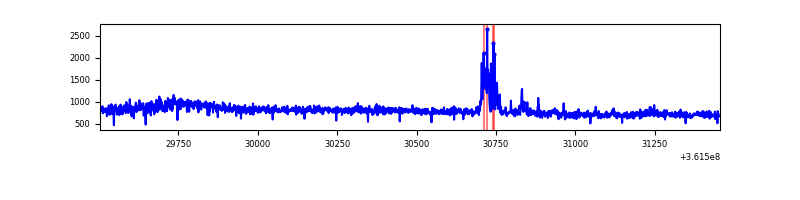 |
| C | 1951 | 1951 | 2 | 2 | 0.10% | 0.10% | 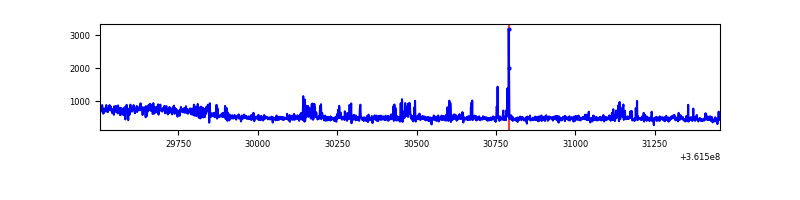 |
| D | 1951 | 1951 | 5 | 5 | 0.26% | 0.26% | 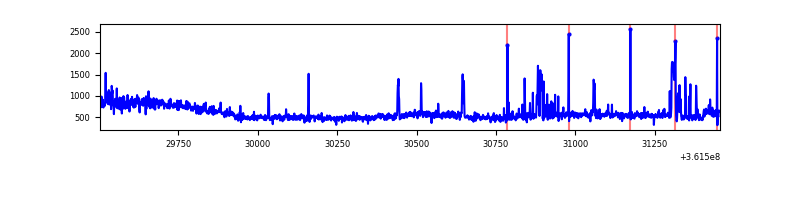 |
Top three noisy pixels from each quadrant. If the there are fewer than three noisy pixels in the level2.evt file, extra rows are filled as -1
| Pixel properties | Quadrant properties | ||||||
|---|---|---|---|---|---|---|---|
| Quadrant | DetID | PixID | Counts | Sigma | Mean | Median | Sigma |
| A | 13 | 254 | 3539 | 59.89 | 261 | 254 | 54.9 |
| A | 3 | 137 | 2949 | 49.13 | 261 | 254 | 54.9 |
| A | 0 | 226 | 2225 | 35.93 | 261 | 254 | 54.9 |
| B | 6 | 159 | 529058 | 10224.21 | 251 | 243 | 51.7 |
| B | 0 | 190 | 24857 | 475.89 | 251 | 243 | 51.7 |
| B | 15 | 201 | 24048 | 460.25 | 251 | 243 | 51.7 |
| C | 14 | 238 | 69339 | 1194.61 | 241 | 240 | 57.8 |
| C | 14 | 254 | 42395 | 728.79 | 241 | 240 | 57.8 |
| C | 0 | 10 | 10548 | 178.21 | 241 | 240 | 57.8 |
| D | 8 | 195 | 188769 | 3076.2 | 252 | 244 | 61.3 |
| D | 2 | 250 | 35758 | 579.49 | 252 | 244 | 61.3 |
| D | 2 | 234 | 9076 | 144.11 | 252 | 244 | 61.3 |
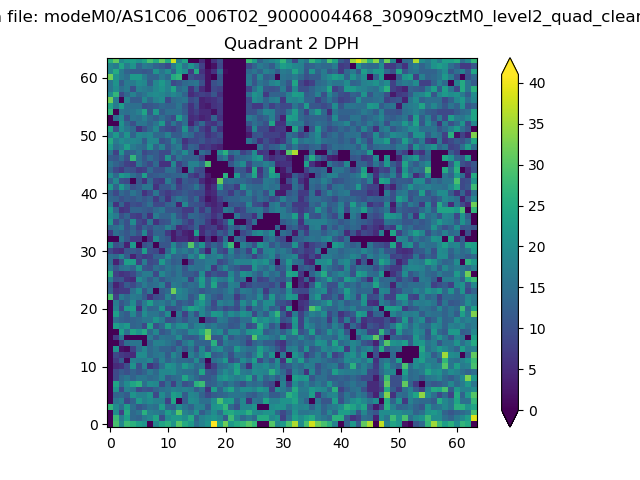
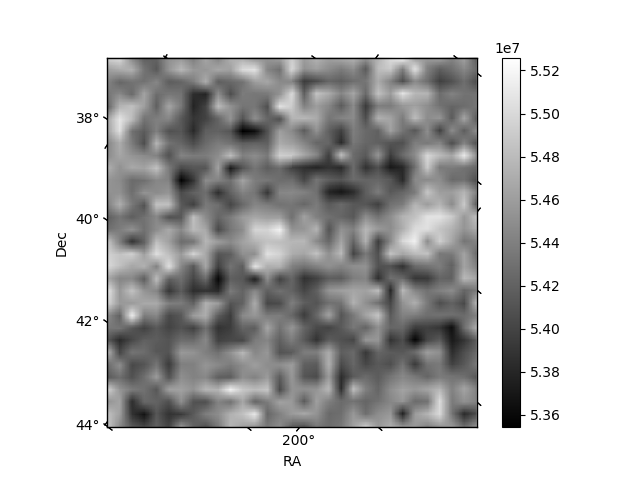
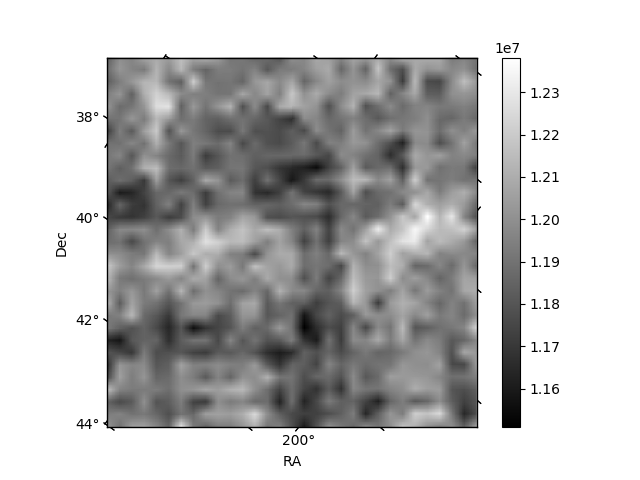
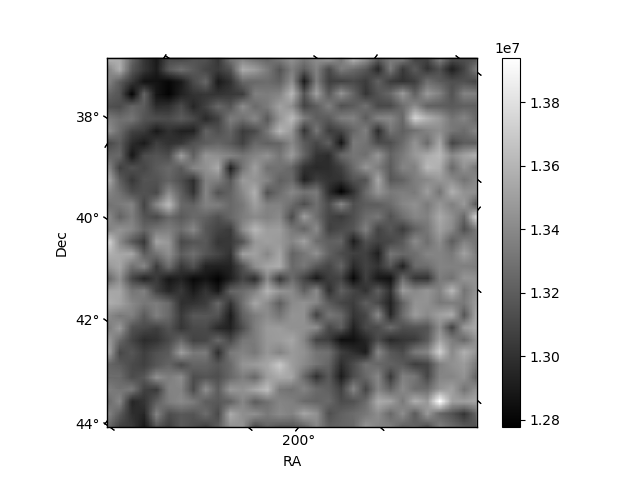
Histogram calculated using DETX and DETY for each event in the final _common_clean file
| Quadrant A | 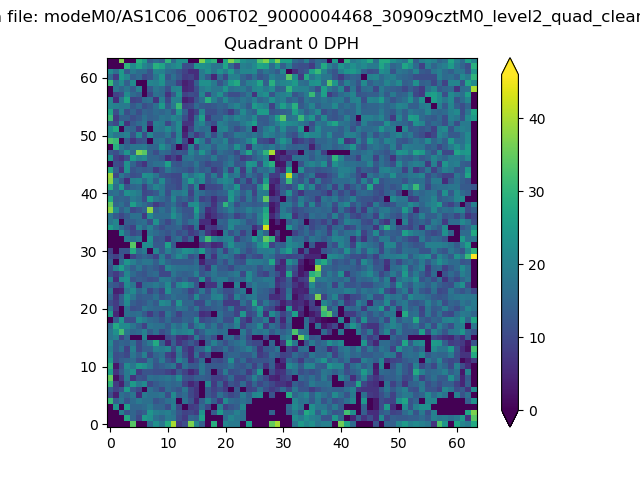 |
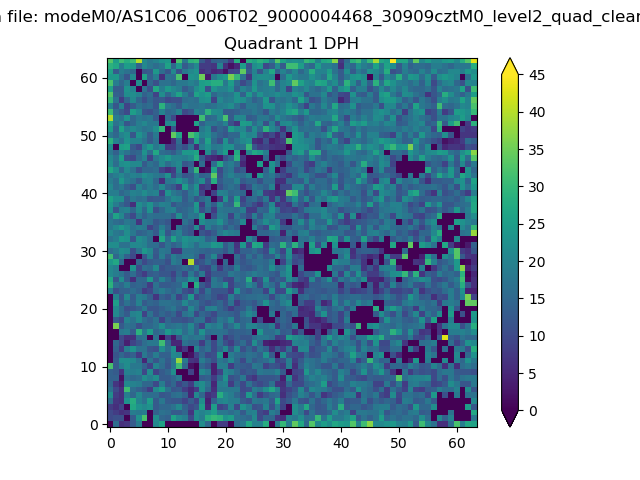 |
Quadrant B |
|---|---|---|---|
| Quadrant D | 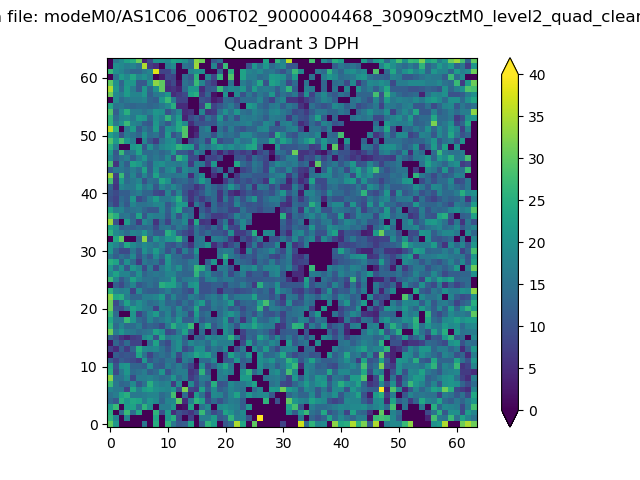 |
 |
Quadrant C |
| Plot type | Count rate plots | Images |
|---|---|---|
| Comparison with Poisson distribution Blue bars denote a histogram of data divided into 1 sec bins. Red curve is a Poisson curve with rate = median count rate of data. |
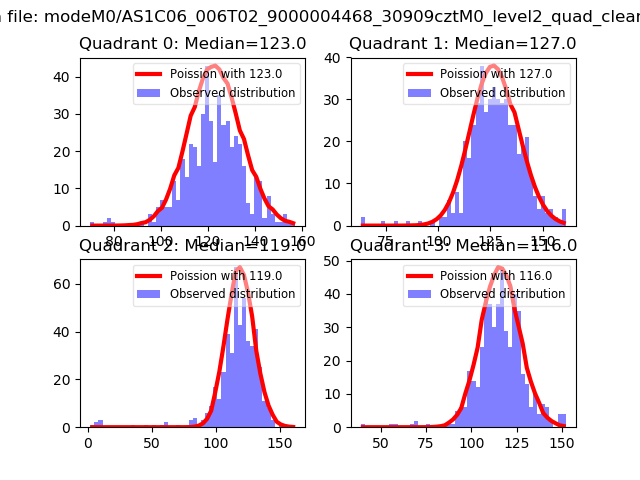 |
 |
| Quadrant-wise count rates Data is divided into 100 sec bins |
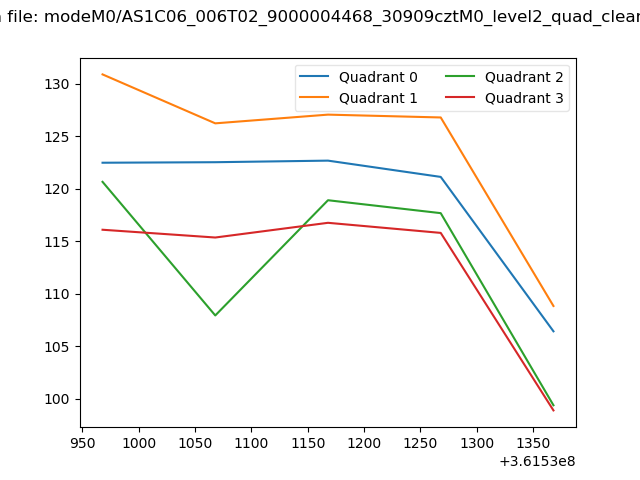 |
|
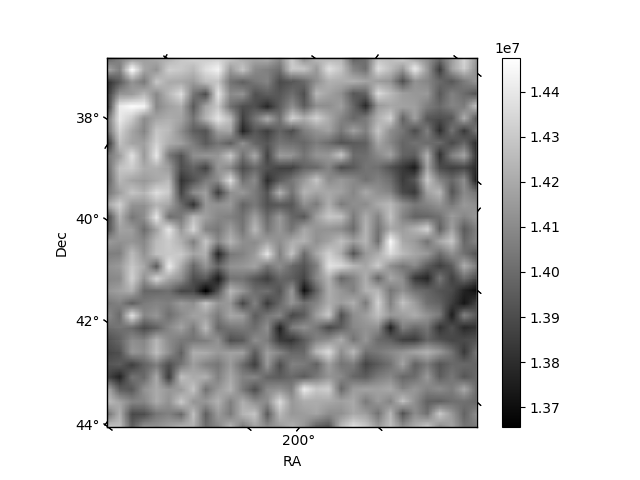
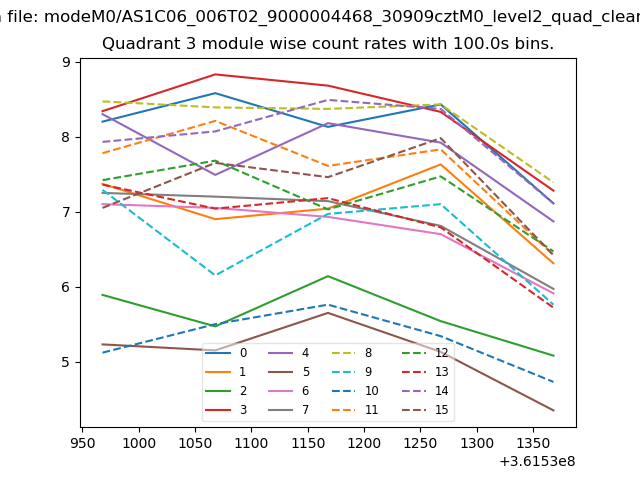
| Module-wise count rates for Quadrant A Data is divided into 100 sec bins |
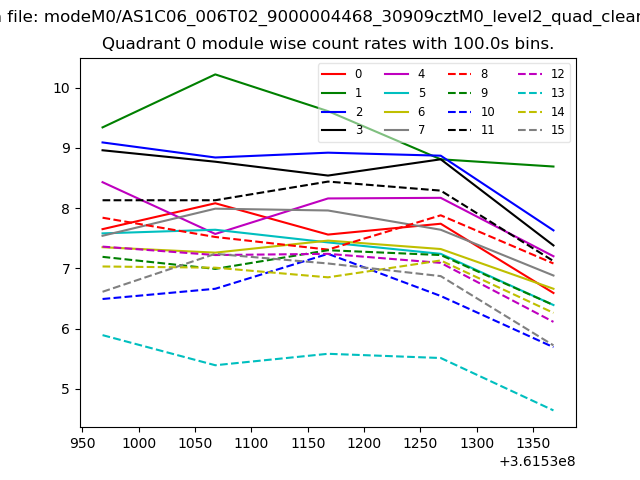 |
 |
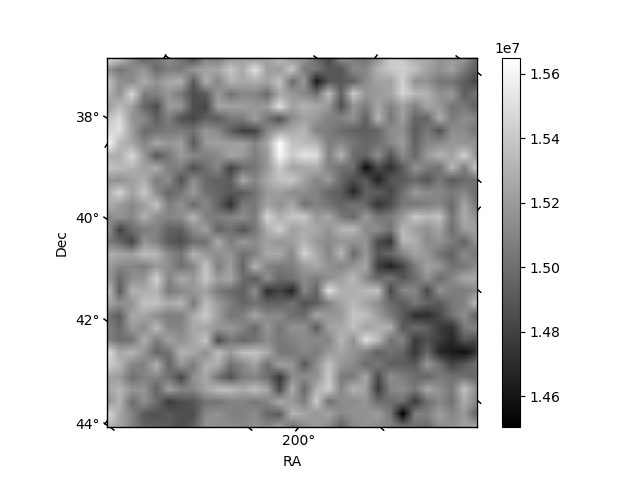
| Module-wise count rates for Quadrant B Data is divided into 100 sec bins |
 |
 |
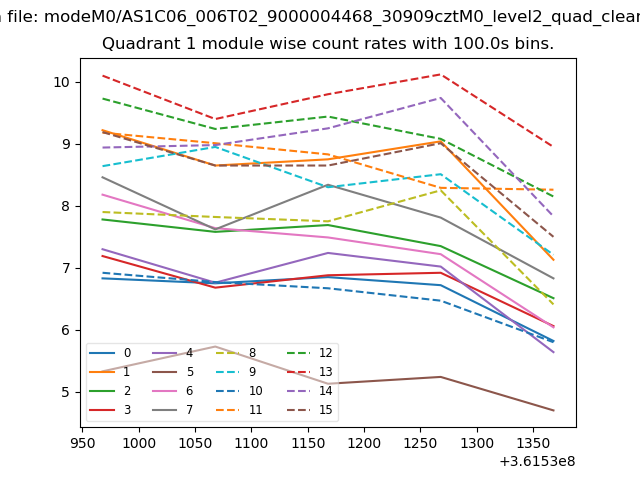
| Module-wise count rates for Quadrant C Data is divided into 100 sec bins |
 |
 |
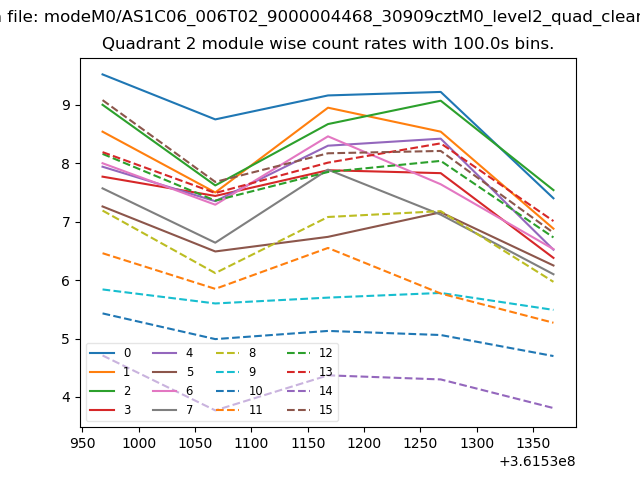
| Module-wise count rates for Quadrant D Data is divided into 100 sec bins |
 |
 |
| Parameter | Plot |
|---|---|
| CZT HV Monitor | 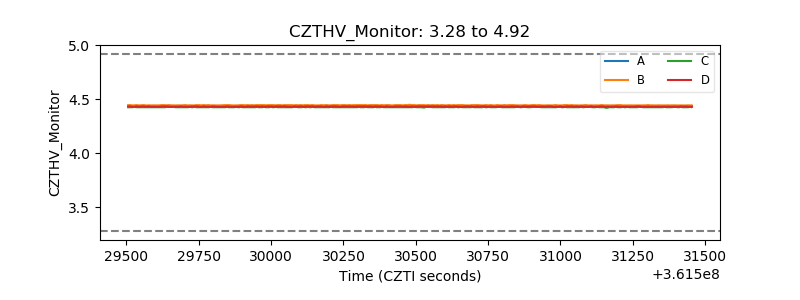 |
| D_VDD | 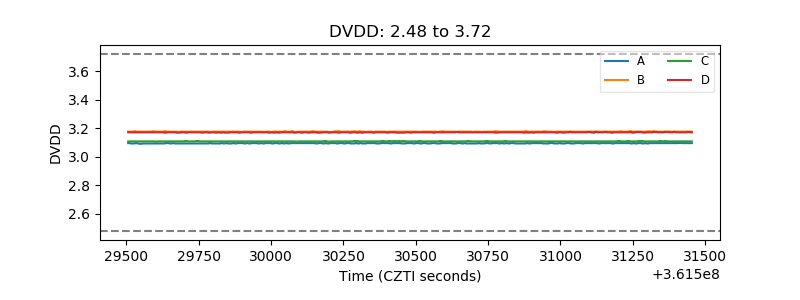 |
| Temperature 1 | 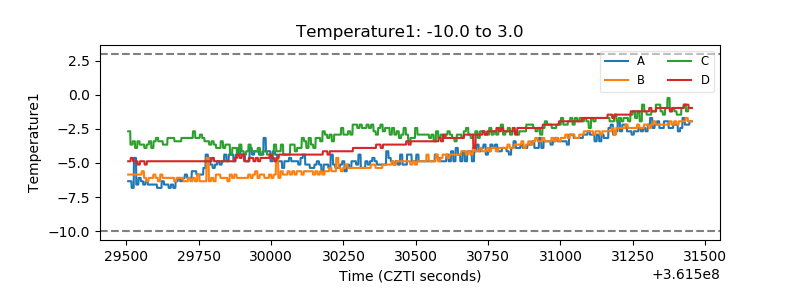 |
| Veto HV Monitor | 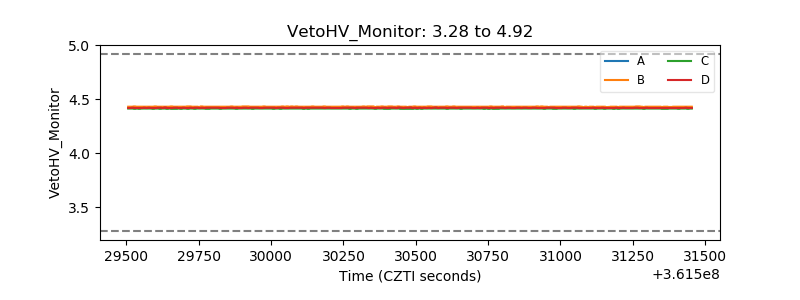 |
| Veto LLD | 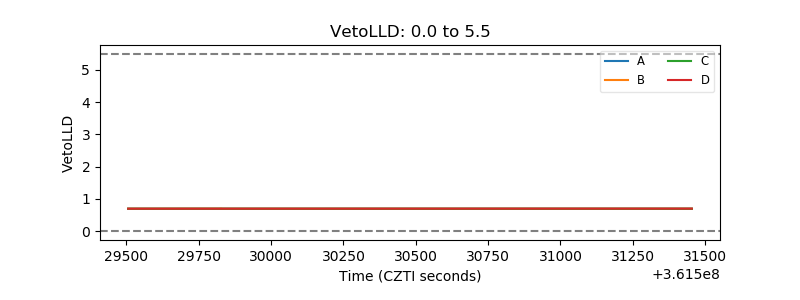 |
| Alpha Counter | 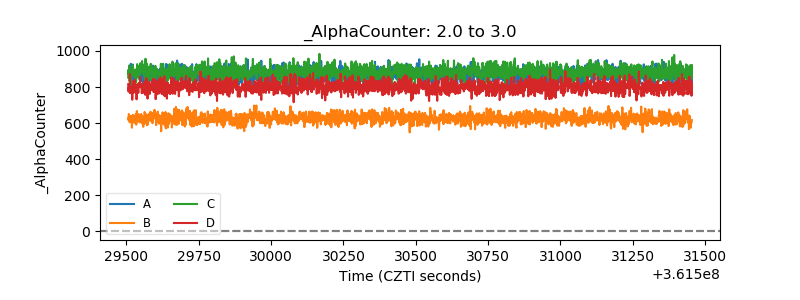 |
| _CPM_Rate | 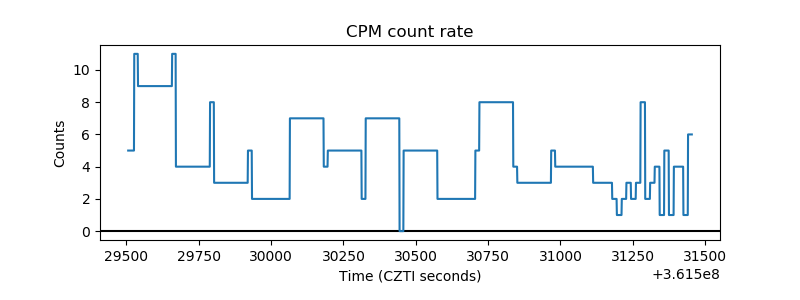 |
| CZT Counter | 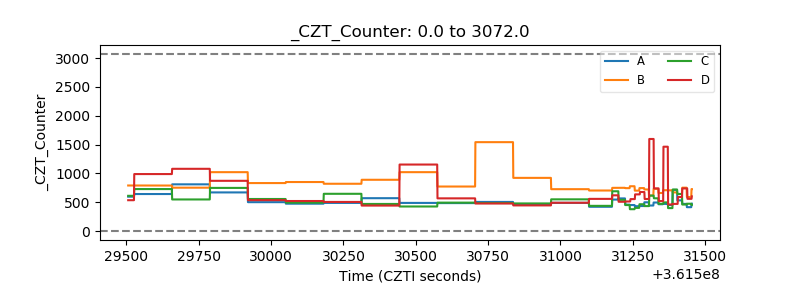 |
| +2.5 Volts monitor | 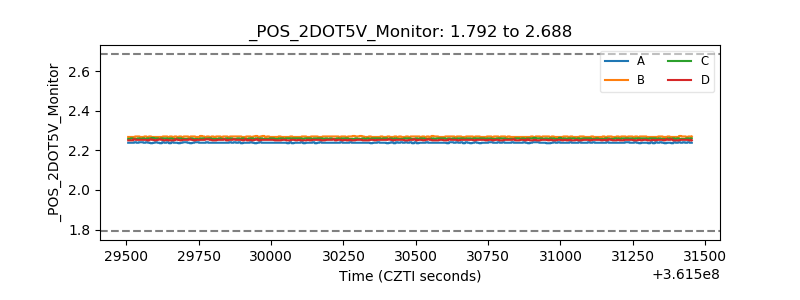 |
| +5 Volts monitor |  |
| _ROLL_ROT | 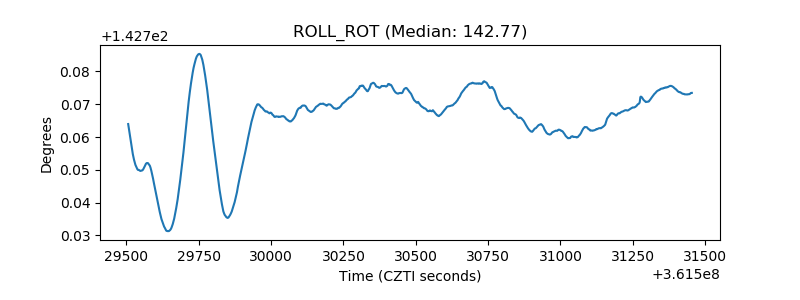 |
| _Roll_DEC | 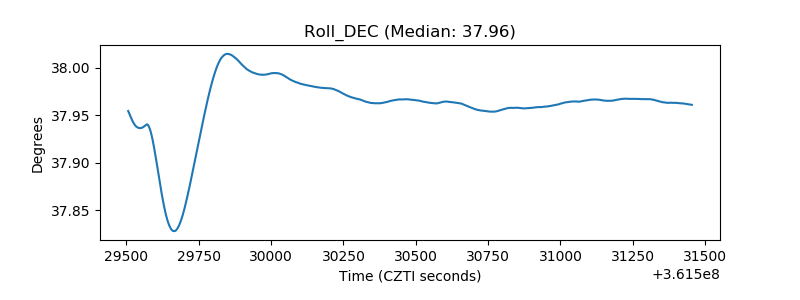 |
| _Roll_RA | 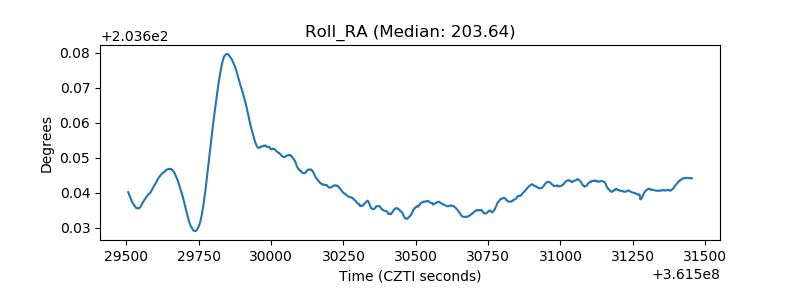 |
| Veto Counter | 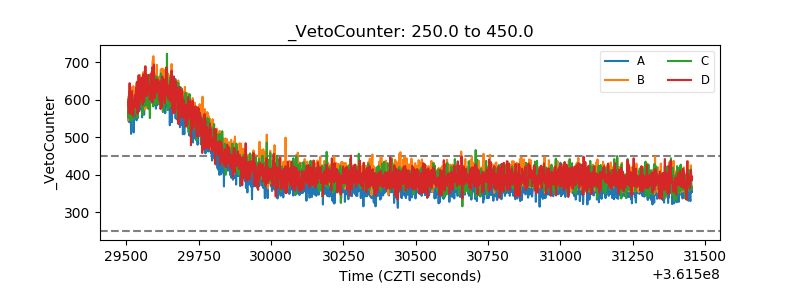 |