| Param | Original file | Final file |
|---|---|---|
| Filename | modeM0/AS1C06_007T01_9000004470cztM0_level2.fits | modeM0/AS1C06_007T01_9000004470cztM0_level2_quad_clean.evt |
| Size (bytes) | 1,036,342,080 | 854,069,760 |
| Size | 988.3 MB | 814.5 MB |
| Events in quadrant A | 6,549,712 | 5,032,668 |
| Events in quadrant B | 6,114,646 | 4,909,467 |
| Events in quadrant C | 6,022,812 | 4,437,947 |
| Events in quadrant D | 5,317,746 | 4,110,164 |
| Mode M0 | |||
|---|---|---|---|
| Quadrant | BADHDUFLAG | Total packets | Discarded packets |
| A | 0 | 229745 | 0 |
| B | 0 | 352559 | 0 |
| C | 0 | 249624 | 0 |
| D | 0 | 326220 | 0 |
| Mode M9 | |||
|---|---|---|---|
| Quadrant | BADHDUFLAG | Total packets | Discarded packets |
| A | 0 | 165 | 0 |
| B | 0 | 165 | 0 |
| C | 0 | 165 | 0 |
| D | 0 | 165 | 0 |
| Mode SS | |||
|---|---|---|---|
| Quadrant | BADHDUFLAG | Total packets | Discarded packets |
| A | 0 | 2190 | 0 |
| B | 0 | 2190 | 0 |
| C | 0 | 2190 | 0 |
| D | 0 | 2190 | 0 |
| Quadrant | Total seconds | Saturated seconds | Saturation percentage |
|---|---|---|---|
| A | 107563 | 2107 | 1.958852% |
| B | 107563 | 4217 | 3.920493% |
| C | 107563 | 10419 | 9.686416% |
| D | 107563 | 7953 | 7.393806% |
Noise dominated data is calculated using 1-second bins in cleaned event files. If a bin has >2000 counts, and if more than 50% of those come from <1% of pixels, then it is considered to be noise-dominated and hence unusable.
| Quadrant | # 1 sec bins | Bins with >0 counts | Bins with >2000 counts | High rate bins dominated by noise | Noise dominated (total time) | Noise dominated (detector-on time) | Marked lightcurve |
|---|---|---|---|---|---|---|---|
| A | 124073 | 107537 | 0 | 0 | 0.00% | 0.00% |  |
| B | 124073 | 107539 | 0 | 0 | 0.00% | 0.00% |  |
| C | 124073 | 107295 | 0 | 0 | 0.00% | 0.00% |  |
| D | 124073 | 107417 | 0 | 0 | 0.00% | 0.00% |  |
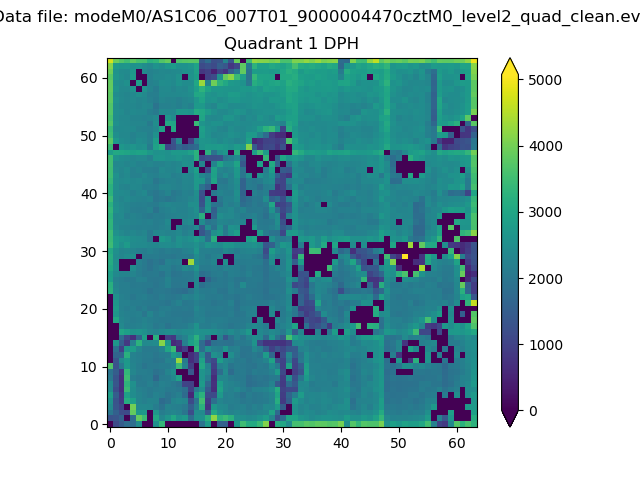
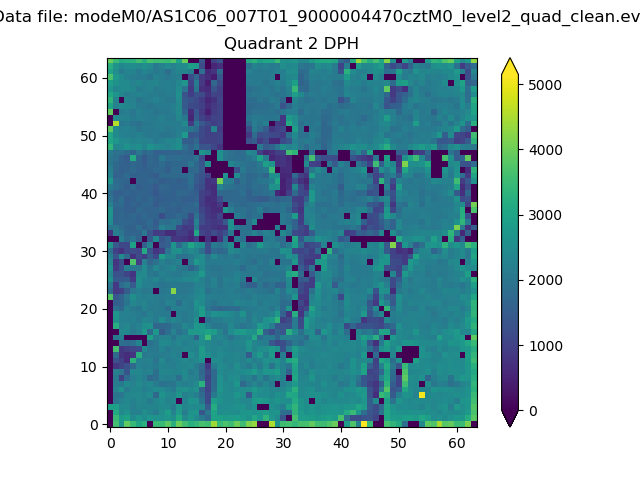
Top three noisy pixels from each quadrant. If the there are fewer than three noisy pixels in the level2.evt file, extra rows are filled as -1
| Pixel properties | Quadrant properties | ||||||
|---|---|---|---|---|---|---|---|
| Quadrant | DetID | PixID | Counts | Sigma | Mean | Median | Sigma |
| A | 0 | 29 | 5368 | 9.0 | 1706 | 1605 | 418.0 |
| A | 7 | 110 | 5105 | 8.37 | 1706 | 1605 | 418.0 |
| A | 9 | 19 | 4875 | 7.82 | 1706 | 1605 | 418.0 |
| B | 2 | 9 | 4856 | 10.55 | 1619 | 1546 | 313.9 |
| B | 3 | 80 | 4185 | 8.41 | 1619 | 1546 | 313.9 |
| B | 2 | 8 | 4123 | 8.21 | 1619 | 1546 | 313.9 |
| C | 12 | 241 | 4258 | 6.91 | 1597 | 1493 | 400.3 |
| C | 3 | 126 | 4122 | 6.57 | 1597 | 1493 | 400.3 |
| C | 3 | 187 | 4059 | 6.41 | 1597 | 1493 | 400.3 |
| D | 15 | 47 | 3866 | 6.21 | 1520 | 1386 | 399.5 |
| D | 7 | 3 | 3810 | 6.07 | 1520 | 1386 | 399.5 |
| D | 10 | 189 | 3805 | 6.05 | 1520 | 1386 | 399.5 |
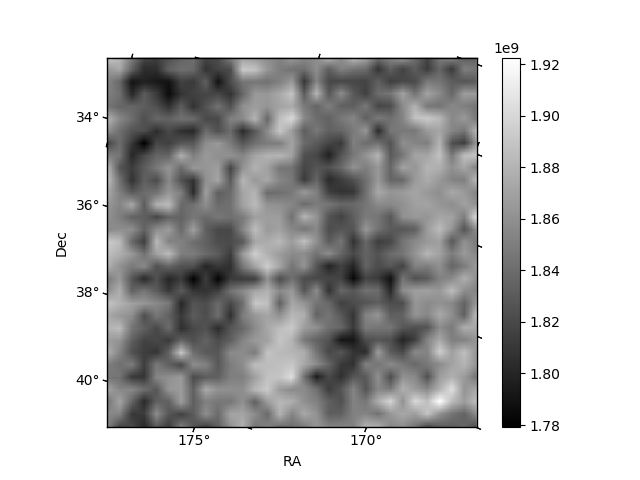
Histogram calculated using DETX and DETY for each event in the final _common_clean file
| Quadrant A | 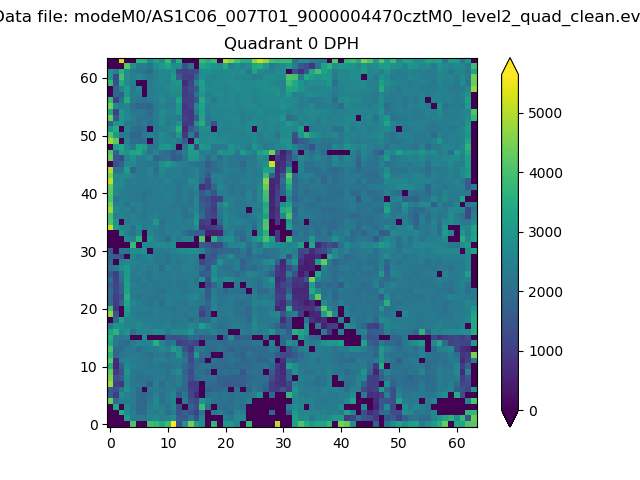 |
 |
Quadrant B |
|---|---|---|---|
| Quadrant D |  |
 |
Quadrant C |
| Plot type | Count rate plots | Images |
|---|---|---|
| Comparison with Poisson distribution Blue bars denote a histogram of data divided into 1 sec bins. Red curve is a Poisson curve with rate = median count rate of data. |
 |
 |
| Quadrant-wise count rates Data is divided into 100 sec bins |
 |
|
| Module-wise count rates for Quadrant A Data is divided into 100 sec bins |
 |
 |
| Module-wise count rates for Quadrant B Data is divided into 100 sec bins |
 |
 |
| Module-wise count rates for Quadrant C Data is divided into 100 sec bins |
 |
 |
| Module-wise count rates for Quadrant D Data is divided into 100 sec bins |
 |
 |
| Parameter | Plot |
|---|---|
| CZT HV Monitor |  |
| D_VDD | 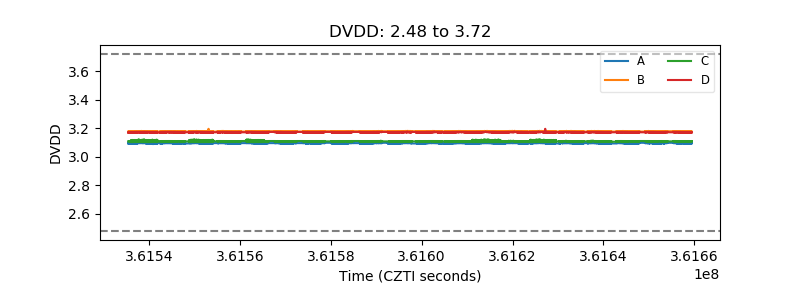 |
| Temperature 1 |  |
| Veto HV Monitor |  |
| Veto LLD |  |
| Alpha Counter |  |
| _CPM_Rate |  |
| CZT Counter |  |
| +2.5 Volts monitor | 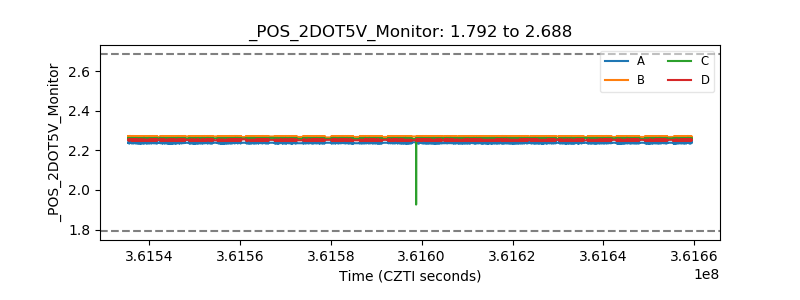 |
| +5 Volts monitor | 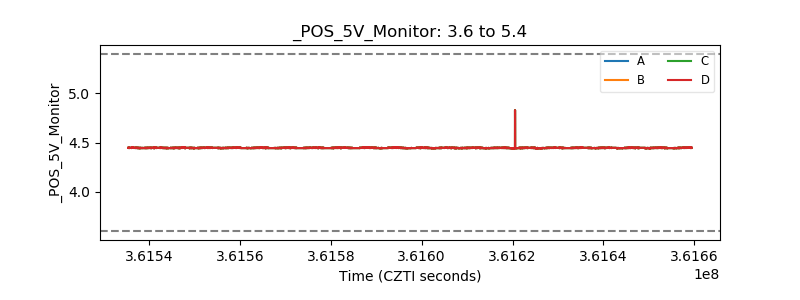 |
| _ROLL_ROT |  |
| _Roll_DEC |  |
| _Roll_RA |  |
| Veto Counter |  |