| Param | Original file | Final file |
|---|---|---|
| Filename | modeM0/AS1C06_007T01_9000004470_30910cztM0_level2.evt | modeM0/AS1C06_007T01_9000004470_30910cztM0_level2_quad_clean.evt |
| Size (bytes) | 189,040,320 | 27,506,880 |
| Size | 180.3 MB | 26.2 MB |
| Events in quadrant A | 1,109,240 | 177,155 |
| Events in quadrant B | 1,731,439 | 177,621 |
| Events in quadrant C | 1,281,593 | 160,660 |
| Events in quadrant D | 1,459,523 | 166,600 |
| Mode M0 | |||
|---|---|---|---|
| Quadrant | BADHDUFLAG | Total packets | Discarded packets |
| A | 0 | 4519 | 1 |
| B | 0 | 6660 | 1 |
| C | 0 | 5091 | 1 |
| D | 0 | 5715 | 1 |
| Mode M9 | |||
|---|---|---|---|
| Quadrant | BADHDUFLAG | Total packets | Discarded packets |
| A | 0 | 3 | 0 |
| B | 0 | 3 | 0 |
| C | 0 | 3 | 0 |
| D | 0 | 3 | 0 |
| Mode SS | |||
|---|---|---|---|
| Quadrant | BADHDUFLAG | Total packets | Discarded packets |
| A | 0 | 42 | 0 |
| B | 0 | 42 | 0 |
| C | 0 | 42 | 0 |
| D | 0 | 42 | 0 |
| Quadrant | Total seconds | Saturated seconds | Saturation percentage |
|---|---|---|---|
| A | 2078 | 164 | 7.892204% |
| B | 2078 | 228 | 10.972089% |
| C | 2078 | 406 | 19.538017% |
| D | 2078 | 177 | 8.517806% |
Noise dominated data is calculated using 1-second bins in cleaned event files. If a bin has >2000 counts, and if more than 50% of those come from <1% of pixels, then it is considered to be noise-dominated and hence unusable.
| Quadrant | # 1 sec bins | Bins with >0 counts | Bins with >2000 counts | High rate bins dominated by noise | Noise dominated (total time) | Noise dominated (detector-on time) | Marked lightcurve |
|---|---|---|---|---|---|---|---|
| A | 2313 | 2078 | 0 | 0 | 0.00% | 0.00% | 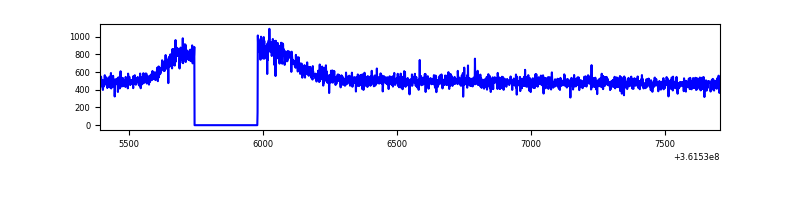 |
| B | 2313 | 2078 | 1 | 1 | 0.04% | 0.05% | 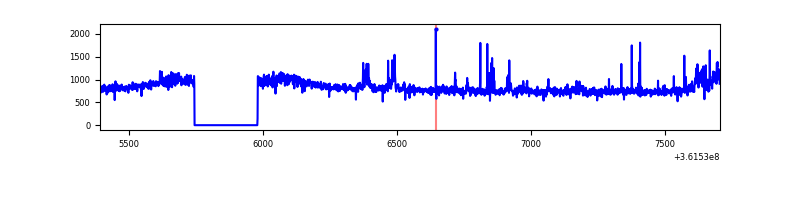 |
| C | 2313 | 2078 | 7 | 7 | 0.30% | 0.34% | 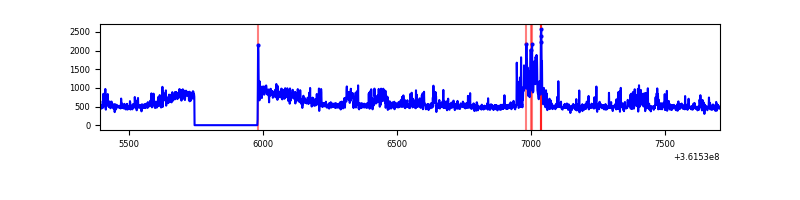 |
| D | 2313 | 2078 | 19 | 19 | 0.82% | 0.91% | 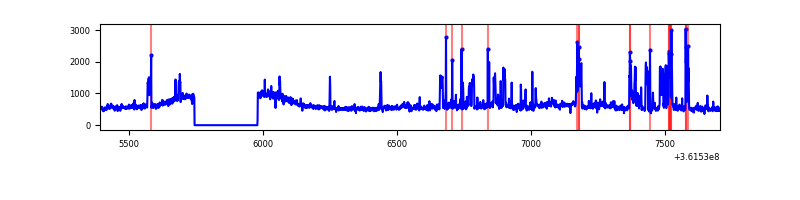 |
Top three noisy pixels from each quadrant. If the there are fewer than three noisy pixels in the level2.evt file, extra rows are filled as -1
| Pixel properties | Quadrant properties | ||||||
|---|---|---|---|---|---|---|---|
| Quadrant | DetID | PixID | Counts | Sigma | Mean | Median | Sigma |
| A | 13 | 254 | 3504 | 52.9 | 287 | 279 | 61.0 |
| A | 3 | 137 | 3159 | 47.24 | 287 | 279 | 61.0 |
| A | 0 | 226 | 2463 | 35.83 | 287 | 279 | 61.0 |
| B | 6 | 159 | 556391 | 9892.74 | 275 | 267 | 56.2 |
| B | 0 | 155 | 22865 | 401.99 | 275 | 267 | 56.2 |
| B | 0 | 230 | 14293 | 249.5 | 275 | 267 | 56.2 |
| C | 14 | 238 | 99841 | 1562.1 | 258 | 258 | 63.7 |
| C | 14 | 254 | 80260 | 1254.94 | 258 | 258 | 63.7 |
| C | 0 | 10 | 72165 | 1127.96 | 258 | 258 | 63.7 |
| D | 8 | 195 | 250210 | 3657.77 | 278 | 270 | 68.3 |
| D | 2 | 250 | 109715 | 1601.68 | 278 | 270 | 68.3 |
| D | 12 | 233 | 24501 | 354.61 | 278 | 270 | 68.3 |
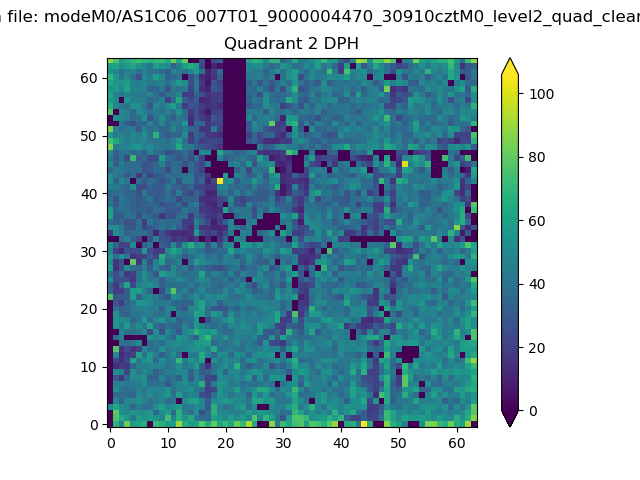
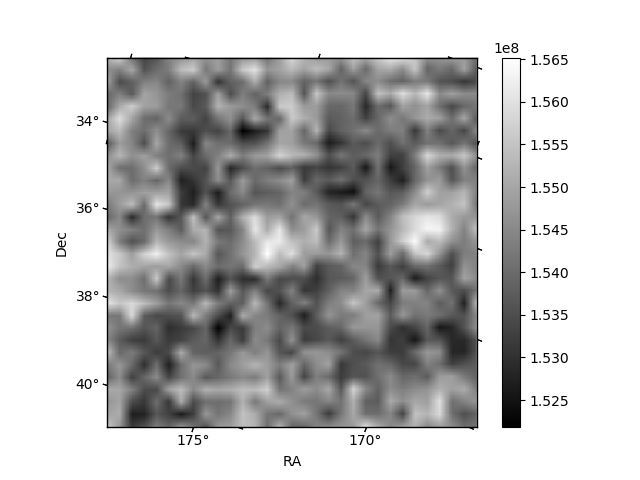
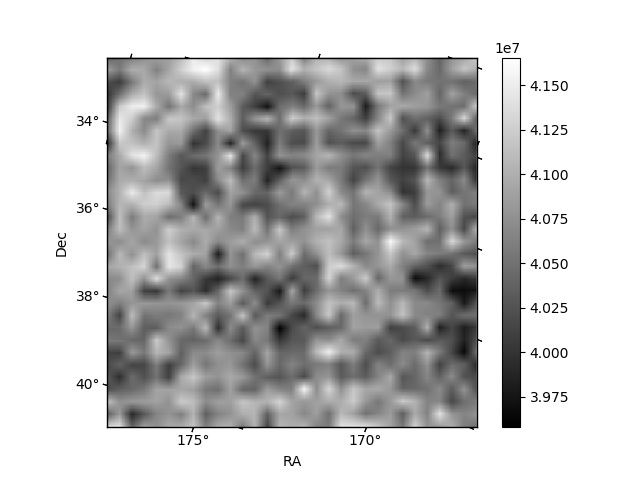
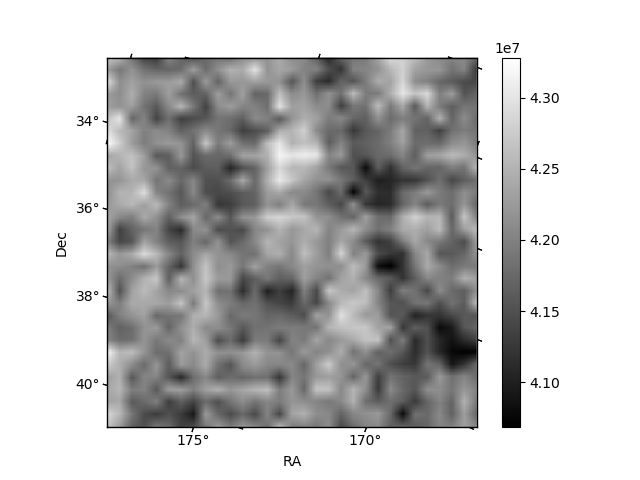
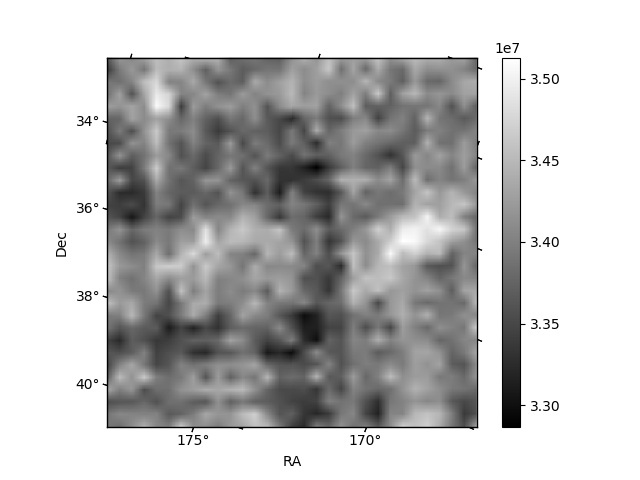
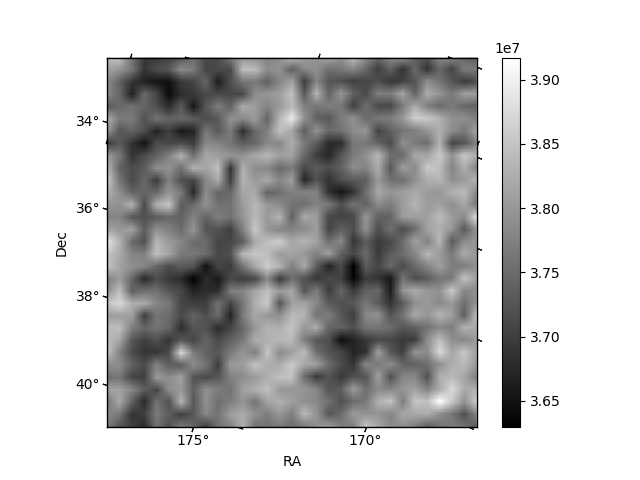
Histogram calculated using DETX and DETY for each event in the final _common_clean file
| Quadrant A | 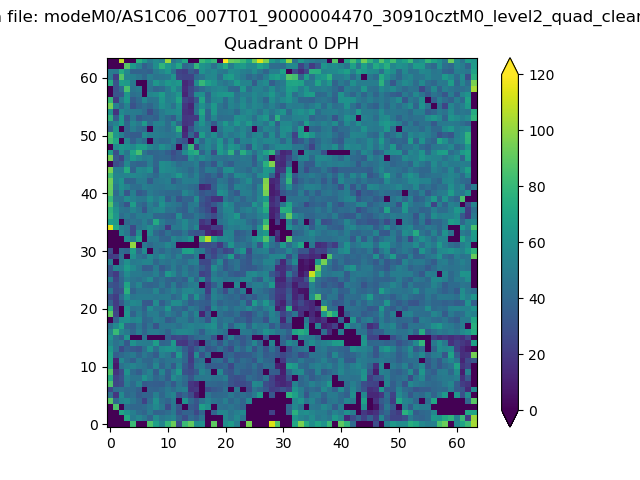 |
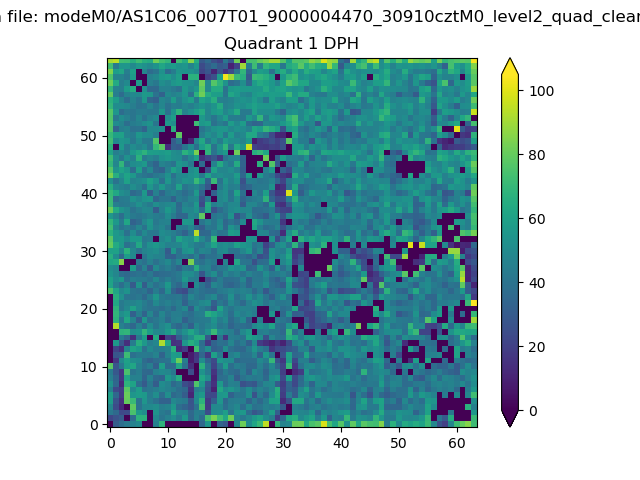 |
Quadrant B |
|---|---|---|---|
| Quadrant D | 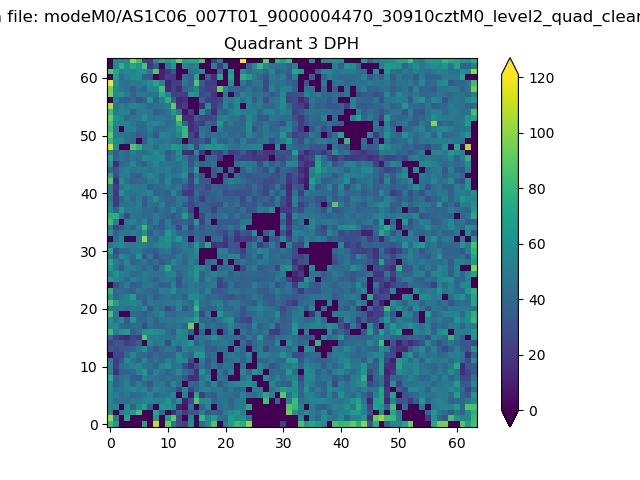 |
 |
Quadrant C |
| Plot type | Count rate plots | Images |
|---|---|---|
| Comparison with Poisson distribution Blue bars denote a histogram of data divided into 1 sec bins. Red curve is a Poisson curve with rate = median count rate of data. |
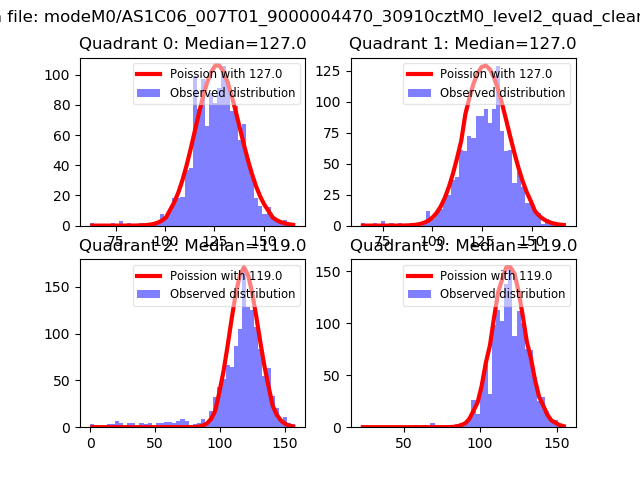 |
 |
| Quadrant-wise count rates Data is divided into 100 sec bins |
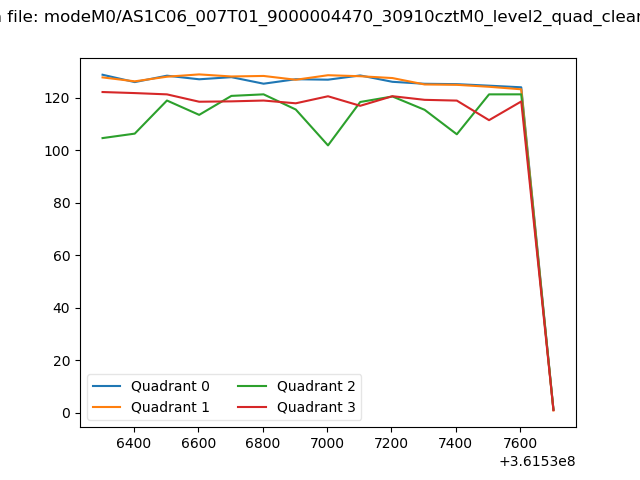 |
|
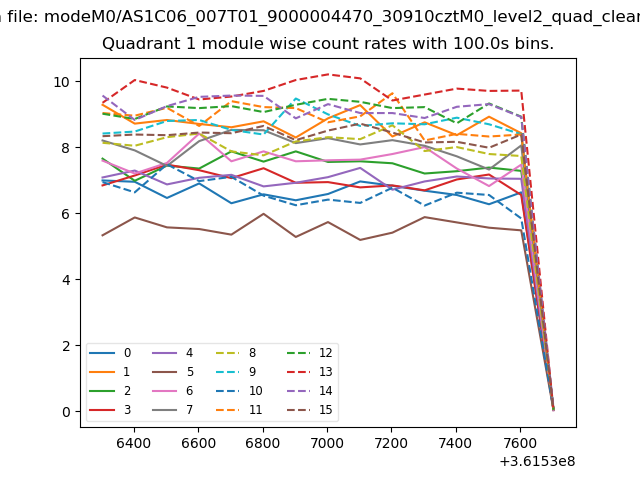
| Module-wise count rates for Quadrant A Data is divided into 100 sec bins |
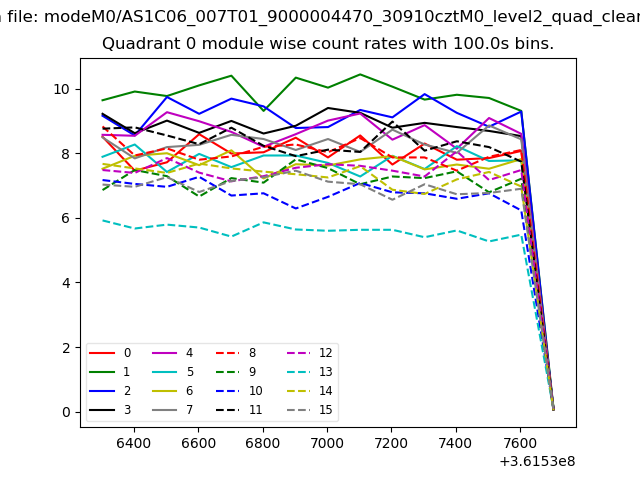 |
 |
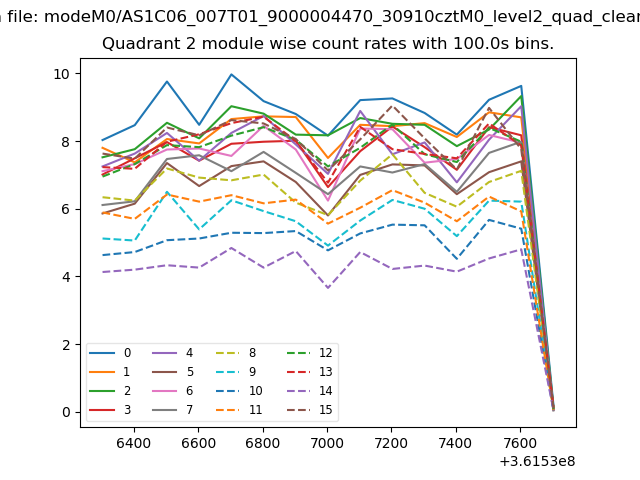
| Module-wise count rates for Quadrant B Data is divided into 100 sec bins |
 |
 |
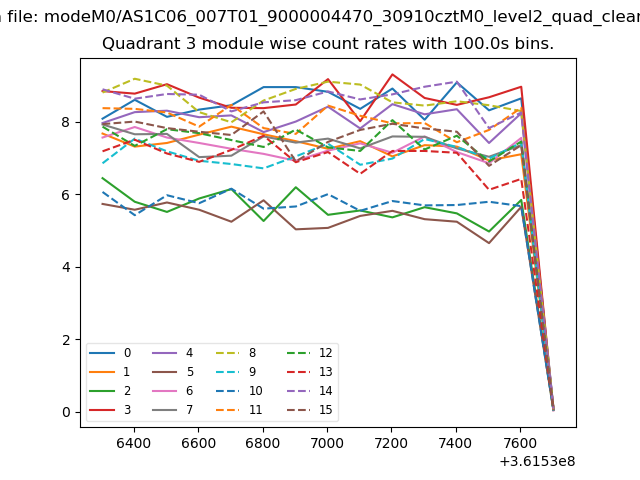
| Module-wise count rates for Quadrant C Data is divided into 100 sec bins |
 |
 |
| Module-wise count rates for Quadrant D Data is divided into 100 sec bins |
 |
 |
| Parameter | Plot |
|---|---|
| CZT HV Monitor | 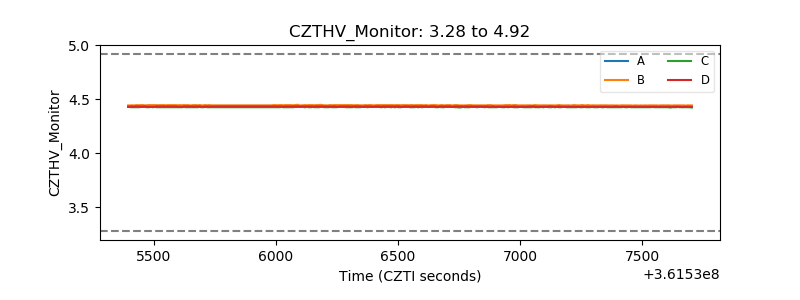 |
| D_VDD | 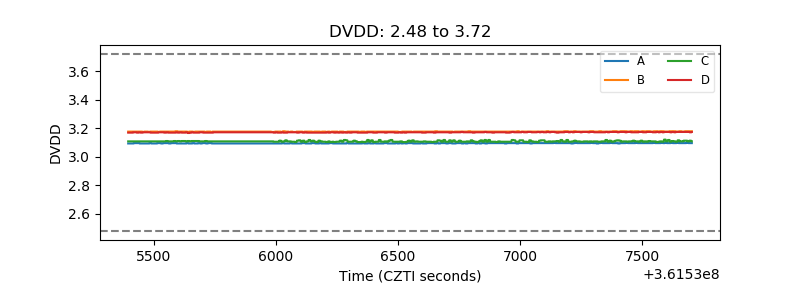 |
| Temperature 1 | 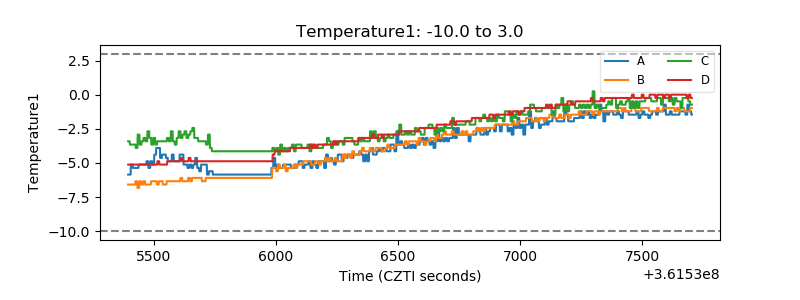 |
| Veto HV Monitor |  |
| Veto LLD | 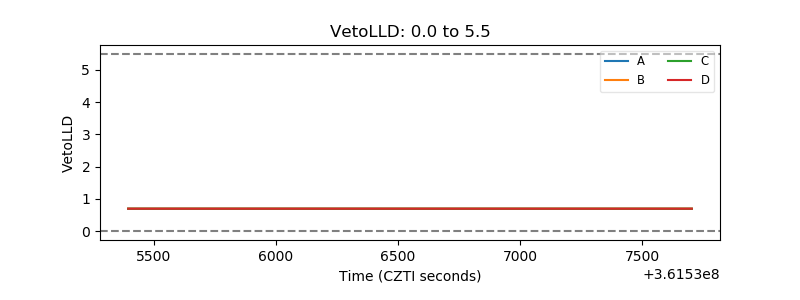 |
| Alpha Counter | 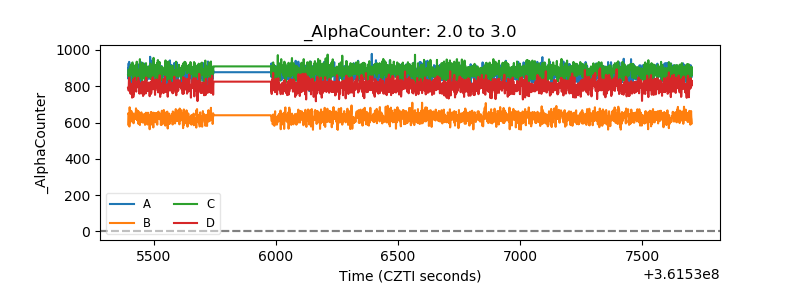 |
| _CPM_Rate | 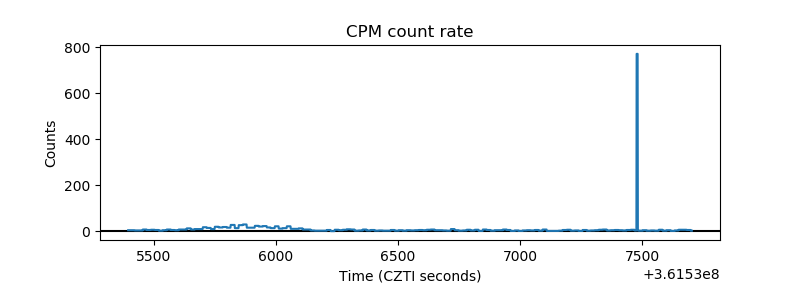 |
| CZT Counter | 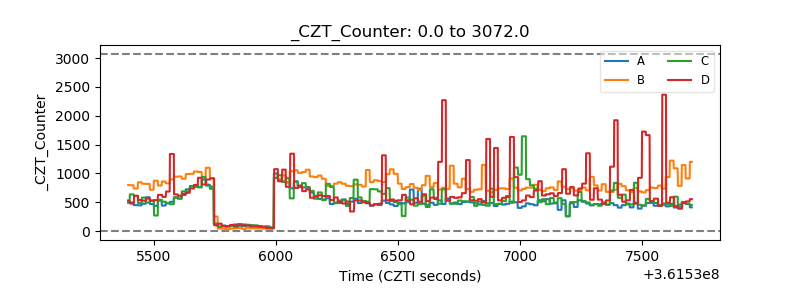 |
| +2.5 Volts monitor |  |
| +5 Volts monitor |  |
| _ROLL_ROT | 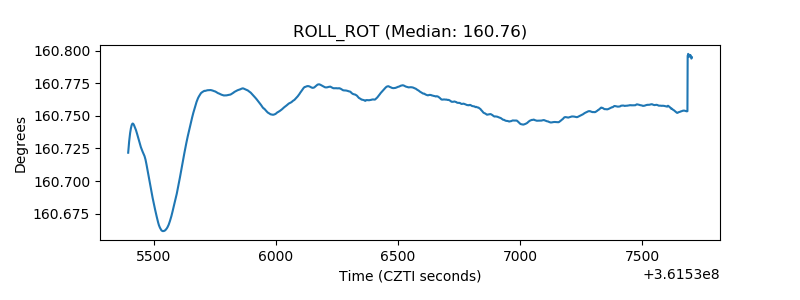 |
| _Roll_DEC |  |
| _Roll_RA | 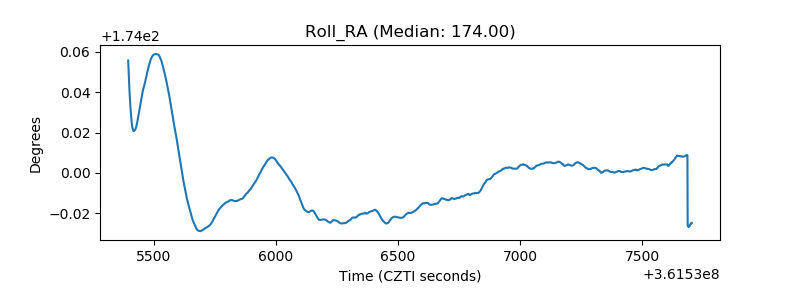 |
| Veto Counter | 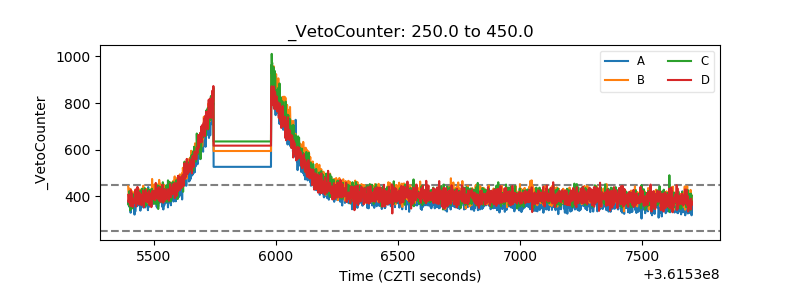 |