| Param | Original file | Final file |
|---|---|---|
| Filename | modeM0/AS1C06_007T01_9000004470_30913cztM0_level2.evt | modeM0/AS1C06_007T01_9000004470_30913cztM0_level2_quad_clean.evt |
| Size (bytes) | 556,496,640 | 82,998,720 |
| Size | 530.7 MB | 79.2 MB |
| Events in quadrant A | 3,073,276 | 541,601 |
| Events in quadrant B | 5,037,243 | 538,833 |
| Events in quadrant C | 3,447,757 | 500,890 |
| Events in quadrant D | 4,871,775 | 495,394 |
| Mode M0 | |||
|---|---|---|---|
| Quadrant | BADHDUFLAG | Total packets | Discarded packets |
| A | 0 | 13360 | 1 |
| B | 0 | 19283 | 3 |
| C | 0 | 14257 | 1 |
| D | 0 | 18553 | 1 |
| Mode M9 | |||
|---|---|---|---|
| Quadrant | BADHDUFLAG | Total packets | Discarded packets |
| A | 0 | 9 | 0 |
| B | 0 | 9 | 0 |
| C | 0 | 9 | 0 |
| D | 0 | 9 | 0 |
| Mode SS | |||
|---|---|---|---|
| Quadrant | BADHDUFLAG | Total packets | Discarded packets |
| A | 0 | 128 | 0 |
| B | 0 | 128 | 0 |
| C | 0 | 128 | 0 |
| D | 0 | 128 | 0 |
| Quadrant | Total seconds | Saturated seconds | Saturation percentage |
|---|---|---|---|
| A | 6246 | 91 | 1.456932% |
| B | 6246 | 74 | 1.184758% |
| C | 6246 | 515 | 8.245277% |
| D | 6246 | 334 | 5.347422% |
Noise dominated data is calculated using 1-second bins in cleaned event files. If a bin has >2000 counts, and if more than 50% of those come from <1% of pixels, then it is considered to be noise-dominated and hence unusable.
| Quadrant | # 1 sec bins | Bins with >0 counts | Bins with >2000 counts | High rate bins dominated by noise | Noise dominated (total time) | Noise dominated (detector-on time) | Marked lightcurve |
|---|---|---|---|---|---|---|---|
| A | 7166 | 6246 | 40 | 40 | 0.56% | 0.64% | 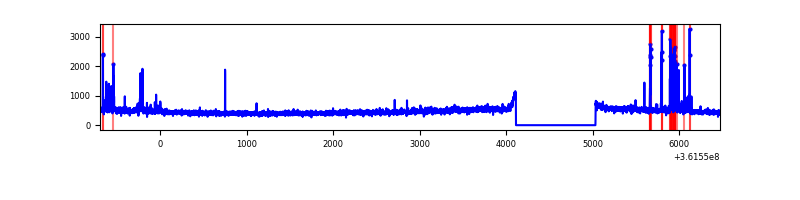 |
| B | 7166 | 6246 | 5 | 5 | 0.07% | 0.08% | 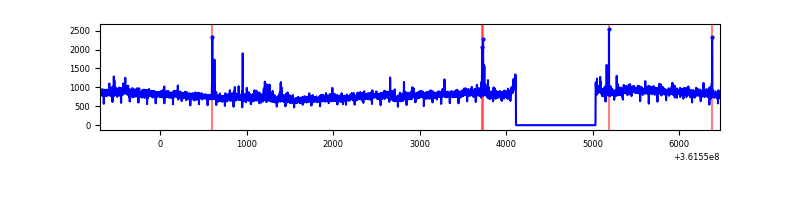 |
| C | 7166 | 6246 | 46 | 46 | 0.64% | 0.74% |  |
| D | 7165 | 6245 | 288 | 288 | 4.02% | 4.61% | 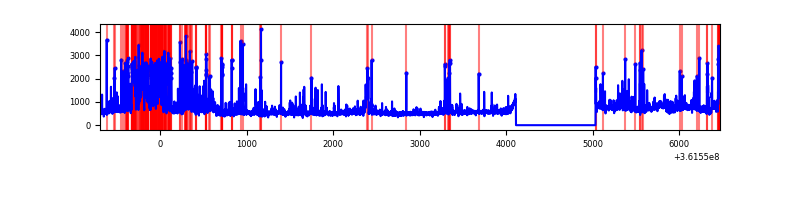 |
Top three noisy pixels from each quadrant. If the there are fewer than three noisy pixels in the level2.evt file, extra rows are filled as -1
| Pixel properties | Quadrant properties | ||||||
|---|---|---|---|---|---|---|---|
| Quadrant | DetID | PixID | Counts | Sigma | Mean | Median | Sigma |
| A | 0 | 13 | 202458 | 1354.65 | 741 | 726 | 148.9 |
| A | 13 | 254 | 12510 | 79.13 | 741 | 726 | 148.9 |
| A | 3 | 137 | 7240 | 43.74 | 741 | 726 | 148.9 |
| B | 6 | 159 | 1977650 | 14088.78 | 737 | 717 | 140.3 |
| B | 0 | 190 | 53383 | 375.33 | 737 | 717 | 140.3 |
| B | 6 | 36 | 43526 | 305.08 | 737 | 717 | 140.3 |
| C | 14 | 238 | 242053 | 1484.61 | 691 | 696 | 162.6 |
| C | 0 | 10 | 208991 | 1281.24 | 691 | 696 | 162.6 |
| C | 14 | 254 | 185380 | 1136.01 | 691 | 696 | 162.6 |
| D | 8 | 195 | 853747 | 4955.92 | 713 | 693 | 172.1 |
| D | 12 | 233 | 798271 | 4633.62 | 713 | 693 | 172.1 |
| D | 7 | 69 | 127402 | 736.13 | 713 | 693 | 172.1 |
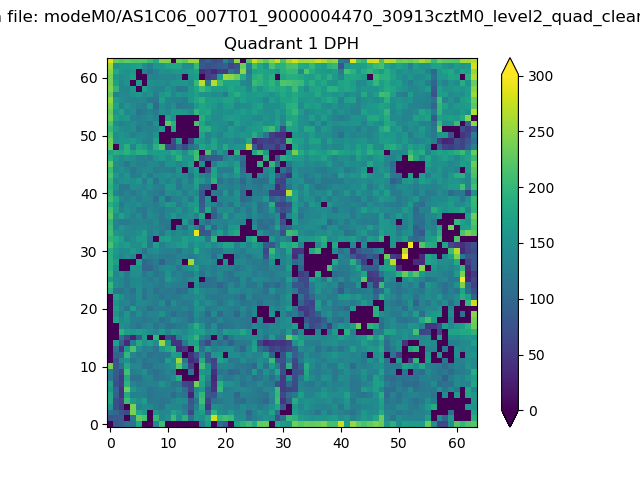
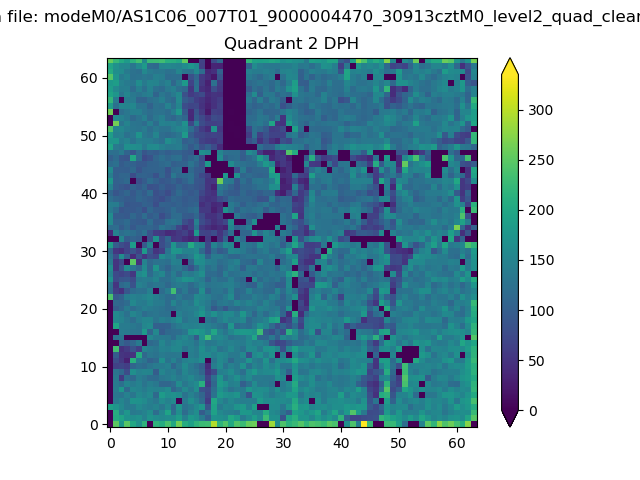
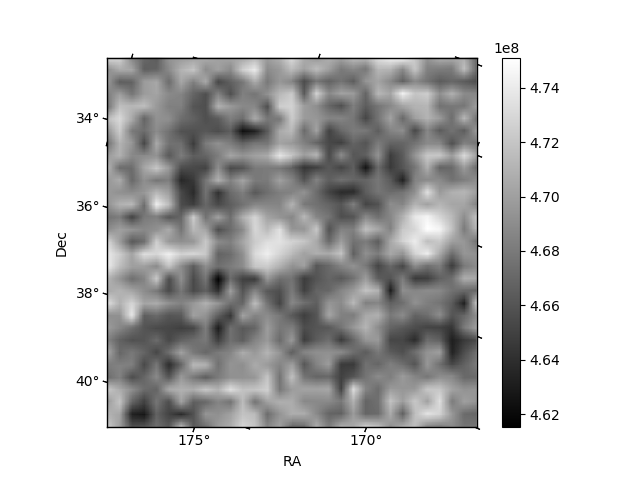
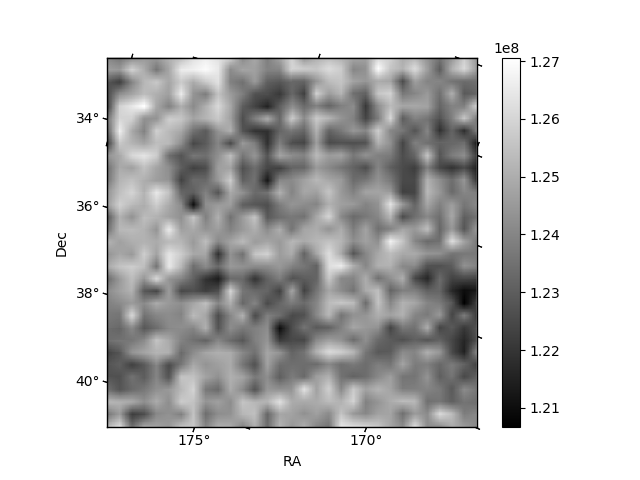
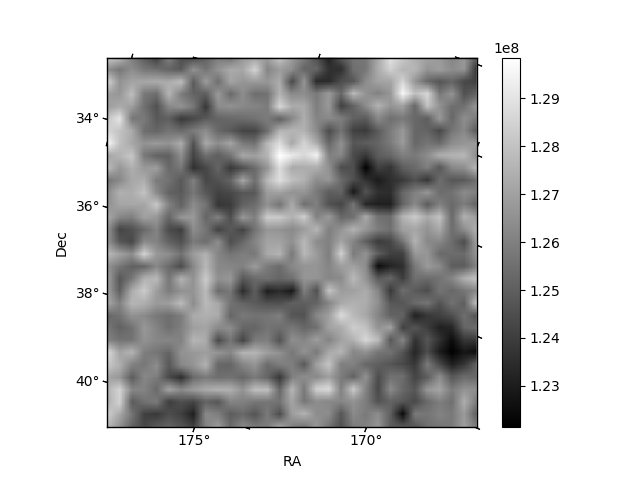
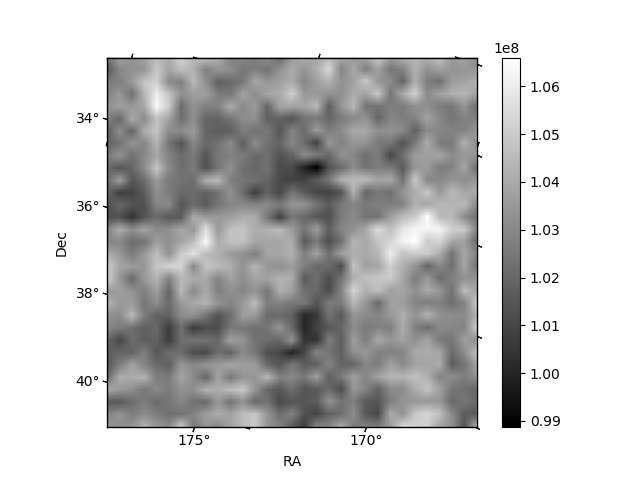
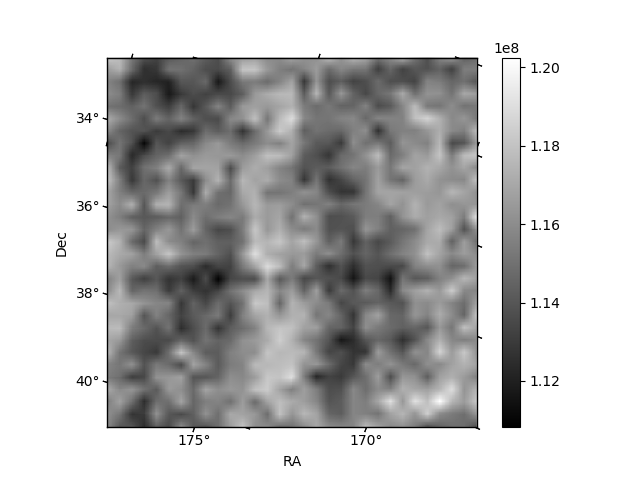
Histogram calculated using DETX and DETY for each event in the final _common_clean file
| Quadrant A | 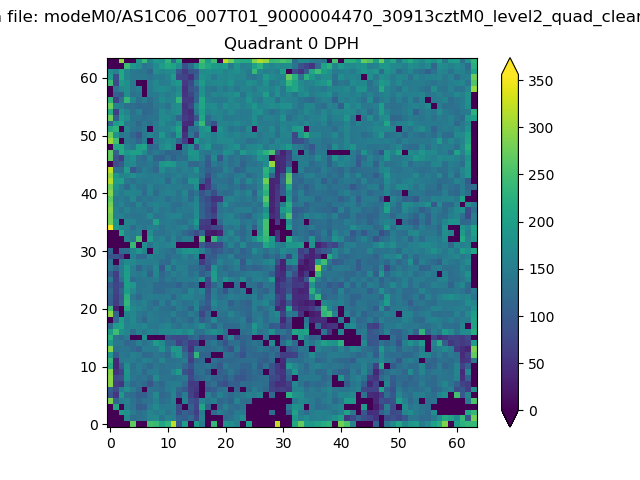 |
 |
Quadrant B |
|---|---|---|---|
| Quadrant D | 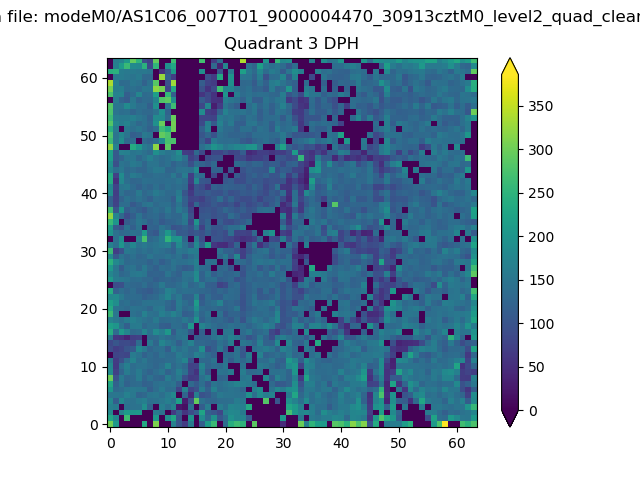 |
 |
Quadrant C |
| Plot type | Count rate plots | Images |
|---|---|---|
| Comparison with Poisson distribution Blue bars denote a histogram of data divided into 1 sec bins. Red curve is a Poisson curve with rate = median count rate of data. |
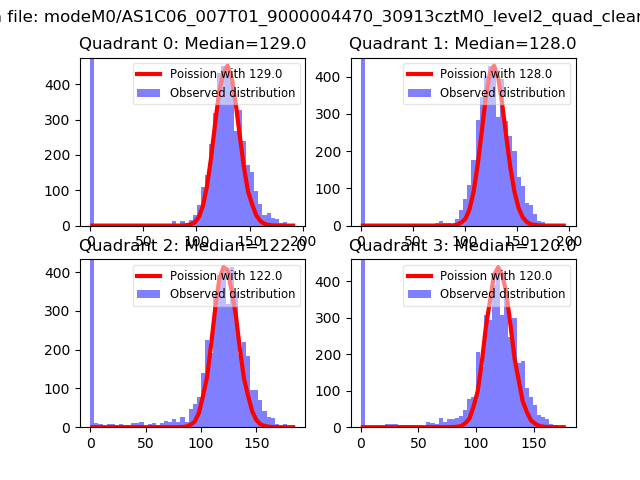 |
 |
| Quadrant-wise count rates Data is divided into 100 sec bins |
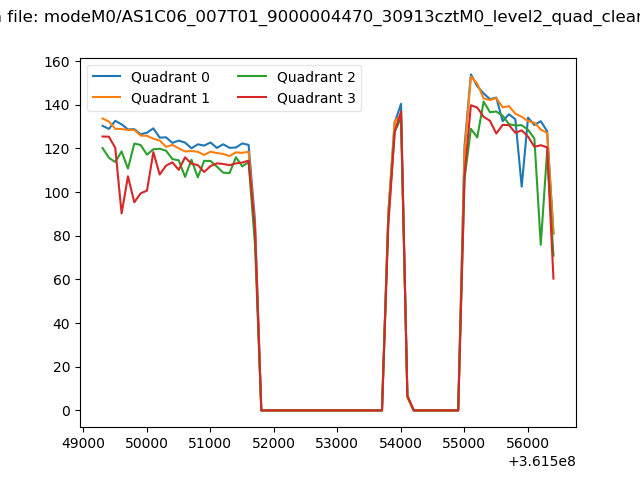 |
|
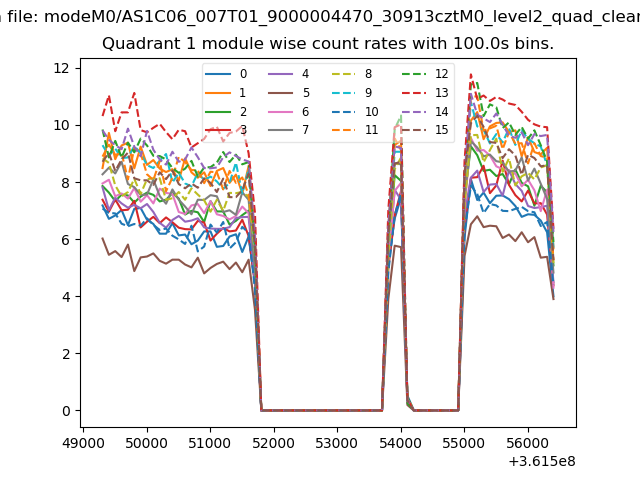
| Module-wise count rates for Quadrant A Data is divided into 100 sec bins |
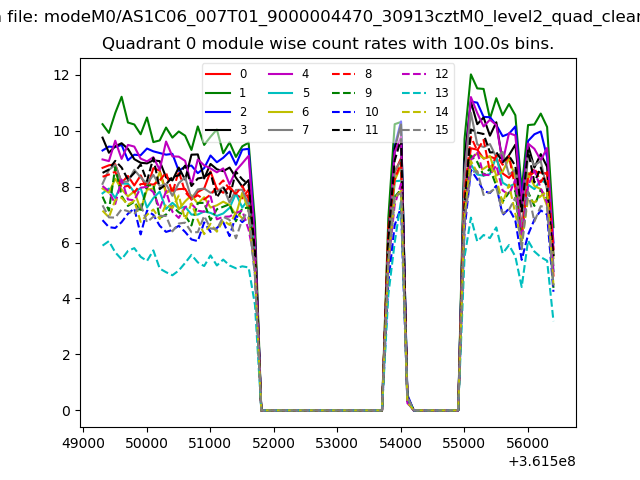 |
 |
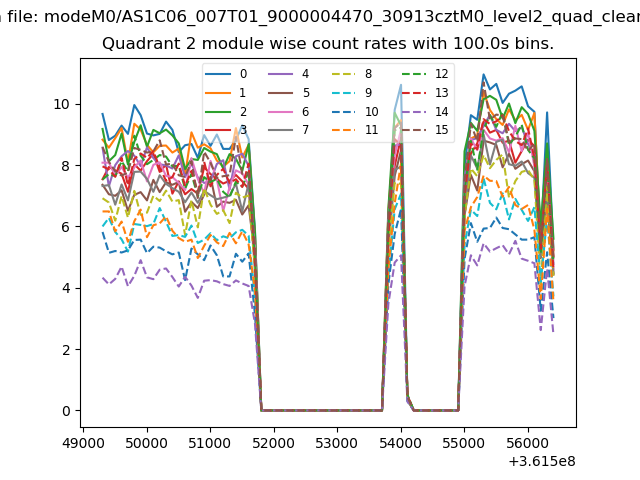
| Module-wise count rates for Quadrant B Data is divided into 100 sec bins |
 |
 |
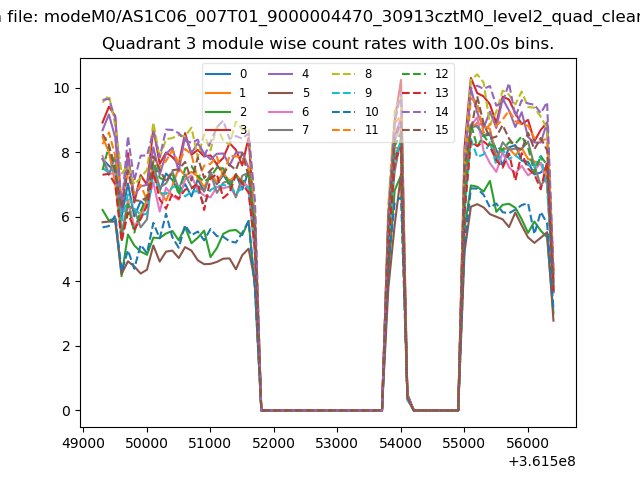
| Module-wise count rates for Quadrant C Data is divided into 100 sec bins |
 |
 |
| Module-wise count rates for Quadrant D Data is divided into 100 sec bins |
 |
 |
| Parameter | Plot |
|---|---|
| CZT HV Monitor | 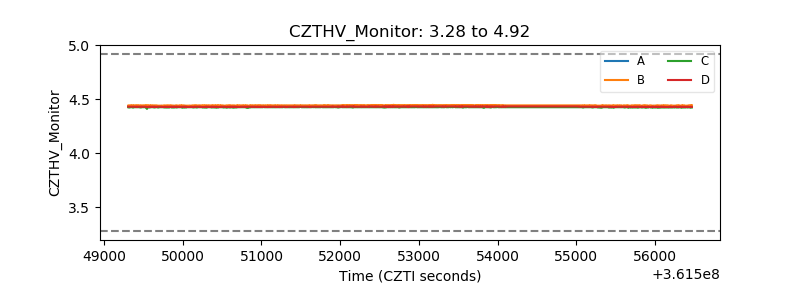 |
| D_VDD | 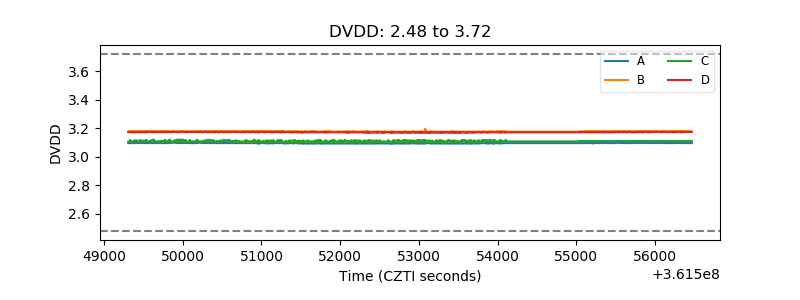 |
| Temperature 1 | 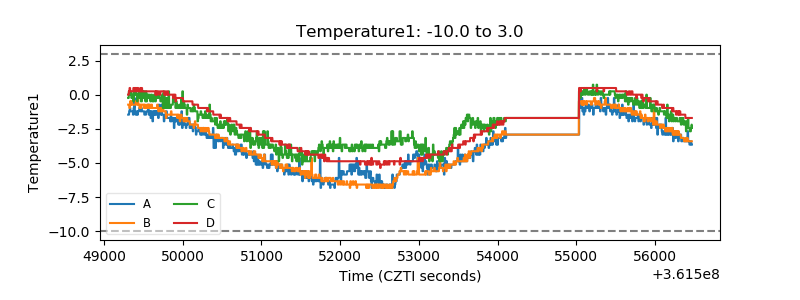 |
| Veto HV Monitor | 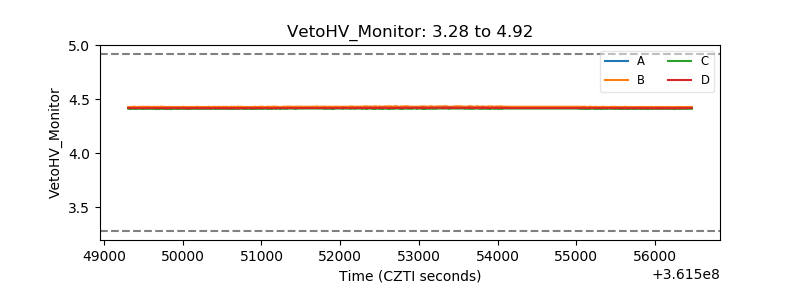 |
| Veto LLD | 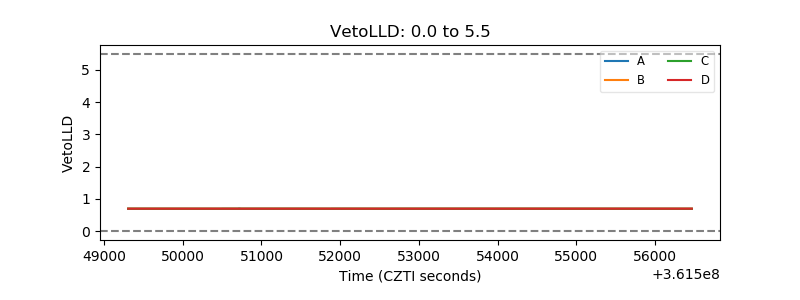 |
| Alpha Counter | 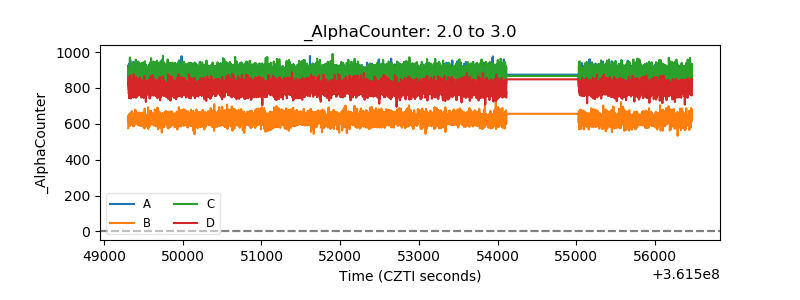 |
| _CPM_Rate | 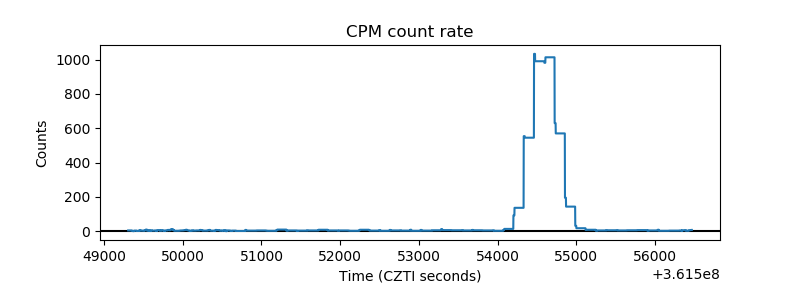 |
| CZT Counter | 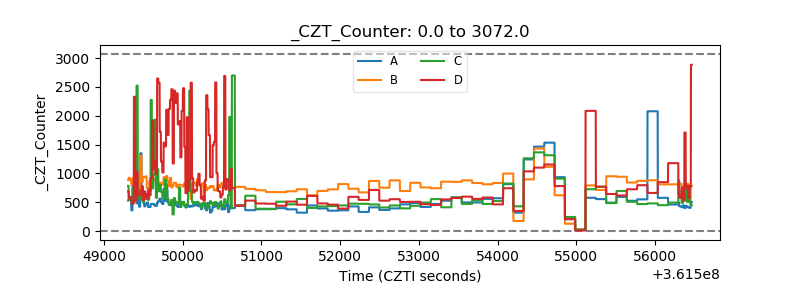 |
| +2.5 Volts monitor |  |
| +5 Volts monitor |  |
| _ROLL_ROT |  |
| _Roll_DEC | 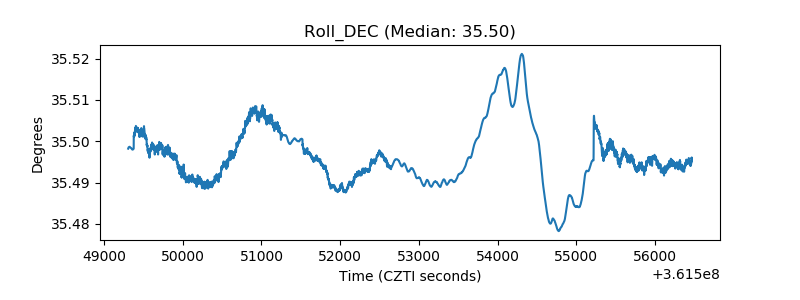 |
| _Roll_RA | 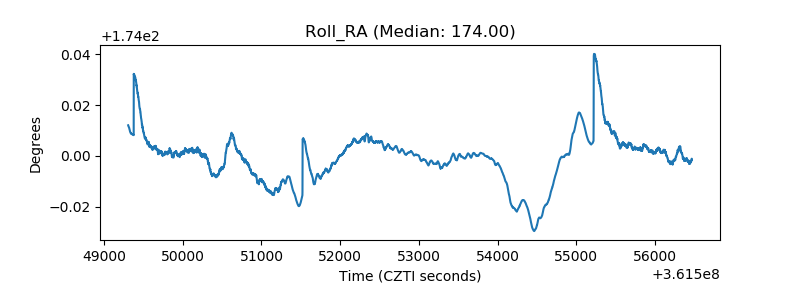 |
| Veto Counter |  |