| Param | Original file | Final file |
|---|---|---|
| Filename | modeM0/AS1C06_007T01_9000004470_30914cztM0_level2.evt | modeM0/AS1C06_007T01_9000004470_30914cztM0_level2_quad_clean.evt |
| Size (bytes) | 613,448,640 | 92,617,920 |
| Size | 585.0 MB | 88.3 MB |
| Events in quadrant A | 3,799,067 | 604,140 |
| Events in quadrant B | 5,531,931 | 617,366 |
| Events in quadrant C | 3,560,616 | 568,252 |
| Events in quadrant D | 5,243,948 | 558,054 |
| Mode M0 | |||
|---|---|---|---|
| Quadrant | BADHDUFLAG | Total packets | Discarded packets |
| A | 0 | 15613 | 2 |
| B | 0 | 20991 | 2 |
| C | 0 | 14841 | 2 |
| D | 0 | 20086 | 2 |
| Mode M9 | |||
|---|---|---|---|
| Quadrant | BADHDUFLAG | Total packets | Discarded packets |
| A | 0 | 10 | 0 |
| B | 0 | 10 | 0 |
| C | 0 | 10 | 0 |
| D | 0 | 10 | 0 |
| Mode SS | |||
|---|---|---|---|
| Quadrant | BADHDUFLAG | Total packets | Discarded packets |
| A | 0 | 134 | 0 |
| B | 0 | 134 | 0 |
| C | 0 | 134 | 0 |
| D | 0 | 134 | 0 |
| Quadrant | Total seconds | Saturated seconds | Saturation percentage |
|---|---|---|---|
| A | 6544 | 263 | 4.018949% |
| B | 6544 | 102 | 1.558680% |
| C | 6545 | 550 | 8.403361% |
| D | 6545 | 296 | 4.522536% |
Noise dominated data is calculated using 1-second bins in cleaned event files. If a bin has >2000 counts, and if more than 50% of those come from <1% of pixels, then it is considered to be noise-dominated and hence unusable.
| Quadrant | # 1 sec bins | Bins with >0 counts | Bins with >2000 counts | High rate bins dominated by noise | Noise dominated (total time) | Noise dominated (detector-on time) | Marked lightcurve |
|---|---|---|---|---|---|---|---|
| A | 7579 | 6544 | 161 | 161 | 2.12% | 2.46% | 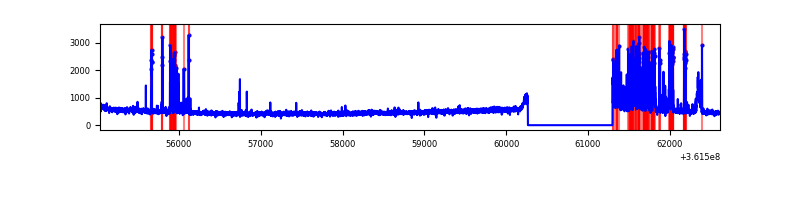 |
| B | 7579 | 6544 | 5 | 5 | 0.07% | 0.08% | 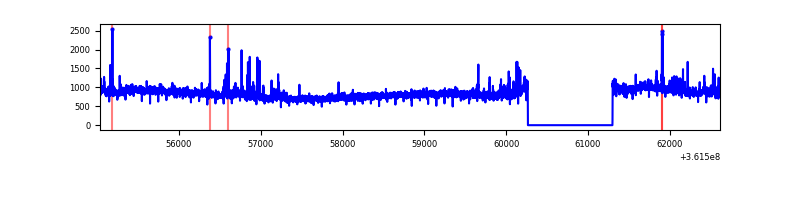 |
| C | 7580 | 6545 | 18 | 18 | 0.24% | 0.28% | 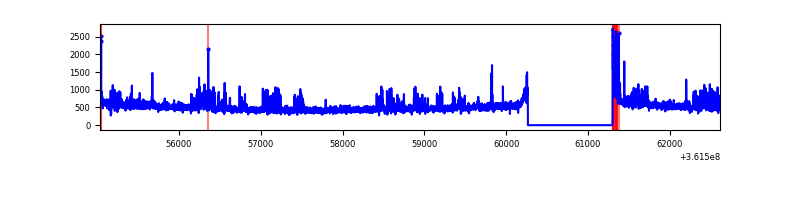 |
| D | 7580 | 6545 | 186 | 186 | 2.45% | 2.84% | 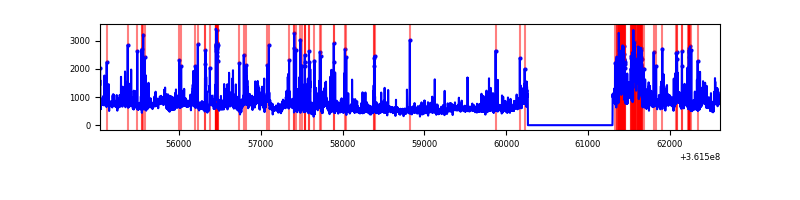 |
Top three noisy pixels from each quadrant. If the there are fewer than three noisy pixels in the level2.evt file, extra rows are filled as -1
| Pixel properties | Quadrant properties | ||||||
|---|---|---|---|---|---|---|---|
| Quadrant | DetID | PixID | Counts | Sigma | Mean | Median | Sigma |
| A | 0 | 13 | 678464 | 4188.17 | 794 | 776 | 161.8 |
| A | 11 | 47 | 53181 | 323.87 | 794 | 776 | 161.8 |
| A | 13 | 254 | 12420 | 71.96 | 794 | 776 | 161.8 |
| B | 6 | 159 | 2153214 | 14332.8 | 799 | 779 | 150.2 |
| B | 0 | 183 | 60464 | 397.44 | 799 | 779 | 150.2 |
| B | 0 | 190 | 58103 | 381.71 | 799 | 779 | 150.2 |
| C | 14 | 238 | 244715 | 1389.95 | 748 | 753 | 175.5 |
| C | 14 | 254 | 178387 | 1012.06 | 748 | 753 | 175.5 |
| C | 0 | 10 | 110482 | 625.17 | 748 | 753 | 175.5 |
| D | 8 | 195 | 1042612 | 5672.03 | 765 | 745 | 183.7 |
| D | 12 | 218 | 527971 | 2870.27 | 765 | 745 | 183.7 |
| D | 12 | 233 | 230152 | 1248.91 | 765 | 745 | 183.7 |
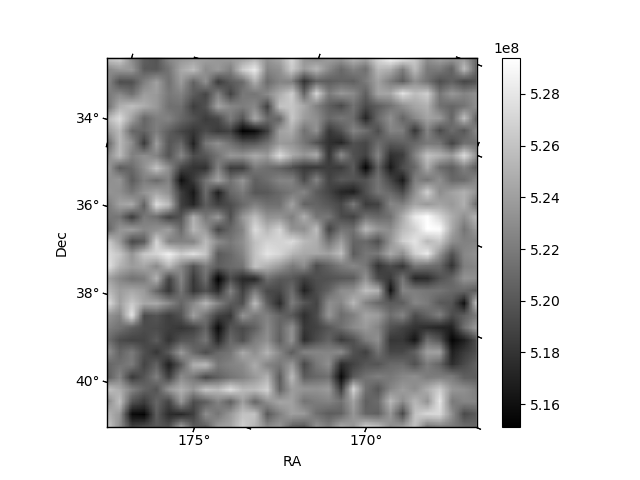
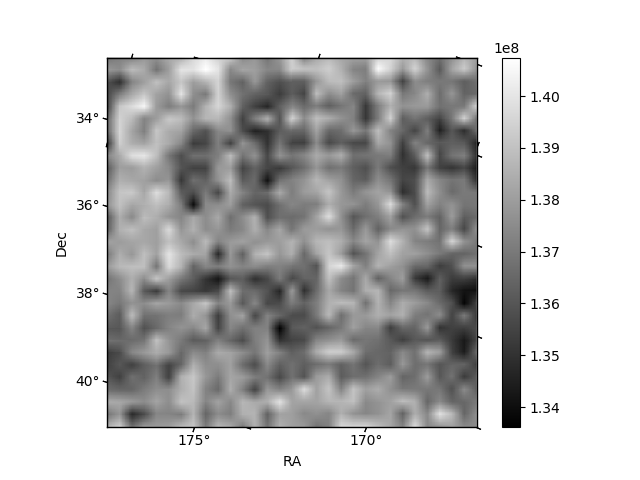
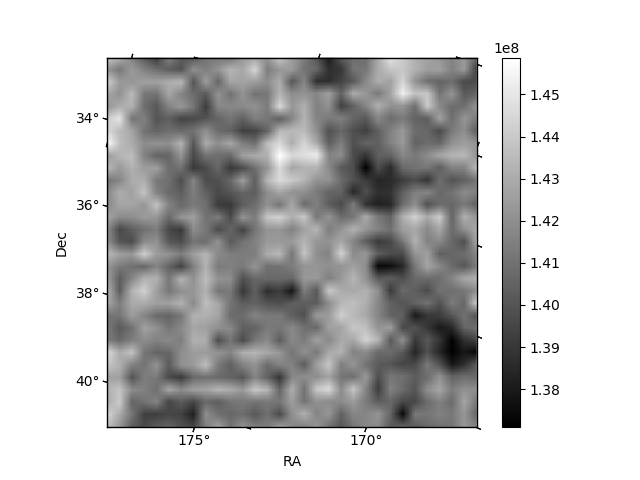
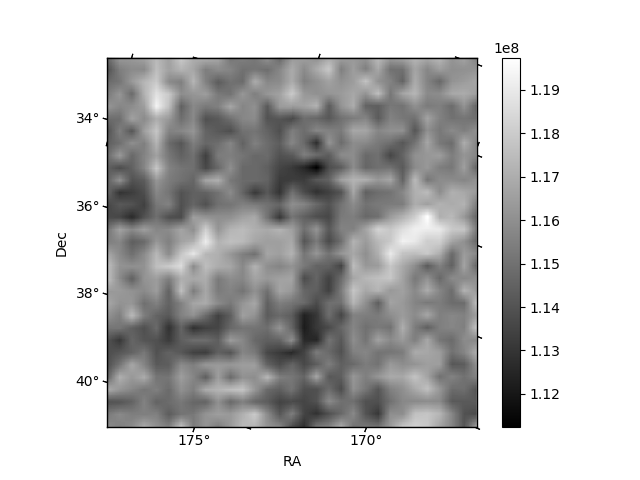
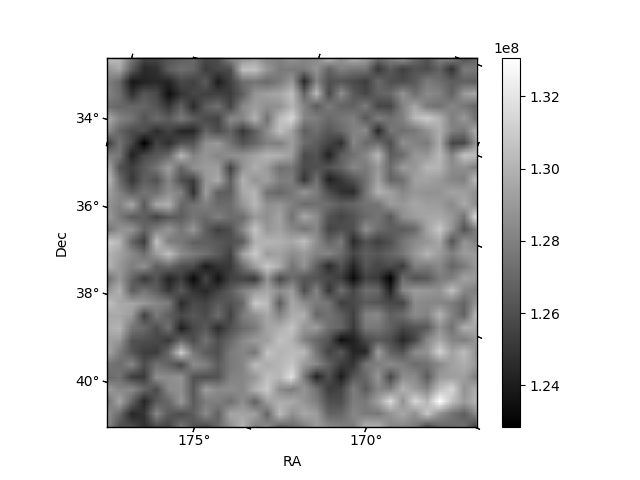
Histogram calculated using DETX and DETY for each event in the final _common_clean file
| Quadrant A | 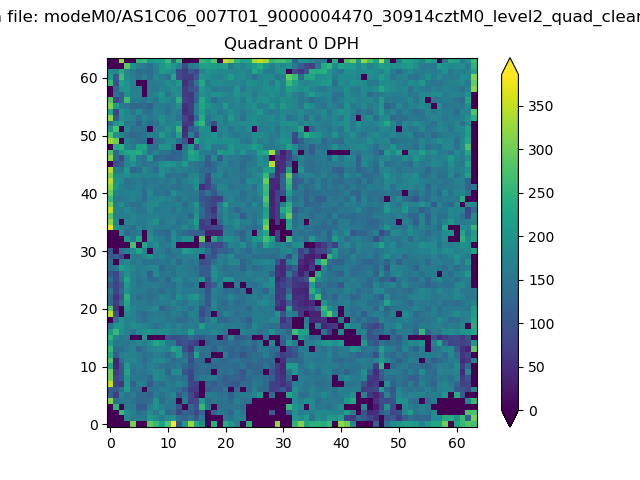 |
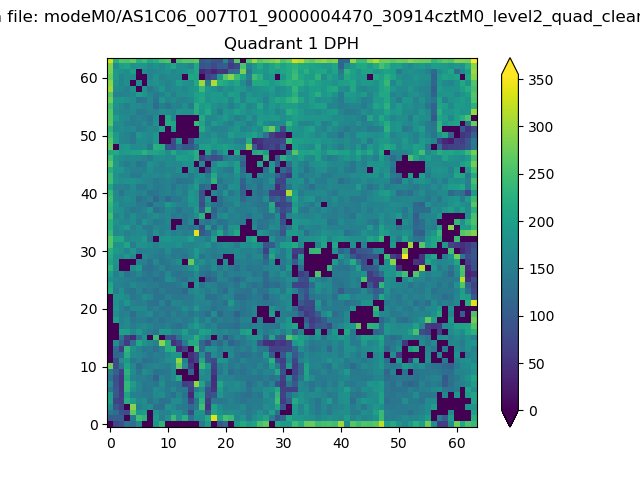 |
Quadrant B |
|---|---|---|---|
| Quadrant D | 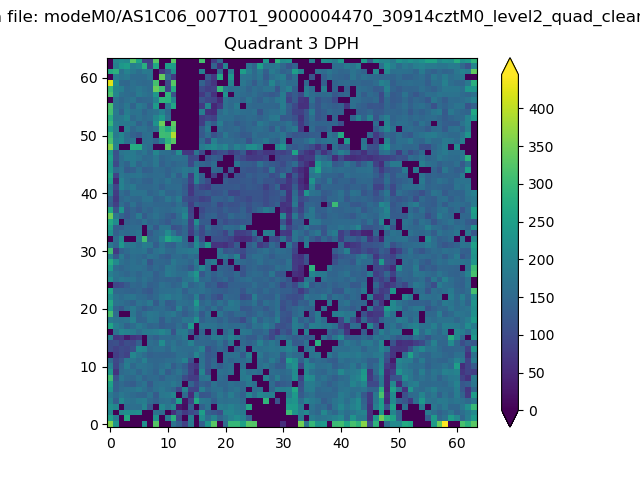 |
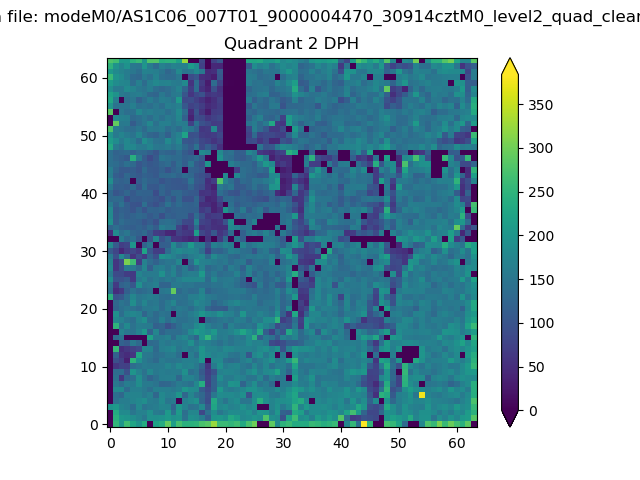 |
Quadrant C |
| Plot type | Count rate plots | Images |
|---|---|---|
| Comparison with Poisson distribution Blue bars denote a histogram of data divided into 1 sec bins. Red curve is a Poisson curve with rate = median count rate of data. |
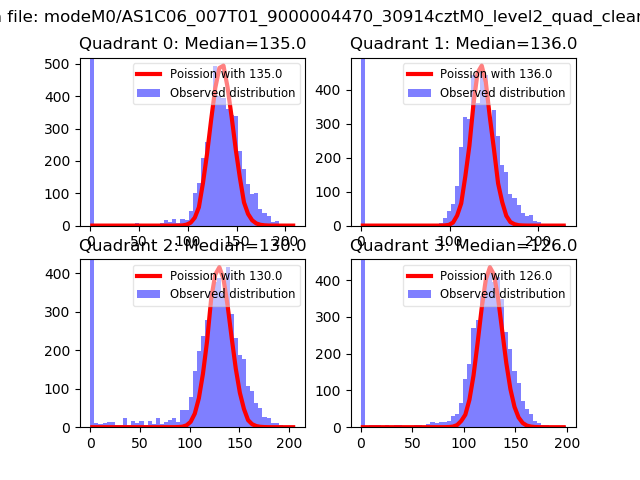 |
 |
| Quadrant-wise count rates Data is divided into 100 sec bins |
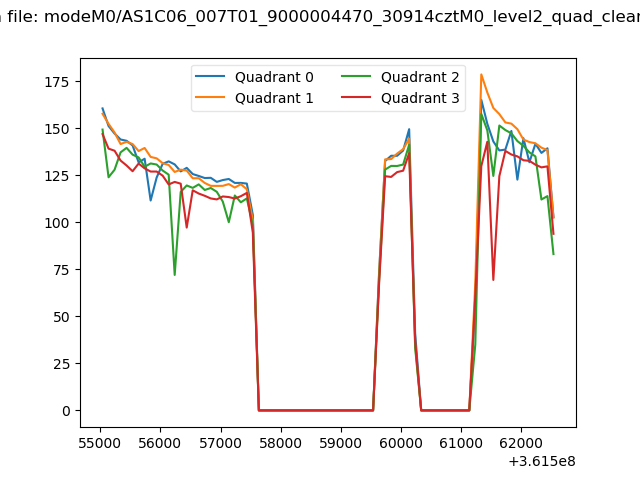 |
|
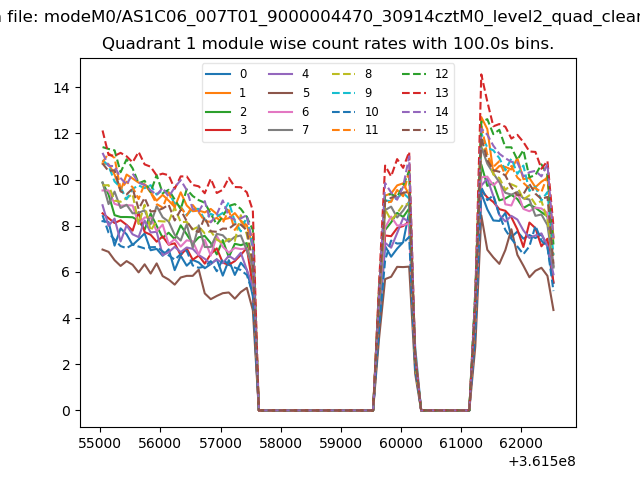
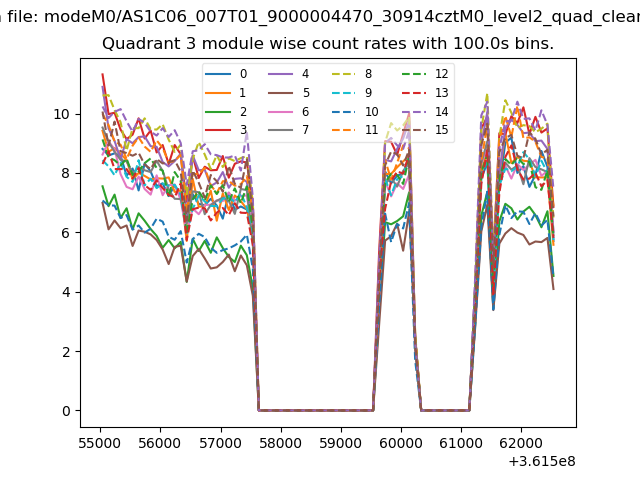
| Module-wise count rates for Quadrant A Data is divided into 100 sec bins |
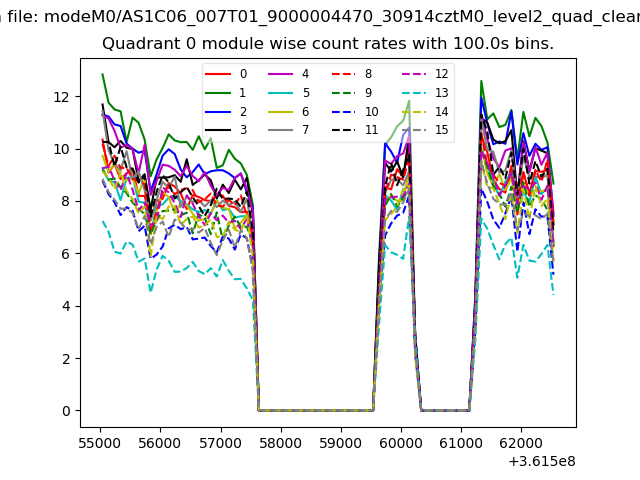 |
 |
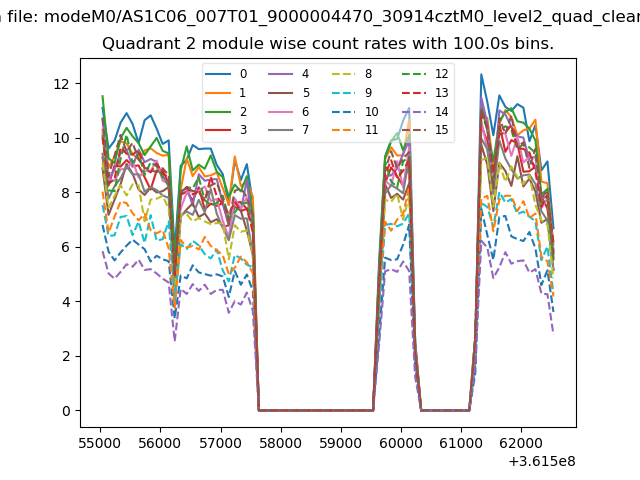
| Module-wise count rates for Quadrant B Data is divided into 100 sec bins |
 |
 |
| Module-wise count rates for Quadrant C Data is divided into 100 sec bins |
 |
 |
| Module-wise count rates for Quadrant D Data is divided into 100 sec bins |
 |
 |
| Parameter | Plot |
|---|---|
| CZT HV Monitor | 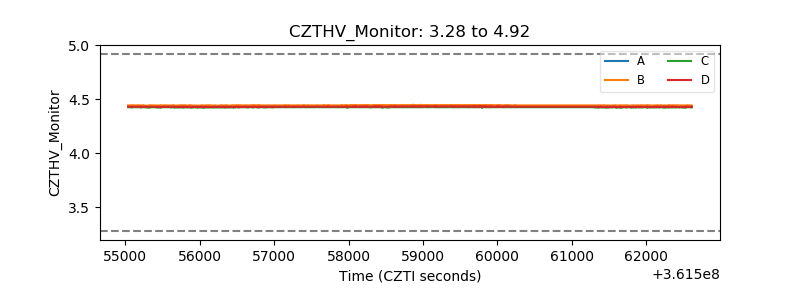 |
| D_VDD | 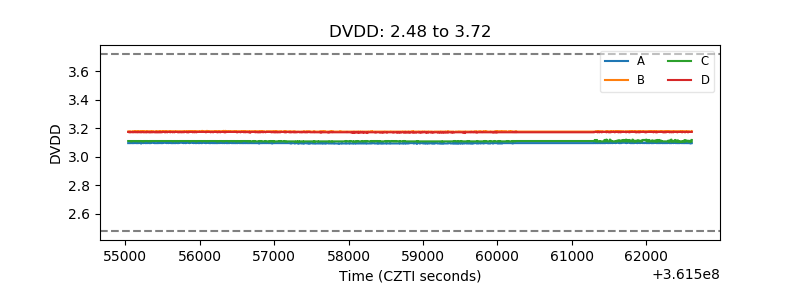 |
| Temperature 1 | 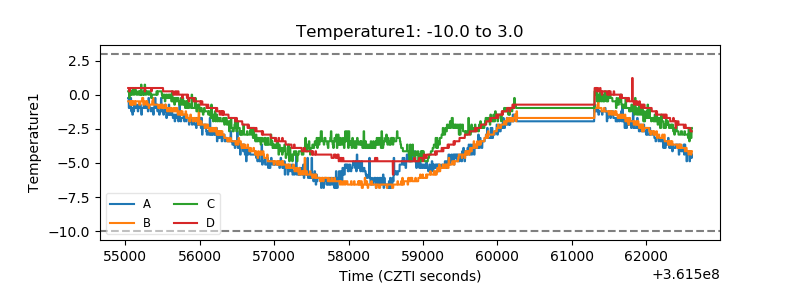 |
| Veto HV Monitor |  |
| Veto LLD | 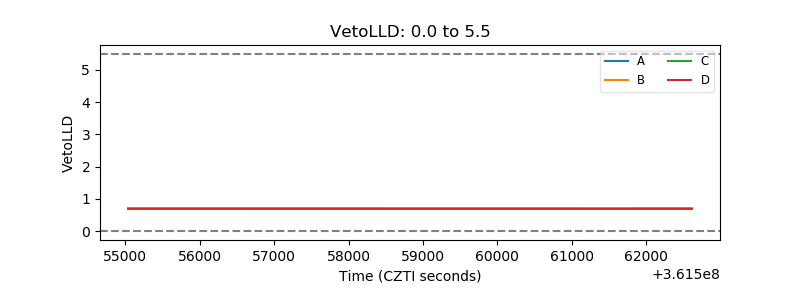 |
| Alpha Counter | 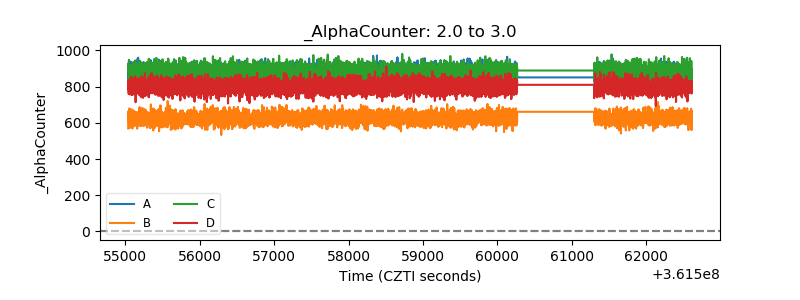 |
| _CPM_Rate | 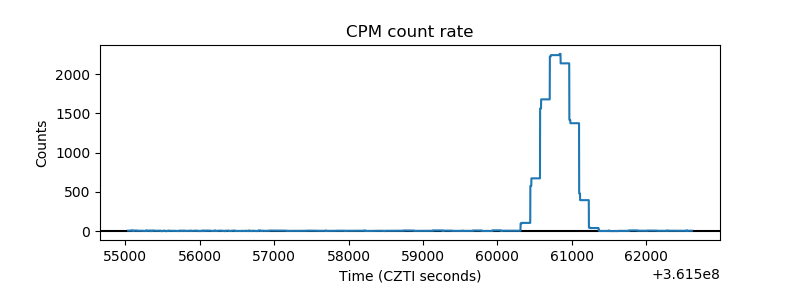 |
| CZT Counter | 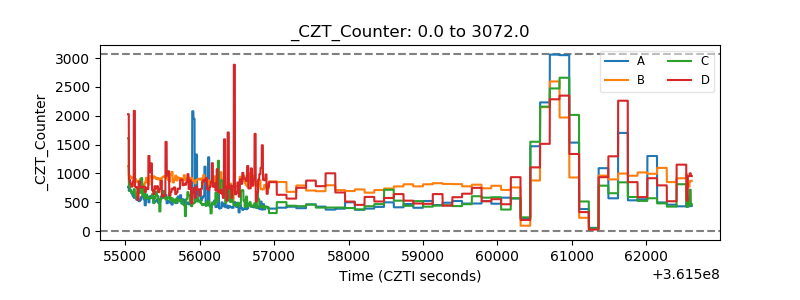 |
| +2.5 Volts monitor |  |
| +5 Volts monitor |  |
| _ROLL_ROT | 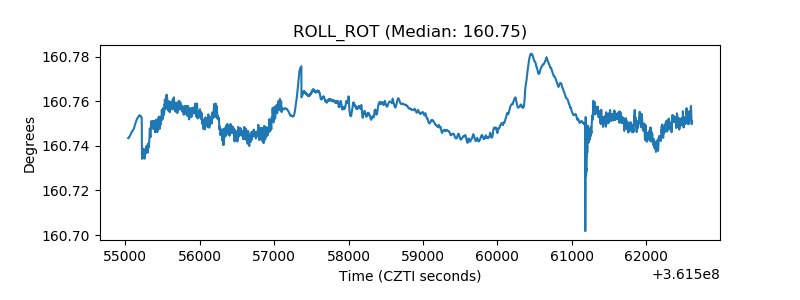 |
| _Roll_DEC | 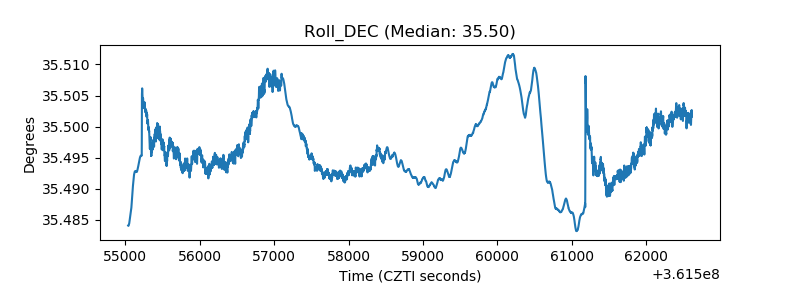 |
| _Roll_RA | 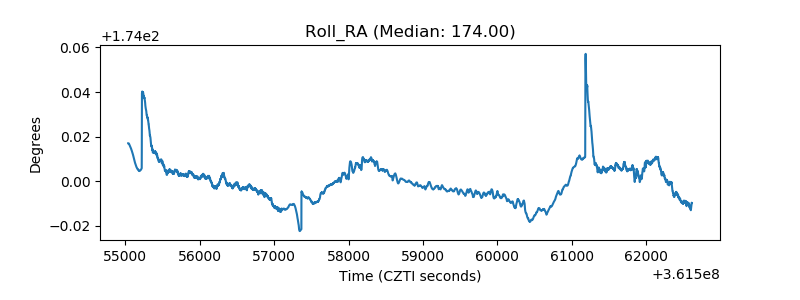 |
| Veto Counter | 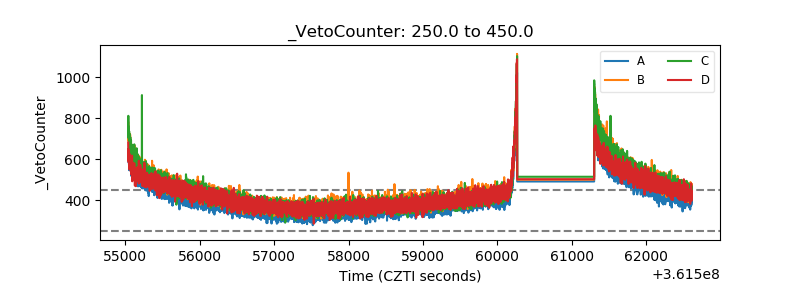 |