| Param | Original file | Final file |
|---|---|---|
| Filename | modeM0/AS1C06_007T01_9000004470_30916cztM0_level2.evt | modeM0/AS1C06_007T01_9000004470_30916cztM0_level2_quad_clean.evt |
| Size (bytes) | 580,429,440 | 87,264,000 |
| Size | 553.5 MB | 83.2 MB |
| Events in quadrant A | 3,315,297 | 578,061 |
| Events in quadrant B | 5,589,100 | 583,296 |
| Events in quadrant C | 3,312,531 | 536,828 |
| Events in quadrant D | 4,951,287 | 520,806 |
| Mode M0 | |||
|---|---|---|---|
| Quadrant | BADHDUFLAG | Total packets | Discarded packets |
| A | 0 | 13854 | 1 |
| B | 0 | 20715 | 1 |
| C | 0 | 13709 | 1 |
| D | 0 | 18970 | 1 |
| Mode M9 | |||
|---|---|---|---|
| Quadrant | BADHDUFLAG | Total packets | Discarded packets |
| A | 0 | 12 | 0 |
| B | 0 | 12 | 0 |
| C | 0 | 12 | 0 |
| D | 0 | 12 | 0 |
| Mode SS | |||
|---|---|---|---|
| Quadrant | BADHDUFLAG | Total packets | Discarded packets |
| A | 0 | 122 | 0 |
| B | 0 | 122 | 0 |
| C | 0 | 122 | 0 |
| D | 0 | 122 | 0 |
| Quadrant | Total seconds | Saturated seconds | Saturation percentage |
|---|---|---|---|
| A | 6066 | 126 | 2.077151% |
| B | 6067 | 101 | 1.664744% |
| C | 6067 | 492 | 8.109445% |
| D | 6067 | 260 | 4.285479% |
Noise dominated data is calculated using 1-second bins in cleaned event files. If a bin has >2000 counts, and if more than 50% of those come from <1% of pixels, then it is considered to be noise-dominated and hence unusable.
| Quadrant | # 1 sec bins | Bins with >0 counts | Bins with >2000 counts | High rate bins dominated by noise | Noise dominated (total time) | Noise dominated (detector-on time) | Marked lightcurve |
|---|---|---|---|---|---|---|---|
| A | 7246 | 6067 | 91 | 91 | 1.26% | 1.50% | 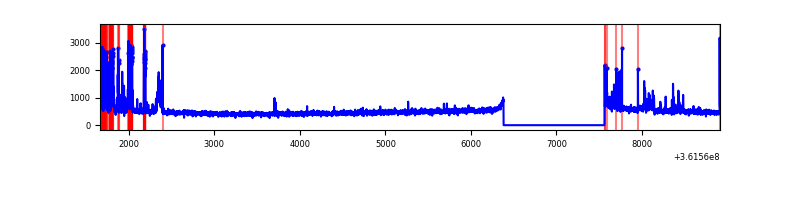 |
| B | 7247 | 6068 | 29 | 29 | 0.40% | 0.48% | 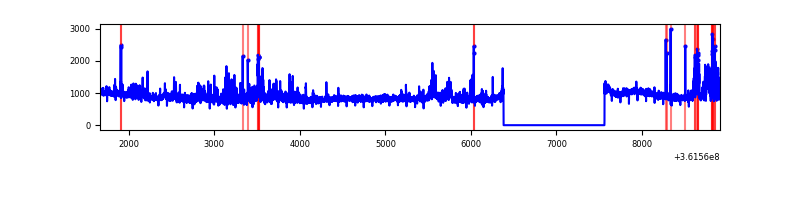 |
| C | 7247 | 6068 | 9 | 9 | 0.12% | 0.15% |  |
| D | 7247 | 6068 | 222 | 222 | 3.06% | 3.66% | 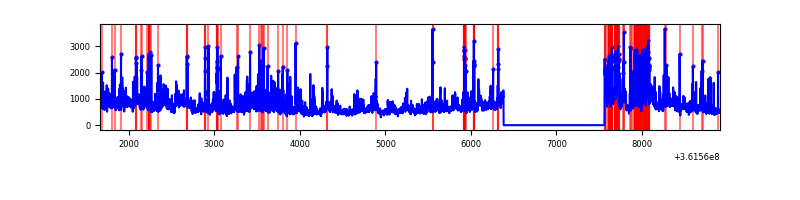 |
Top three noisy pixels from each quadrant. If the there are fewer than three noisy pixels in the level2.evt file, extra rows are filled as -1
| Pixel properties | Quadrant properties | ||||||
|---|---|---|---|---|---|---|---|
| Quadrant | DetID | PixID | Counts | Sigma | Mean | Median | Sigma |
| A | 0 | 13 | 430201 | 2858.24 | 745 | 729 | 150.3 |
| A | 13 | 254 | 12046 | 75.32 | 745 | 729 | 150.3 |
| A | 3 | 137 | 6935 | 41.3 | 745 | 729 | 150.3 |
| B | 6 | 159 | 1939267 | 13658.44 | 749 | 731 | 141.9 |
| B | 6 | 36 | 454843 | 3199.56 | 749 | 731 | 141.9 |
| B | 0 | 183 | 140297 | 983.35 | 749 | 731 | 141.9 |
| C | 14 | 238 | 229546 | 1389.94 | 703 | 707 | 164.6 |
| C | 14 | 254 | 169019 | 1022.31 | 703 | 707 | 164.6 |
| C | 0 | 10 | 98173 | 592.0 | 703 | 707 | 164.6 |
| D | 12 | 218 | 930891 | 5460.21 | 710 | 692 | 170.4 |
| D | 8 | 195 | 813350 | 4770.25 | 710 | 692 | 170.4 |
| D | 2 | 250 | 119611 | 698.05 | 710 | 692 | 170.4 |
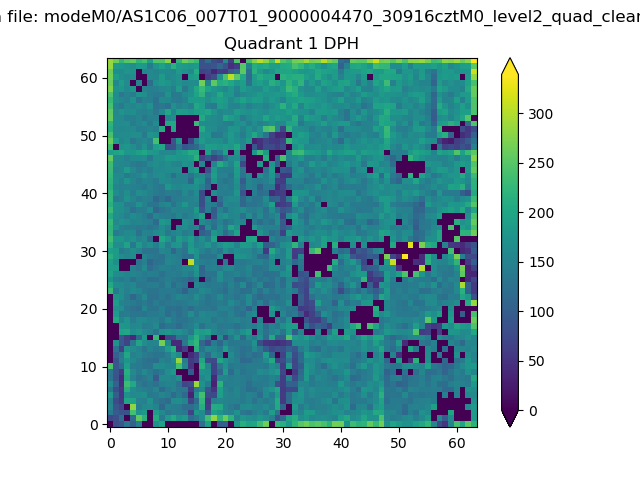
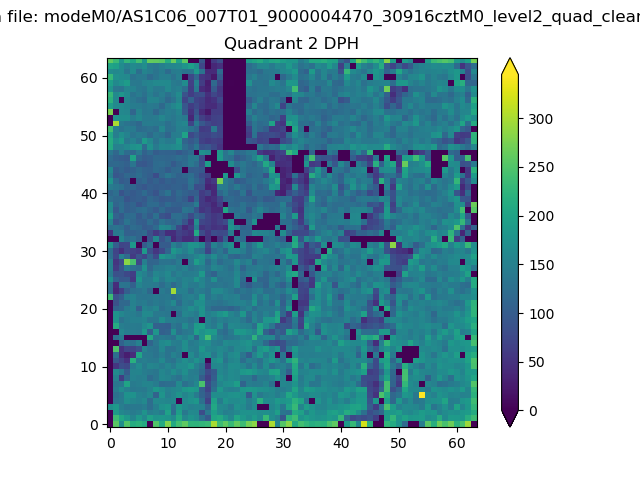
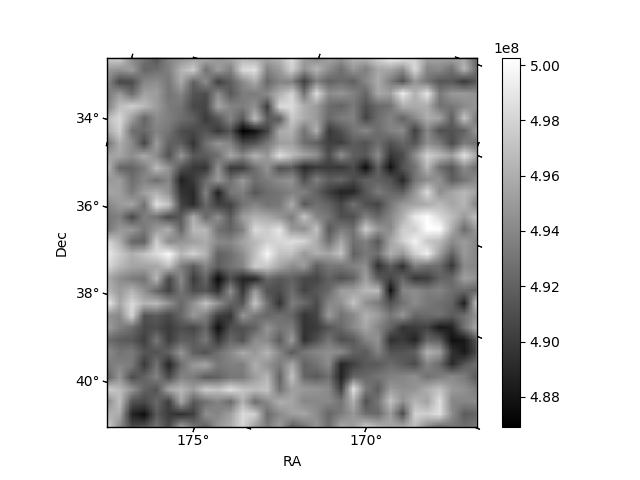
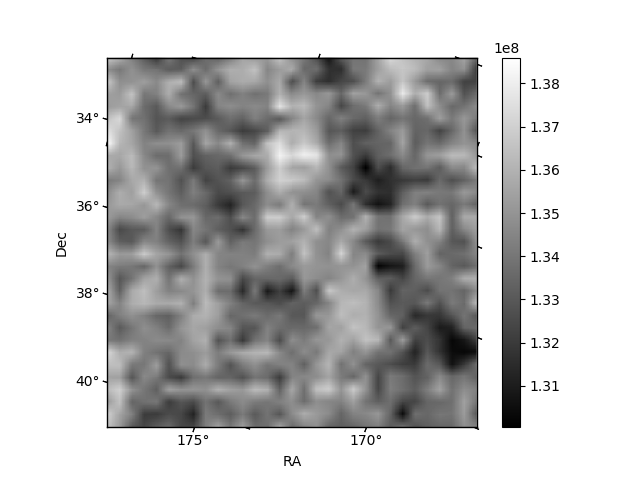
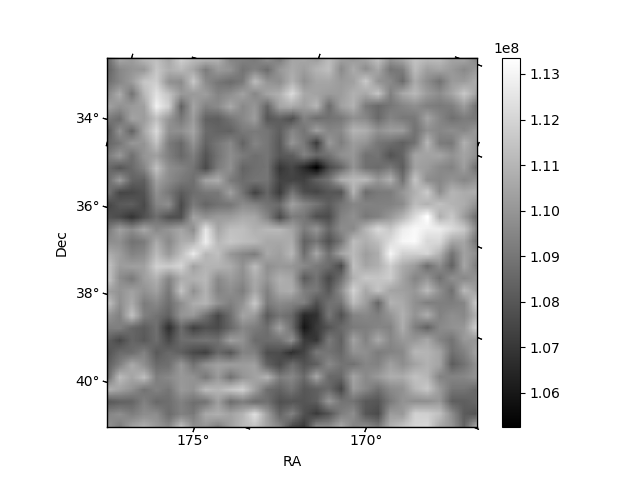
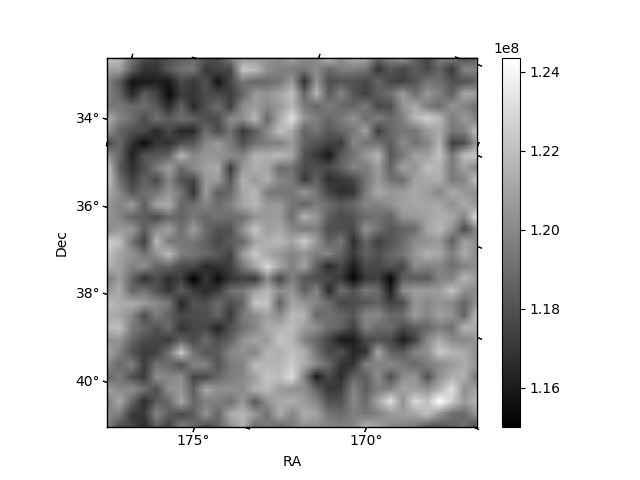
Histogram calculated using DETX and DETY for each event in the final _common_clean file
| Quadrant A | 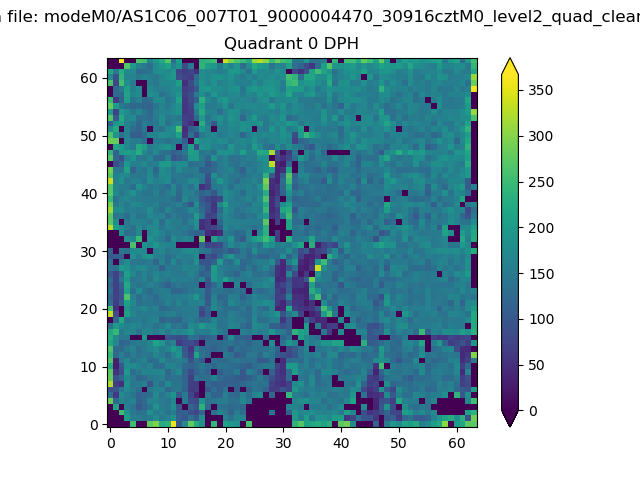 |
 |
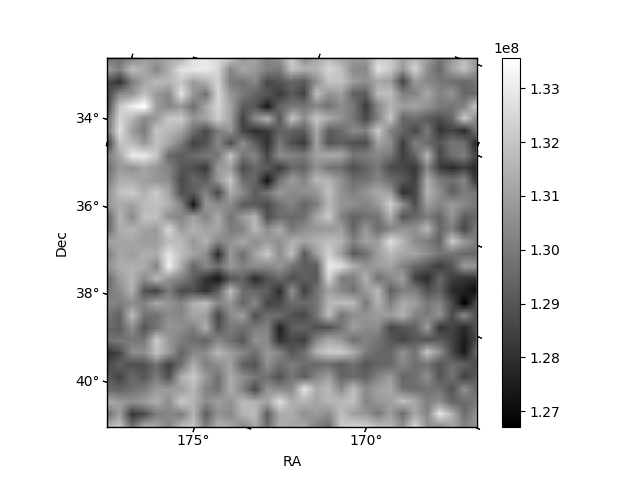
Quadrant B |
|---|---|---|---|
| Quadrant D | 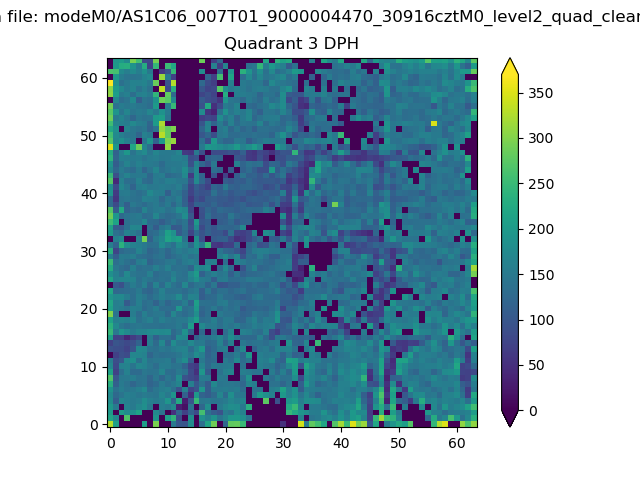 |
 |
Quadrant C |
| Plot type | Count rate plots | Images |
|---|---|---|
| Comparison with Poisson distribution Blue bars denote a histogram of data divided into 1 sec bins. Red curve is a Poisson curve with rate = median count rate of data. |
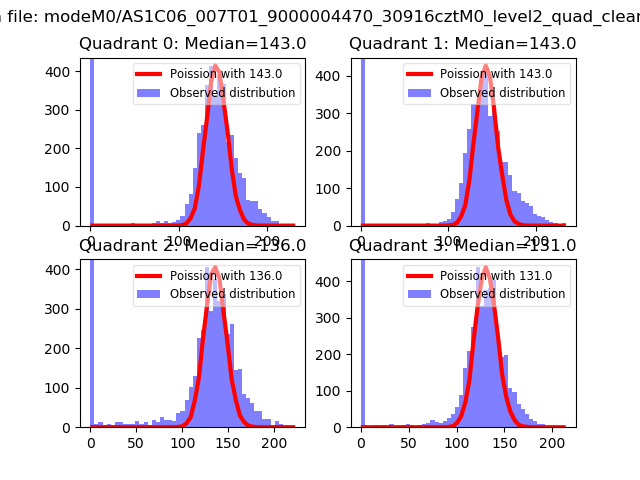 |
 |
| Quadrant-wise count rates Data is divided into 100 sec bins |
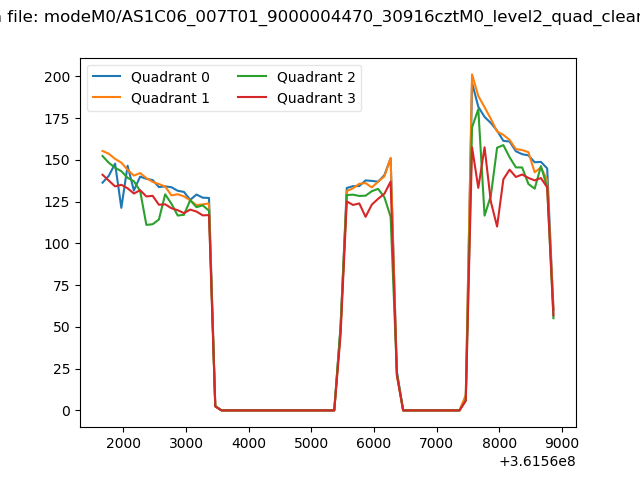 |
|
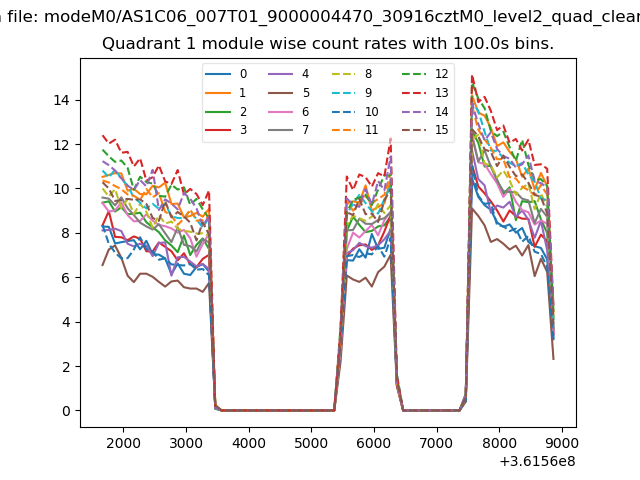
| Module-wise count rates for Quadrant A Data is divided into 100 sec bins |
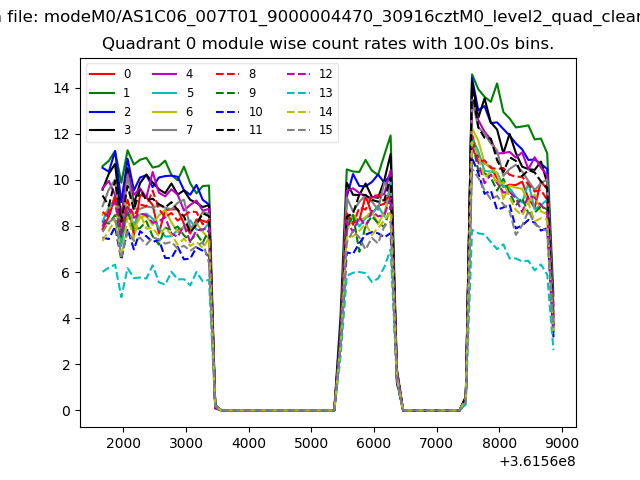 |
 |
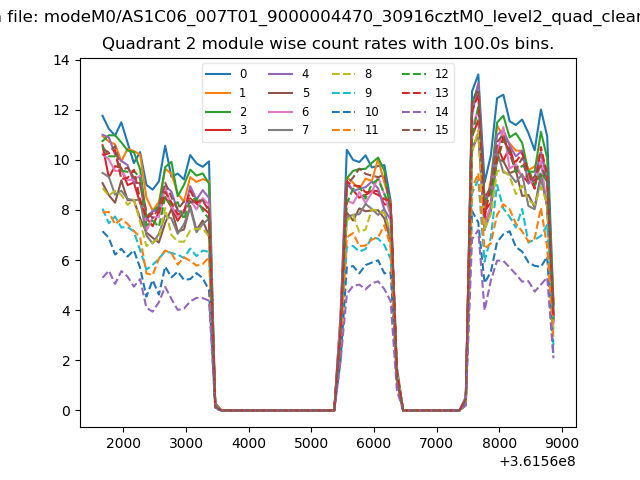
| Module-wise count rates for Quadrant B Data is divided into 100 sec bins |
 |
 |
| Module-wise count rates for Quadrant C Data is divided into 100 sec bins |
 |
 |
| Module-wise count rates for Quadrant D Data is divided into 100 sec bins |
 |
 |
| Parameter | Plot |
|---|---|
| CZT HV Monitor | 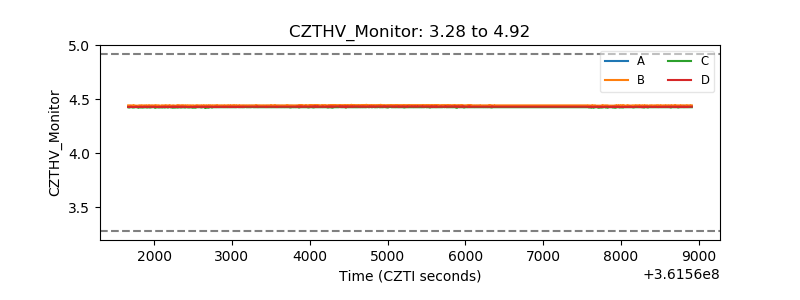 |
| D_VDD | 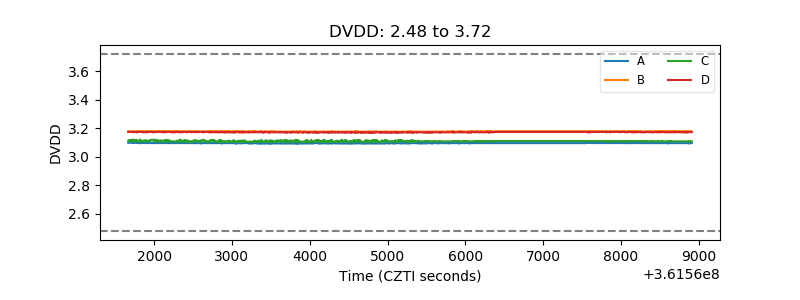 |
| Temperature 1 | 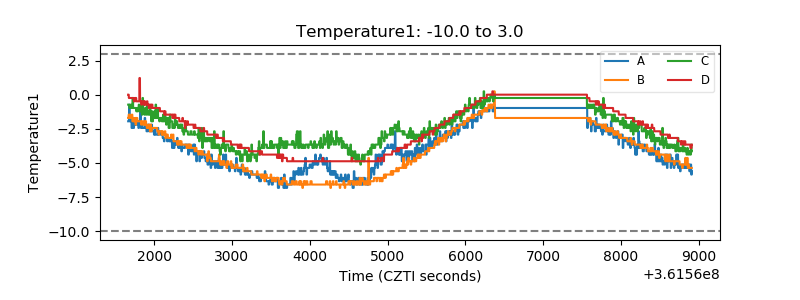 |
| Veto HV Monitor |  |
| Veto LLD | 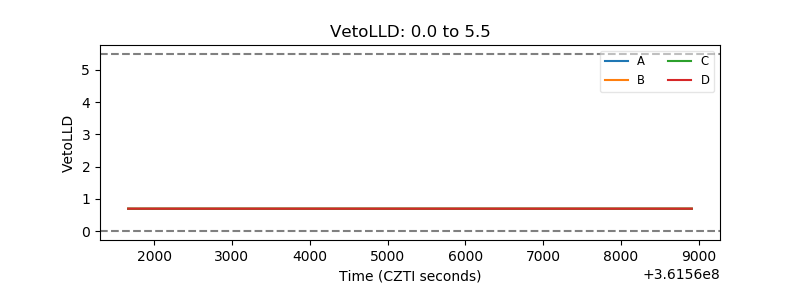 |
| Alpha Counter | 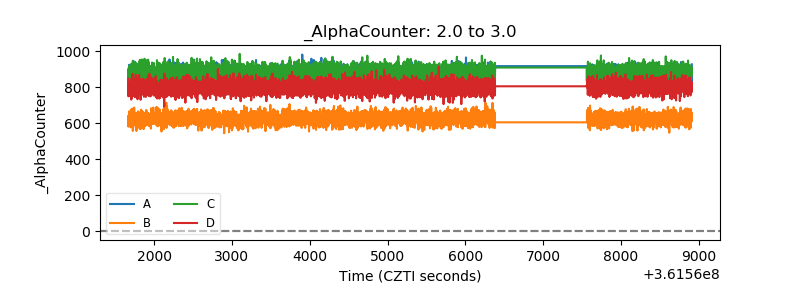 |
| _CPM_Rate | 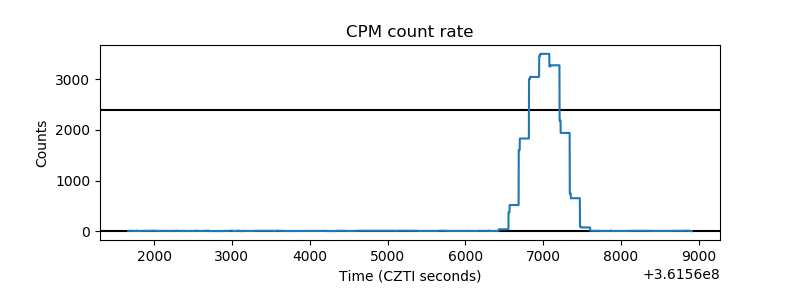 |
| CZT Counter | 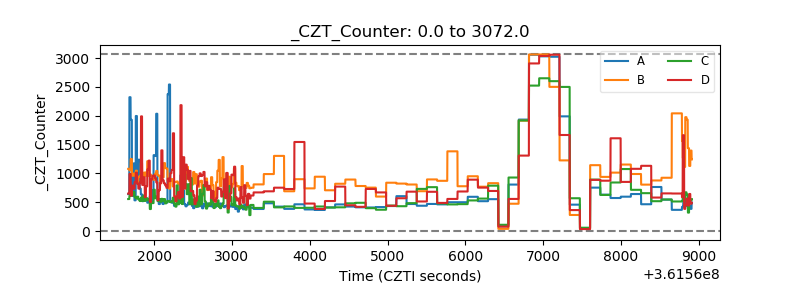 |
| +2.5 Volts monitor |  |
| +5 Volts monitor |  |
| _ROLL_ROT | 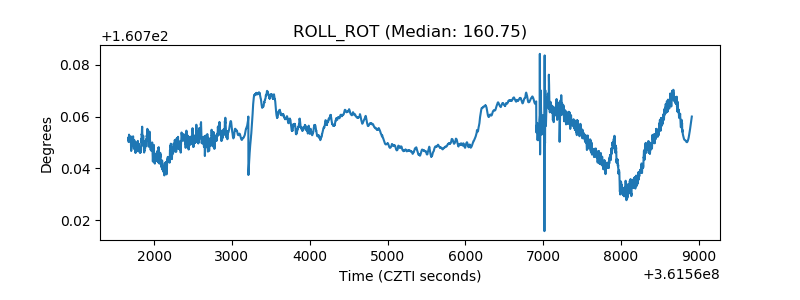 |
| _Roll_DEC | 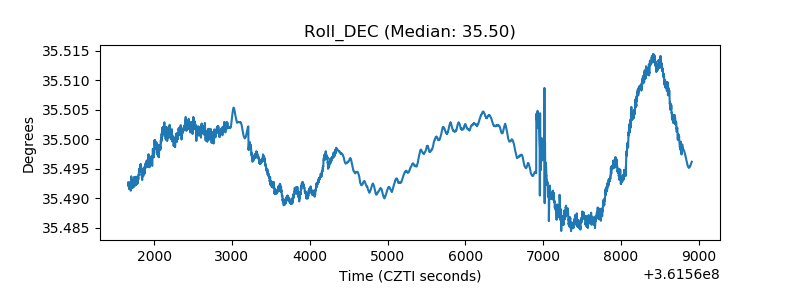 |
| _Roll_RA | 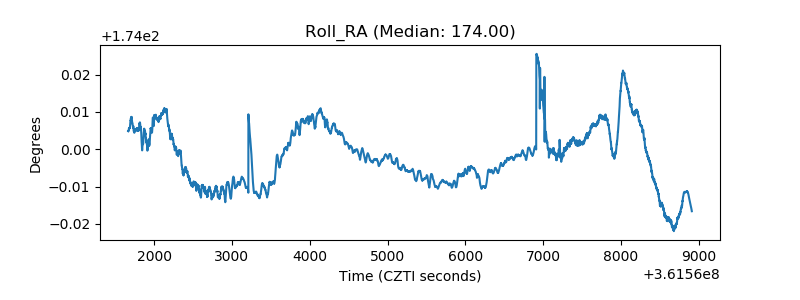 |
| Veto Counter | 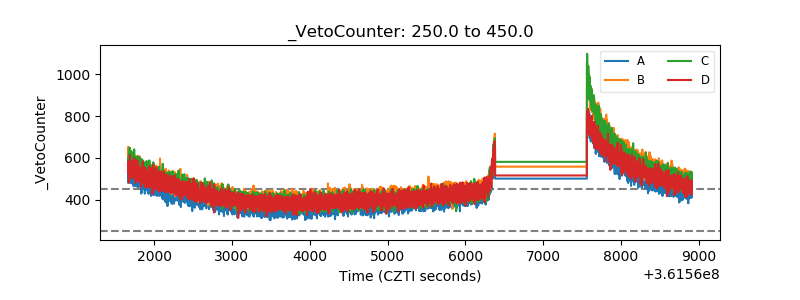 |