| Param | Original file | Final file |
|---|---|---|
| Filename | modeM0/AS1C06_007T01_9000004470_30917cztM0_level2.evt | modeM0/AS1C06_007T01_9000004470_30917cztM0_level2_quad_clean.evt |
| Size (bytes) | 655,715,520 | 97,182,720 |
| Size | 625.3 MB | 92.7 MB |
| Events in quadrant A | 3,692,495 | 655,146 |
| Events in quadrant B | 6,652,441 | 659,165 |
| Events in quadrant C | 3,596,082 | 604,759 |
| Events in quadrant D | 5,492,501 | 584,557 |
| Mode M0 | |||
|---|---|---|---|
| Quadrant | BADHDUFLAG | Total packets | Discarded packets |
| A | 0 | 14871 | 2 |
| B | 0 | 24023 | 2 |
| C | 0 | 14696 | 2 |
| D | 0 | 20643 | 2 |
| Mode M9 | |||
|---|---|---|---|
| Quadrant | BADHDUFLAG | Total packets | Discarded packets |
| A | 0 | 14 | 0 |
| B | 0 | 15 | 0 |
| C | 0 | 15 | 0 |
| D | 0 | 15 | 0 |
| Mode SS | |||
|---|---|---|---|
| Quadrant | BADHDUFLAG | Total packets | Discarded packets |
| A | 0 | 128 | 0 |
| B | 0 | 128 | 0 |
| C | 0 | 128 | 0 |
| D | 0 | 128 | 0 |
| Quadrant | Total seconds | Saturated seconds | Saturation percentage |
|---|---|---|---|
| A | 6290 | 128 | 2.034976% |
| B | 6290 | 329 | 5.230525% |
| C | 6290 | 627 | 9.968203% |
| D | 6290 | 435 | 6.915739% |
Noise dominated data is calculated using 1-second bins in cleaned event files. If a bin has >2000 counts, and if more than 50% of those come from <1% of pixels, then it is considered to be noise-dominated and hence unusable.
| Quadrant | # 1 sec bins | Bins with >0 counts | Bins with >2000 counts | High rate bins dominated by noise | Noise dominated (total time) | Noise dominated (detector-on time) | Marked lightcurve |
|---|---|---|---|---|---|---|---|
| A | 7590 | 6291 | 92 | 92 | 1.21% | 1.46% | 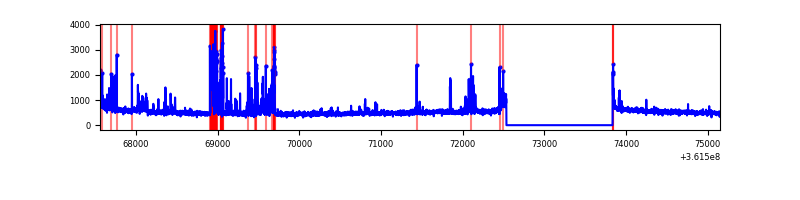 |
| B | 7590 | 6290 | 134 | 134 | 1.77% | 2.13% | 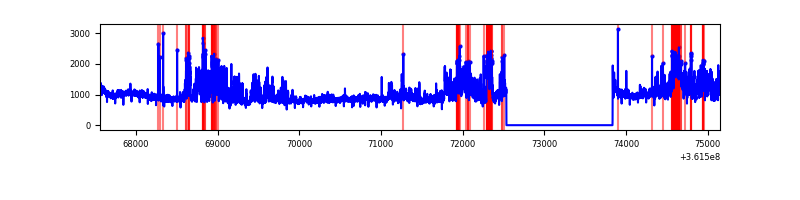 |
| C | 7590 | 6290 | 21 | 21 | 0.28% | 0.33% | 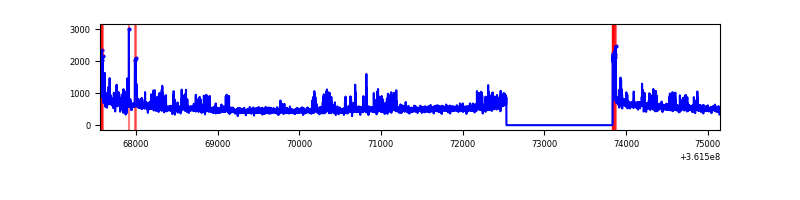 |
| D | 7590 | 6291 | 384 | 384 | 5.06% | 6.10% | 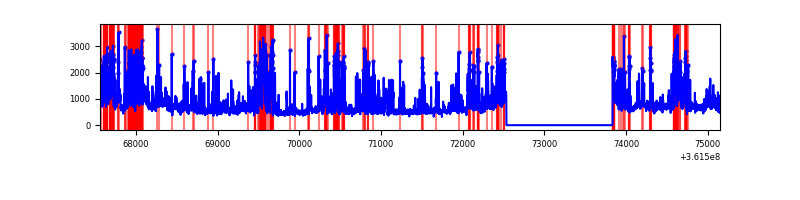 |
Top three noisy pixels from each quadrant. If the there are fewer than three noisy pixels in the level2.evt file, extra rows are filled as -1
| Pixel properties | Quadrant properties | ||||||
|---|---|---|---|---|---|---|---|
| Quadrant | DetID | PixID | Counts | Sigma | Mean | Median | Sigma |
| A | 0 | 13 | 563924 | 3502.46 | 808 | 794 | 160.8 |
| A | 13 | 254 | 12282 | 71.45 | 808 | 794 | 160.8 |
| A | 0 | 31 | 7899 | 44.19 | 808 | 794 | 160.8 |
| B | 6 | 159 | 1935973 | 12829.72 | 812 | 793 | 150.8 |
| B | 6 | 36 | 1344001 | 8905.11 | 812 | 793 | 150.8 |
| B | 0 | 190 | 43138 | 280.74 | 812 | 793 | 150.8 |
| C | 14 | 238 | 267910 | 1523.3 | 751 | 757 | 175.4 |
| C | 14 | 254 | 212501 | 1207.36 | 751 | 757 | 175.4 |
| C | 0 | 10 | 111488 | 631.38 | 751 | 757 | 175.4 |
| D | 12 | 218 | 1211571 | 6730.82 | 758 | 739 | 179.9 |
| D | 8 | 195 | 777664 | 4318.8 | 758 | 739 | 179.9 |
| D | 1 | 52 | 192985 | 1068.66 | 758 | 739 | 179.9 |
Histogram calculated using DETX and DETY for each event in the final _common_clean file
| Quadrant A | 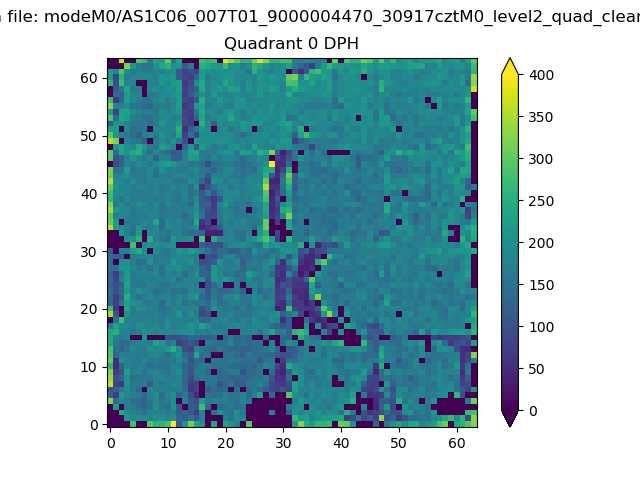 |
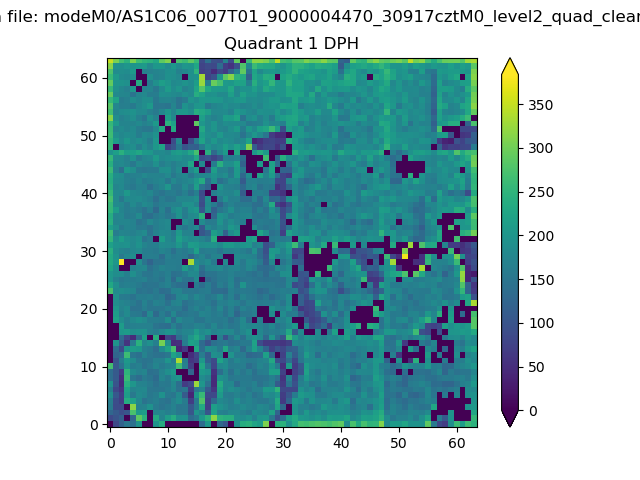 |
Quadrant B |
|---|---|---|---|
| Quadrant D | 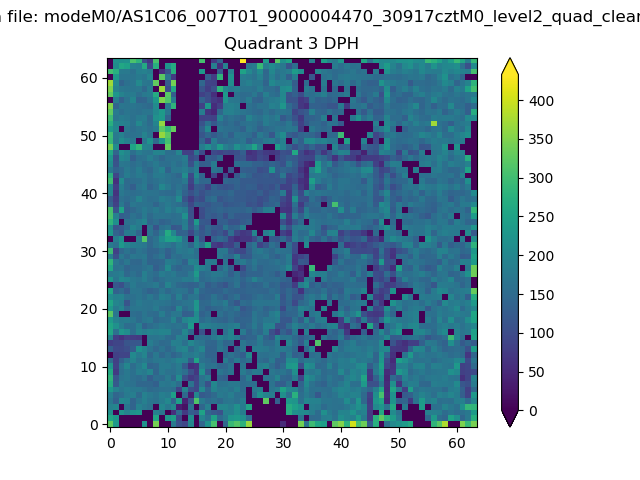 |
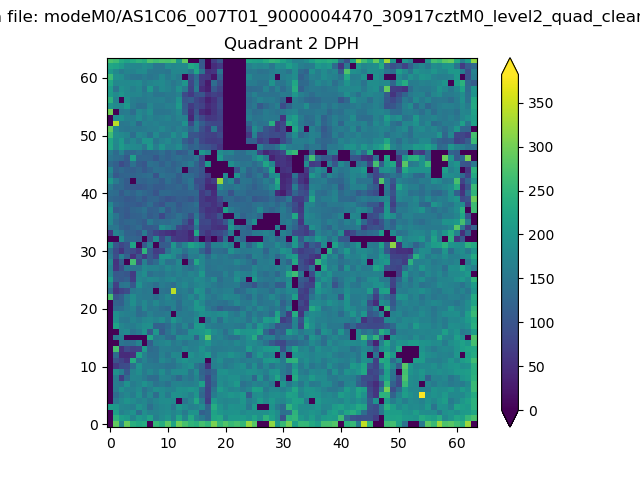 |
Quadrant C |
| Plot type | Count rate plots | Images |
|---|---|---|
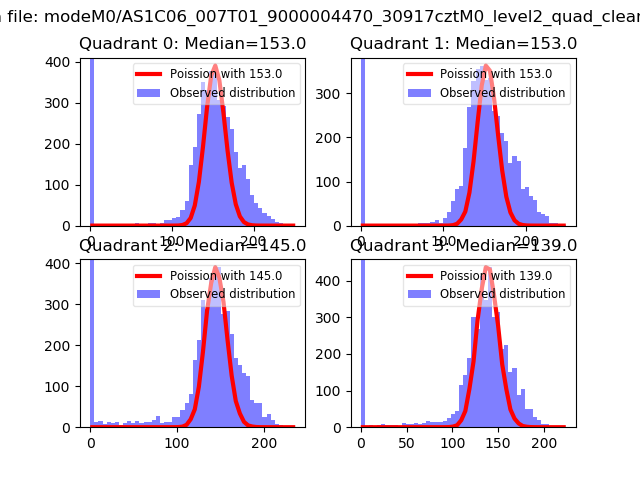
| Comparison with Poisson distribution Blue bars denote a histogram of data divided into 1 sec bins. Red curve is a Poisson curve with rate = median count rate of data. |
 |
 |
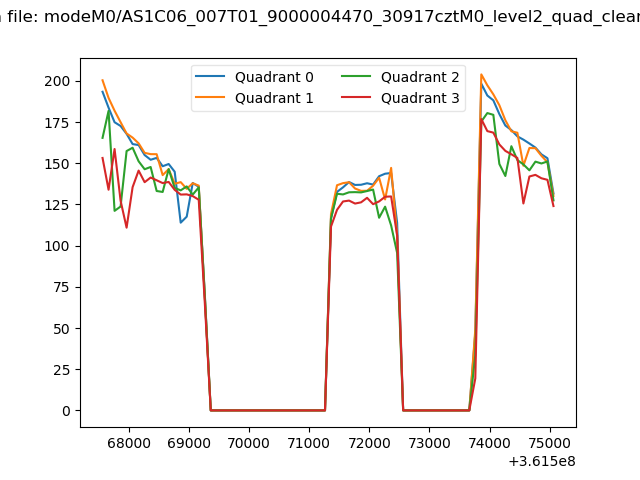
| Quadrant-wise count rates Data is divided into 100 sec bins |
 |
|
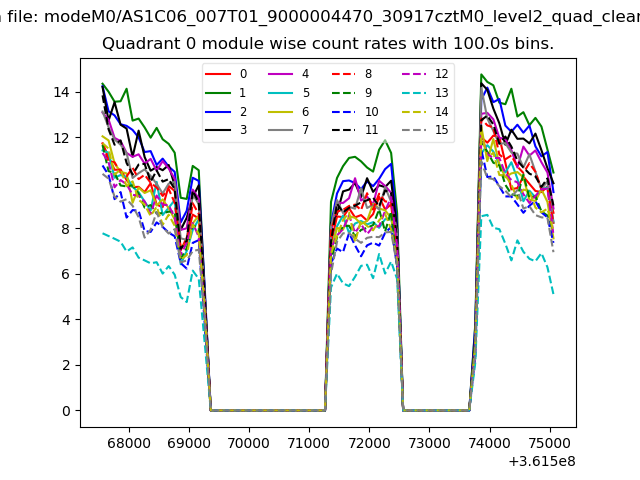
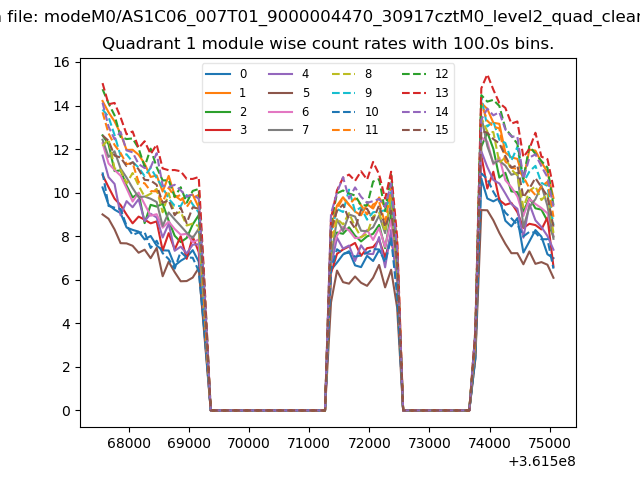
| Module-wise count rates for Quadrant A Data is divided into 100 sec bins |
 |
 |
| Module-wise count rates for Quadrant B Data is divided into 100 sec bins |
 |
 |
| Module-wise count rates for Quadrant C Data is divided into 100 sec bins |
 |
 |
| Module-wise count rates for Quadrant D Data is divided into 100 sec bins |
 |
 |
| Parameter | Plot |
|---|---|
| CZT HV Monitor |  |
| D_VDD | 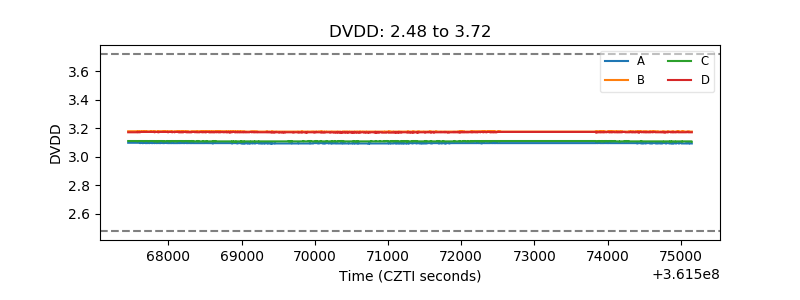 |
| Temperature 1 | 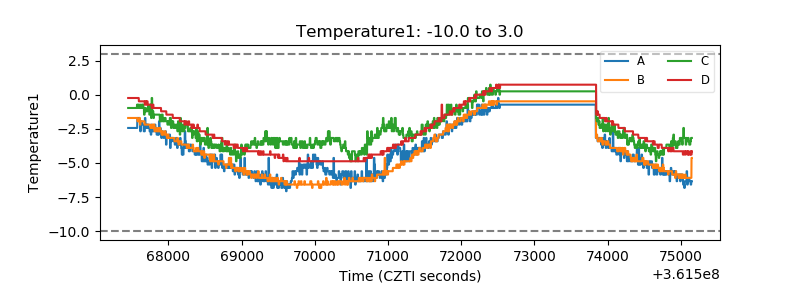 |
| Veto HV Monitor | 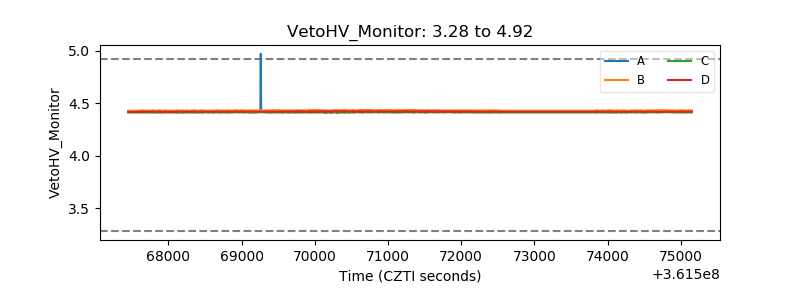 |
| Veto LLD | 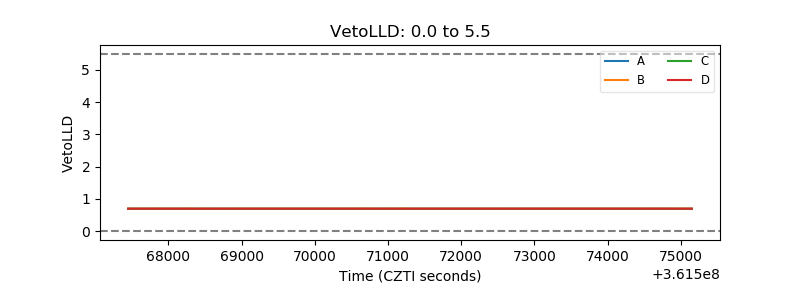 |
| Alpha Counter | 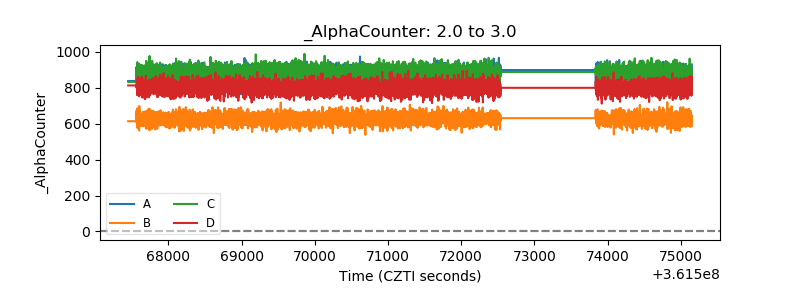 |
| _CPM_Rate | 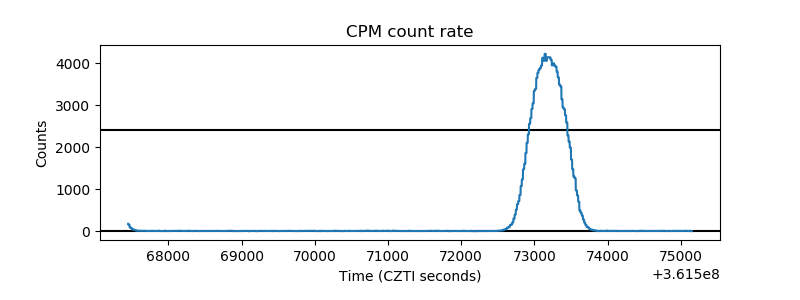 |
| CZT Counter | 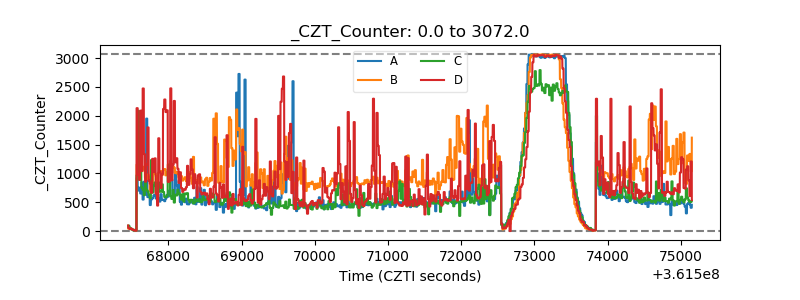 |
| +2.5 Volts monitor |  |
| +5 Volts monitor |  |
| _ROLL_ROT |  |
| _Roll_DEC | 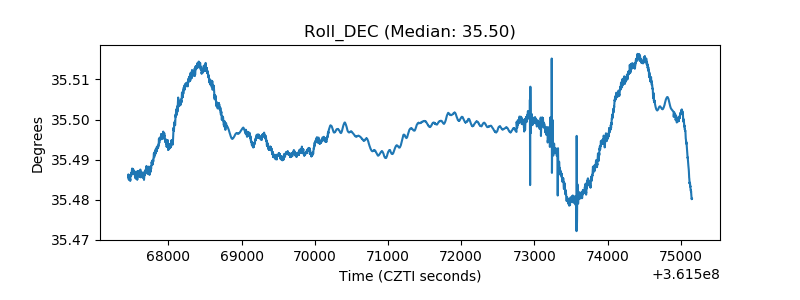 |
| _Roll_RA | 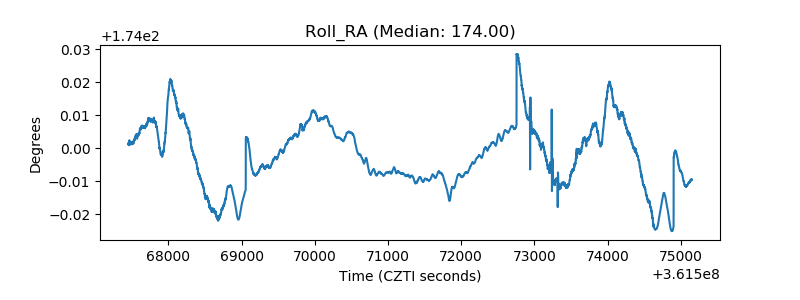 |
| Veto Counter | 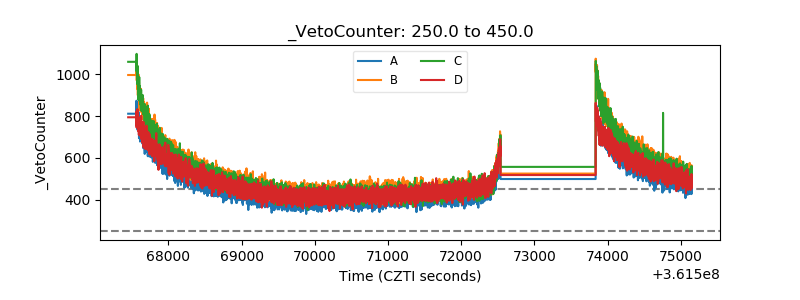 |