| Param | Original file | Final file |
|---|---|---|
| Filename | modeM0/AS1C06_007T01_9000004470_30918cztM0_level2.evt | modeM0/AS1C06_007T01_9000004470_30918cztM0_level2_quad_clean.evt |
| Size (bytes) | 627,485,760 | 86,935,680 |
| Size | 598.4 MB | 82.9 MB |
| Events in quadrant A | 3,191,617 | 582,606 |
| Events in quadrant B | 7,072,428 | 567,257 |
| Events in quadrant C | 3,555,681 | 537,068 |
| Events in quadrant D | 4,771,564 | 519,579 |
| Mode M0 | |||
|---|---|---|---|
| Quadrant | BADHDUFLAG | Total packets | Discarded packets |
| A | 0 | 13101 | 1 |
| B | 0 | 25094 | 1 |
| C | 0 | 14390 | 1 |
| D | 0 | 18459 | 1 |
| Mode M9 | |||
|---|---|---|---|
| Quadrant | BADHDUFLAG | Total packets | Discarded packets |
| A | 0 | 13 | 0 |
| B | 0 | 13 | 0 |
| C | 0 | 13 | 0 |
| D | 0 | 13 | 0 |
| Mode SS | |||
|---|---|---|---|
| Quadrant | BADHDUFLAG | Total packets | Discarded packets |
| A | 0 | 124 | 0 |
| B | 0 | 124 | 0 |
| C | 0 | 124 | 0 |
| D | 0 | 124 | 0 |
| Quadrant | Total seconds | Saturated seconds | Saturation percentage |
|---|---|---|---|
| A | 6097 | 39 | 0.639659% |
| B | 6098 | 689 | 11.298786% |
| C | 6097 | 516 | 8.463179% |
| D | 6097 | 274 | 4.494013% |
Noise dominated data is calculated using 1-second bins in cleaned event files. If a bin has >2000 counts, and if more than 50% of those come from <1% of pixels, then it is considered to be noise-dominated and hence unusable.
| Quadrant | # 1 sec bins | Bins with >0 counts | Bins with >2000 counts | High rate bins dominated by noise | Noise dominated (total time) | Noise dominated (detector-on time) | Marked lightcurve |
|---|---|---|---|---|---|---|---|
| A | 7417 | 6098 | 7 | 7 | 0.09% | 0.11% | 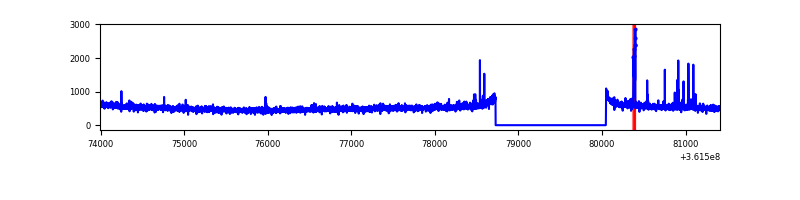 |
| B | 7418 | 6098 | 373 | 373 | 5.03% | 6.12% | 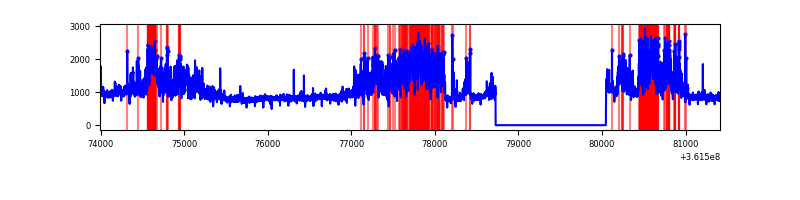 |
| C | 7417 | 6097 | 9 | 9 | 0.12% | 0.15% | 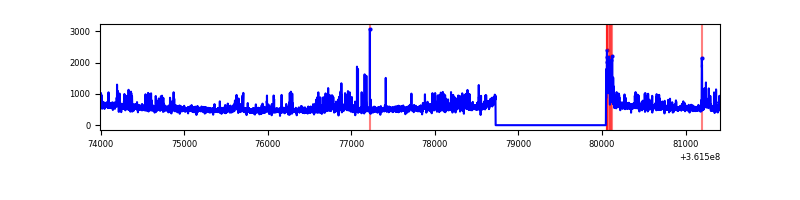 |
| D | 7417 | 6097 | 201 | 201 | 2.71% | 3.30% | 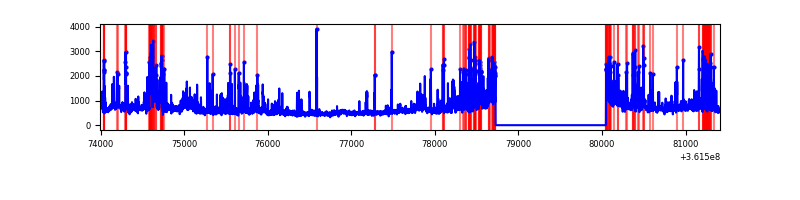 |
Top three noisy pixels from each quadrant. If the there are fewer than three noisy pixels in the level2.evt file, extra rows are filled as -1
| Pixel properties | Quadrant properties | ||||||
|---|---|---|---|---|---|---|---|
| Quadrant | DetID | PixID | Counts | Sigma | Mean | Median | Sigma |
| A | 0 | 13 | 63377 | 388.46 | 808 | 795 | 161.1 |
| A | 15 | 174 | 12712 | 73.97 | 808 | 795 | 161.1 |
| A | 13 | 254 | 11296 | 65.18 | 808 | 795 | 161.1 |
| B | 6 | 36 | 1942148 | 13143.6 | 797 | 780 | 147.7 |
| B | 6 | 159 | 1811120 | 12256.51 | 797 | 780 | 147.7 |
| B | 0 | 190 | 55892 | 373.12 | 797 | 780 | 147.7 |
| C | 14 | 238 | 244303 | 1394.69 | 752 | 758 | 174.6 |
| C | 14 | 254 | 169384 | 965.65 | 752 | 758 | 174.6 |
| C | 0 | 10 | 118525 | 674.41 | 752 | 758 | 174.6 |
| D | 8 | 195 | 706739 | 3976.97 | 753 | 734 | 177.5 |
| D | 12 | 218 | 507863 | 2856.69 | 753 | 734 | 177.5 |
| D | 1 | 52 | 248683 | 1396.71 | 753 | 734 | 177.5 |
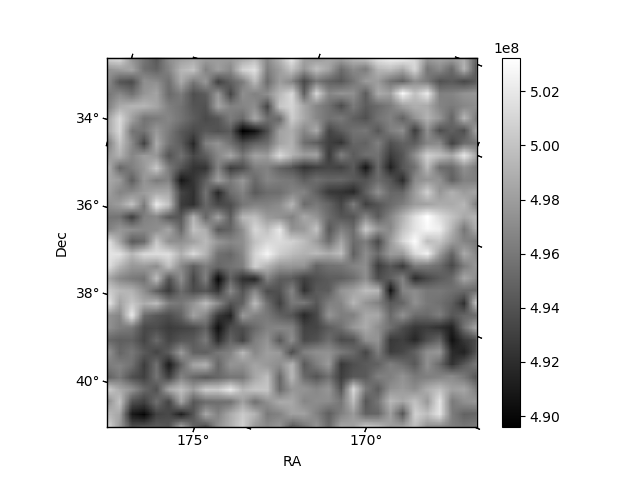
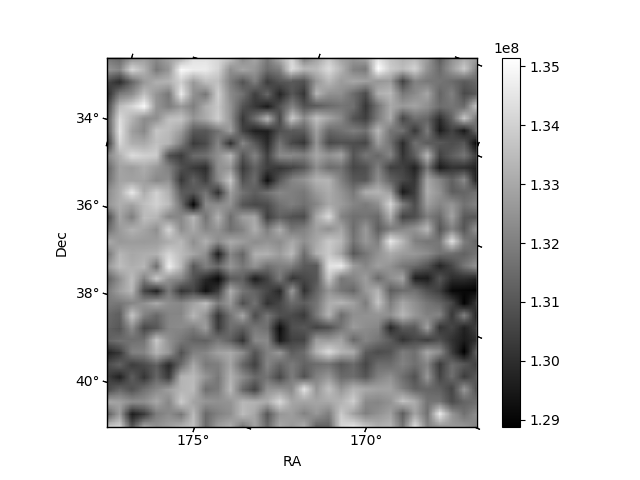
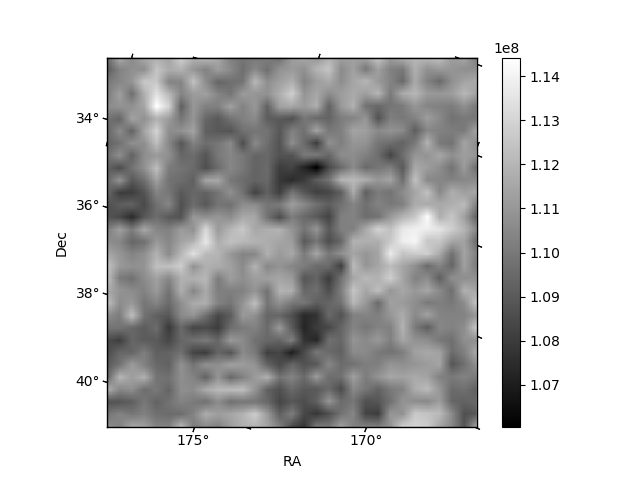
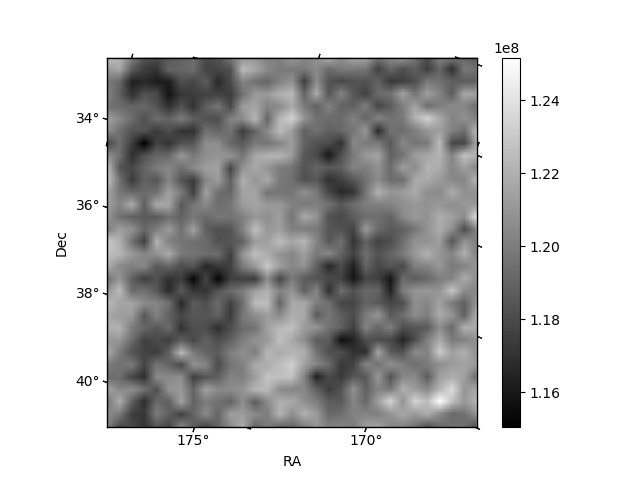
Histogram calculated using DETX and DETY for each event in the final _common_clean file
| Quadrant A | 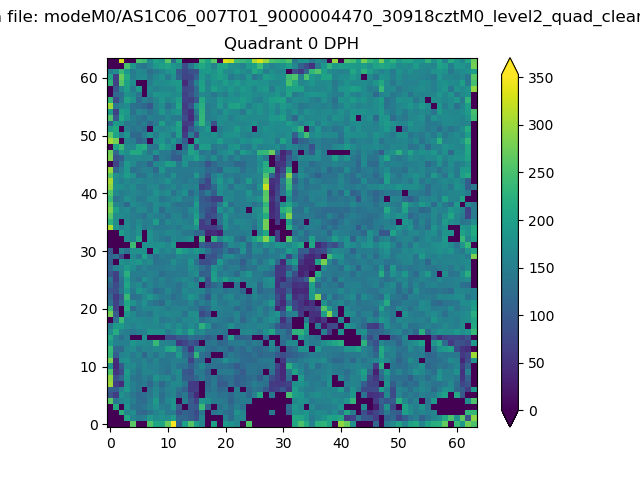 |
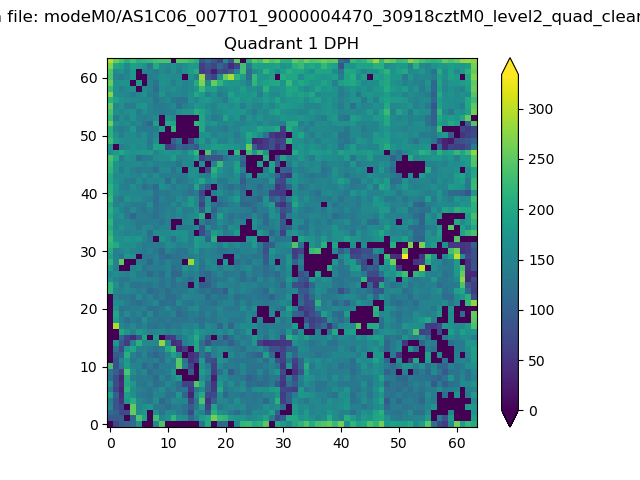 |
Quadrant B |
|---|---|---|---|
| Quadrant D | 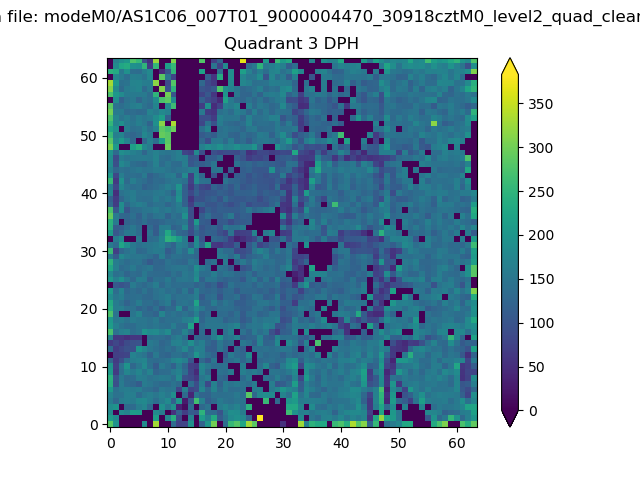 |
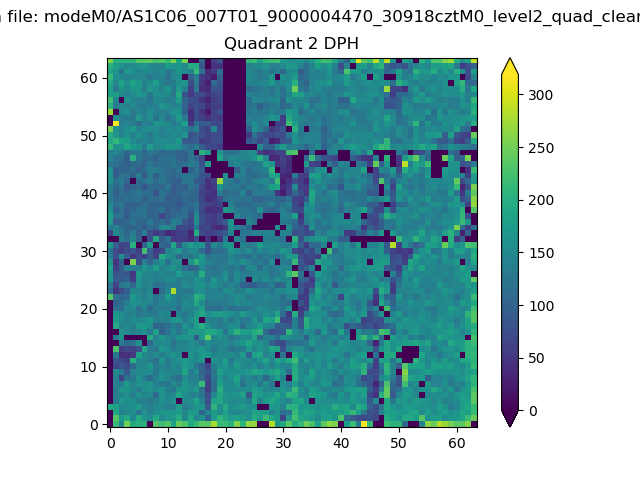 |
Quadrant C |
| Plot type | Count rate plots | Images |
|---|---|---|
| Comparison with Poisson distribution Blue bars denote a histogram of data divided into 1 sec bins. Red curve is a Poisson curve with rate = median count rate of data. |
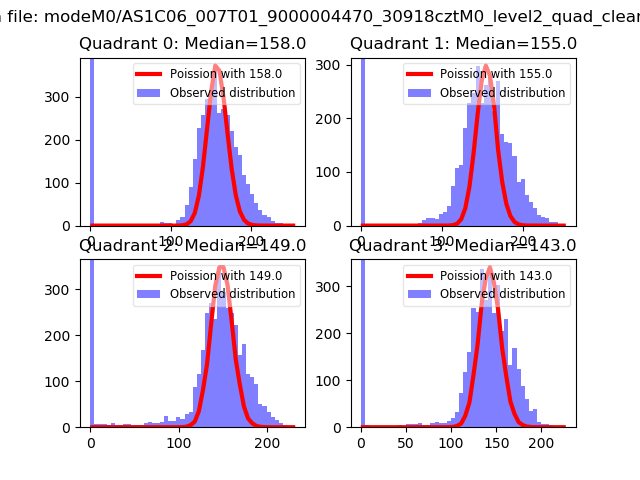 |
 |
| Quadrant-wise count rates Data is divided into 100 sec bins |
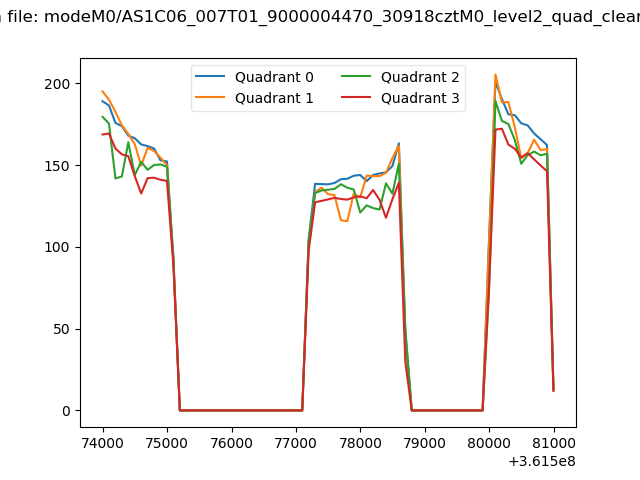 |
|
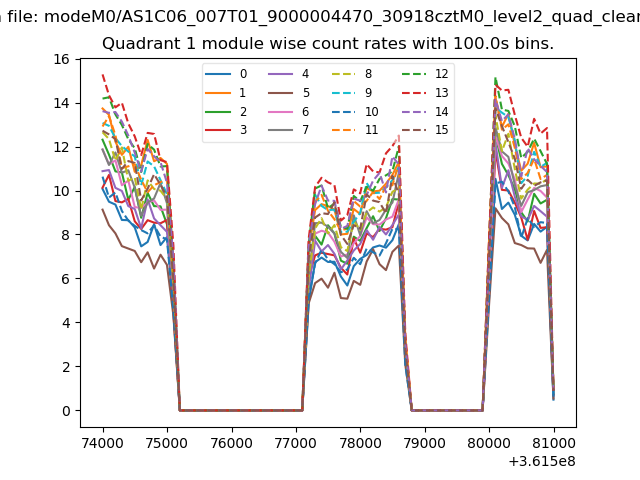
| Module-wise count rates for Quadrant A Data is divided into 100 sec bins |
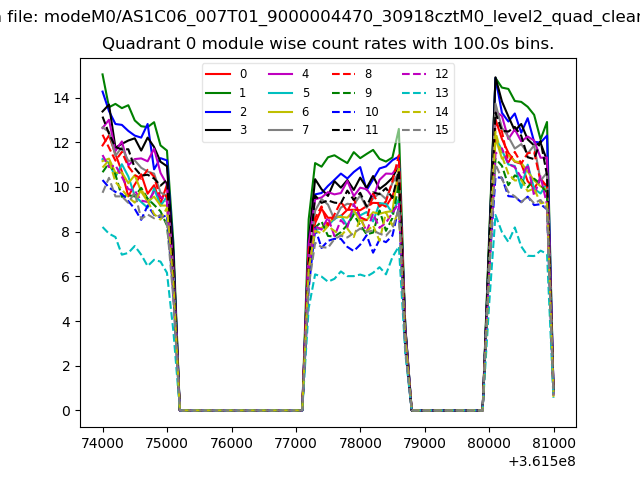 |
 |
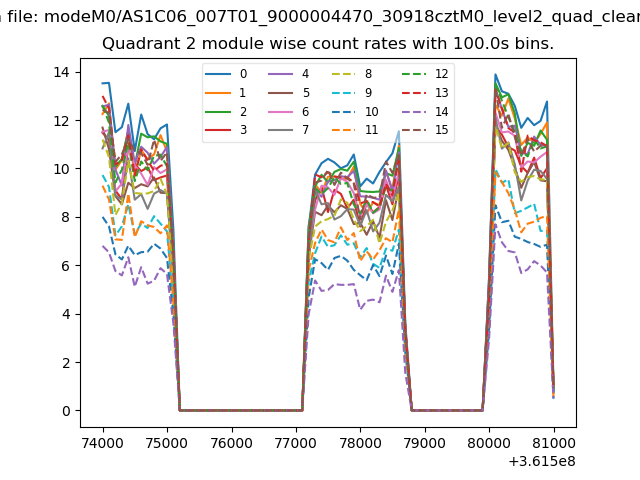
| Module-wise count rates for Quadrant B Data is divided into 100 sec bins |
 |
 |
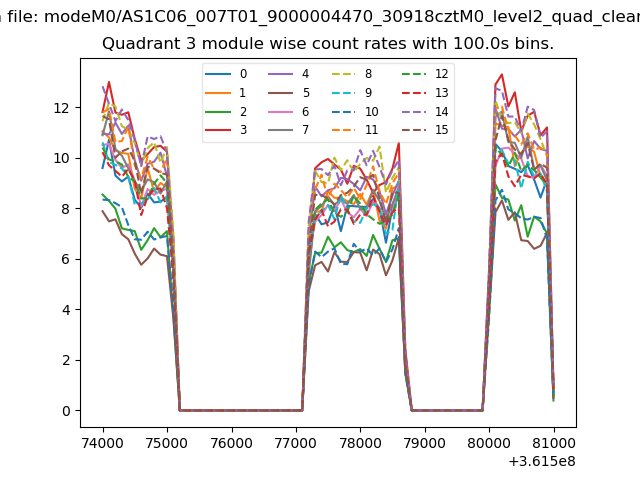
| Module-wise count rates for Quadrant C Data is divided into 100 sec bins |
 |
 |
| Module-wise count rates for Quadrant D Data is divided into 100 sec bins |
 |
 |
| Parameter | Plot |
|---|---|
| CZT HV Monitor |  |
| D_VDD | 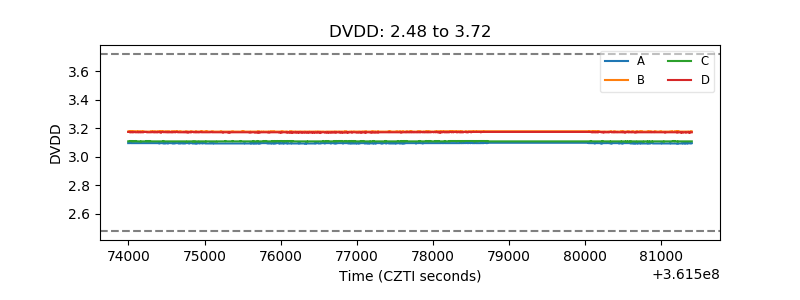 |
| Temperature 1 |  |
| Veto HV Monitor | 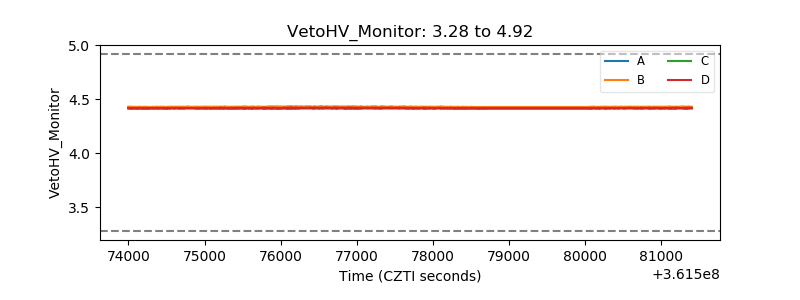 |
| Veto LLD | 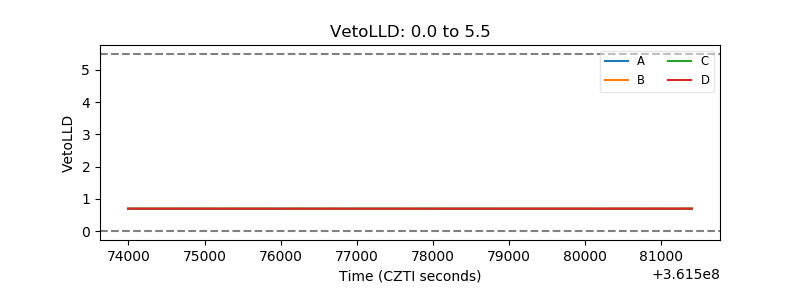 |
| Alpha Counter | 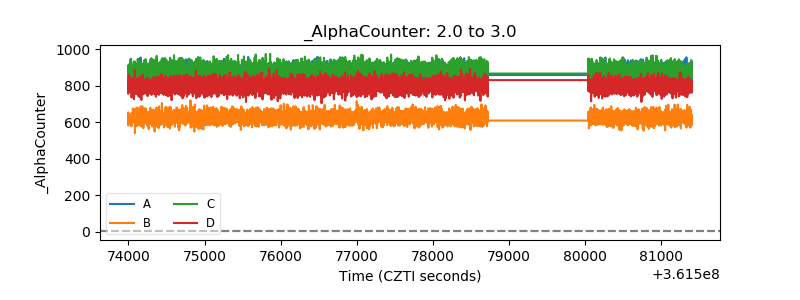 |
| _CPM_Rate | 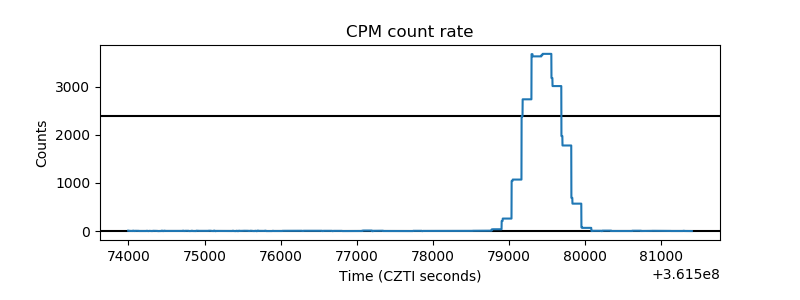 |
| CZT Counter | 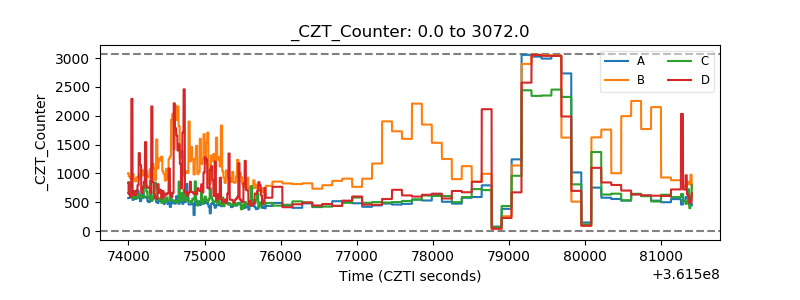 |
| +2.5 Volts monitor |  |
| +5 Volts monitor | 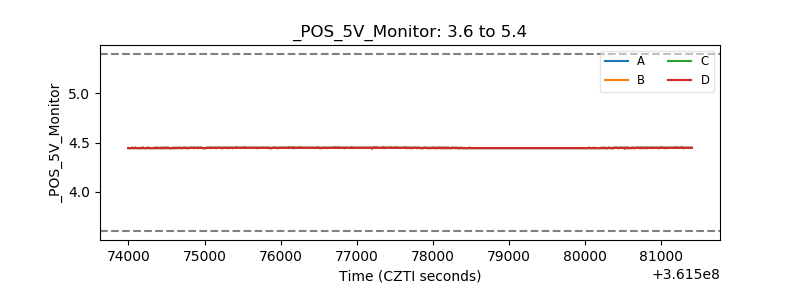 |
| _ROLL_ROT | 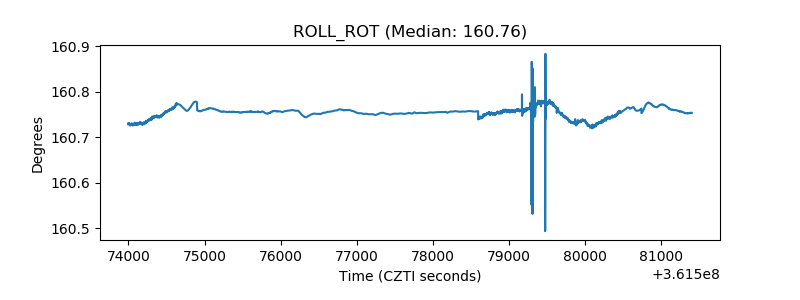 |
| _Roll_DEC | 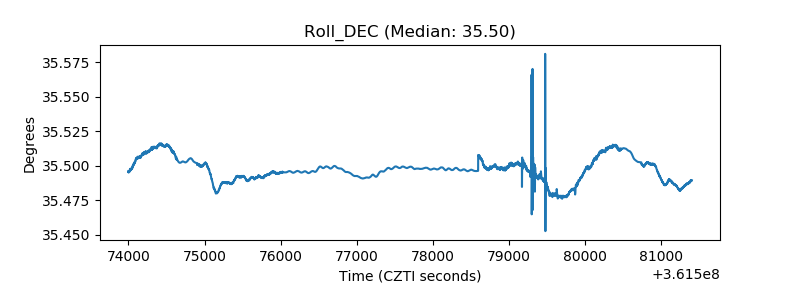 |
| _Roll_RA | 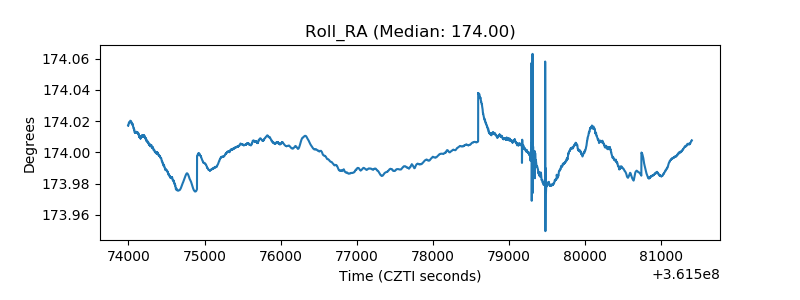 |
| Veto Counter | 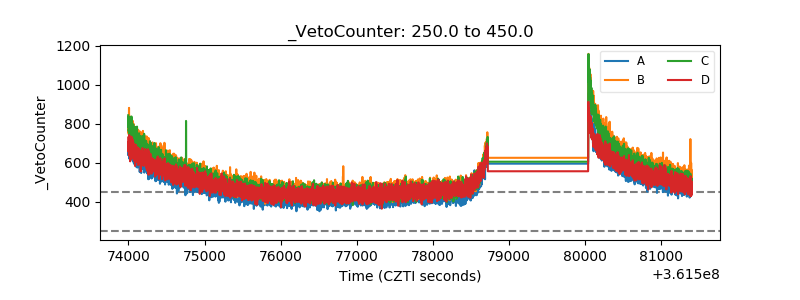 |