| Param | Original file | Final file |
|---|---|---|
| Filename | modeM0/AS1C06_007T01_9000004470_30919cztM0_level2.evt | modeM0/AS1C06_007T01_9000004470_30919cztM0_level2_quad_clean.evt |
| Size (bytes) | 583,246,080 | 68,757,120 |
| Size | 556.2 MB | 65.6 MB |
| Events in quadrant A | 3,041,432 | 444,180 |
| Events in quadrant B | 6,152,543 | 436,284 |
| Events in quadrant C | 3,398,206 | 401,732 |
| Events in quadrant D | 4,669,861 | 384,435 |
| Mode M0 | |||
|---|---|---|---|
| Quadrant | BADHDUFLAG | Total packets | Discarded packets |
| A | 0 | 12450 | 1 |
| B | 0 | 22190 | 1 |
| C | 0 | 13675 | 1 |
| D | 0 | 17811 | 1 |
| Mode M9 | |||
|---|---|---|---|
| Quadrant | BADHDUFLAG | Total packets | Discarded packets |
| A | 0 | 14 | 0 |
| B | 0 | 14 | 0 |
| C | 0 | 14 | 0 |
| D | 0 | 14 | 0 |
| Mode SS | |||
|---|---|---|---|
| Quadrant | BADHDUFLAG | Total packets | Discarded packets |
| A | 0 | 120 | 0 |
| B | 0 | 120 | 0 |
| C | 0 | 120 | 0 |
| D | 0 | 120 | 0 |
| Quadrant | Total seconds | Saturated seconds | Saturation percentage |
|---|---|---|---|
| A | 5940 | 33 | 0.555556% |
| B | 5941 | 410 | 6.901195% |
| C | 5941 | 439 | 7.389328% |
| D | 5941 | 388 | 6.530887% |
Noise dominated data is calculated using 1-second bins in cleaned event files. If a bin has >2000 counts, and if more than 50% of those come from <1% of pixels, then it is considered to be noise-dominated and hence unusable.
| Quadrant | # 1 sec bins | Bins with >0 counts | Bins with >2000 counts | High rate bins dominated by noise | Noise dominated (total time) | Noise dominated (detector-on time) | Marked lightcurve |
|---|---|---|---|---|---|---|---|
| A | 7300 | 5941 | 0 | 0 | 0.00% | 0.00% | 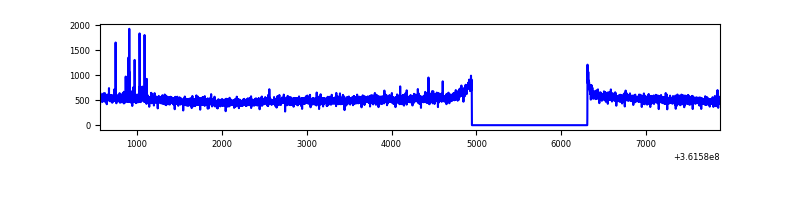 |
| B | 7301 | 5942 | 221 | 221 | 3.03% | 3.72% | 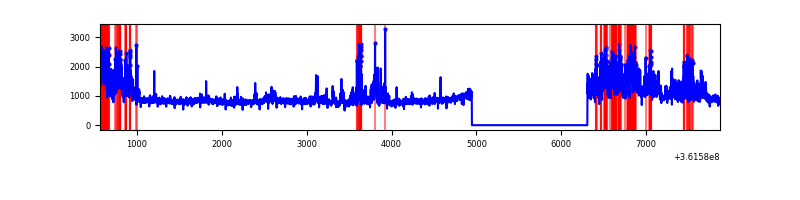 |
| C | 7301 | 5942 | 3 | 3 | 0.04% | 0.05% | 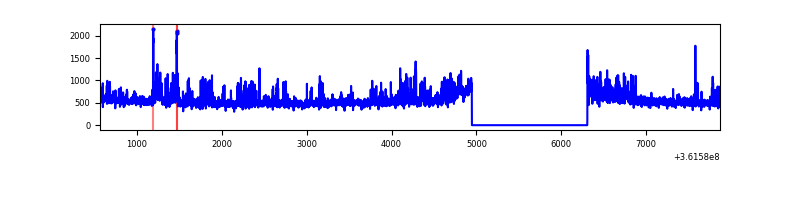 |
| D | 7301 | 5942 | 304 | 304 | 4.16% | 5.12% | 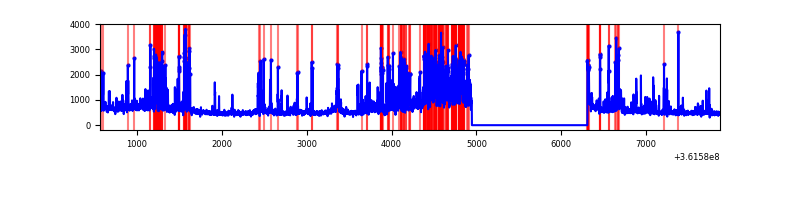 |
Top three noisy pixels from each quadrant. If the there are fewer than three noisy pixels in the level2.evt file, extra rows are filled as -1
| Pixel properties | Quadrant properties | ||||||
|---|---|---|---|---|---|---|---|
| Quadrant | DetID | PixID | Counts | Sigma | Mean | Median | Sigma |
| A | 0 | 13 | 22180 | 136.69 | 781 | 767 | 156.7 |
| A | 13 | 254 | 11300 | 67.24 | 781 | 767 | 156.7 |
| A | 3 | 137 | 7345 | 41.99 | 781 | 767 | 156.7 |
| B | 6 | 159 | 1730211 | 12007.62 | 776 | 759 | 144.0 |
| B | 6 | 36 | 1228530 | 8524.44 | 776 | 759 | 144.0 |
| B | 5 | 172 | 65687 | 450.8 | 776 | 759 | 144.0 |
| C | 14 | 238 | 234468 | 1384.73 | 724 | 729 | 168.8 |
| C | 14 | 254 | 162704 | 959.58 | 724 | 729 | 168.8 |
| C | 3 | 233 | 105884 | 622.96 | 724 | 729 | 168.8 |
| D | 12 | 218 | 1006094 | 5918.01 | 718 | 700 | 169.9 |
| D | 8 | 195 | 495314 | 2911.42 | 718 | 700 | 169.9 |
| D | 12 | 233 | 132503 | 775.83 | 718 | 700 | 169.9 |
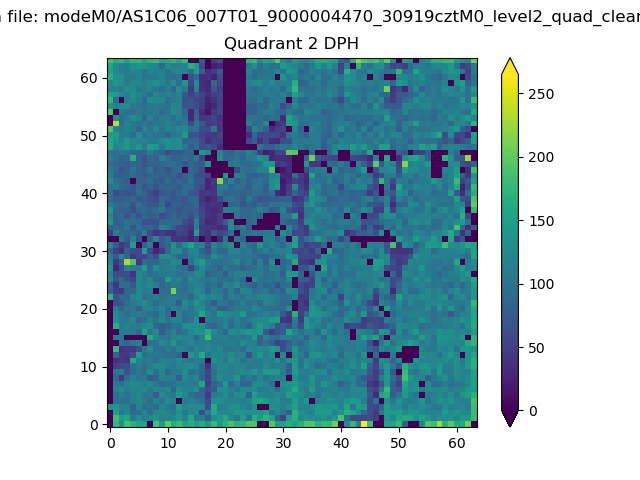
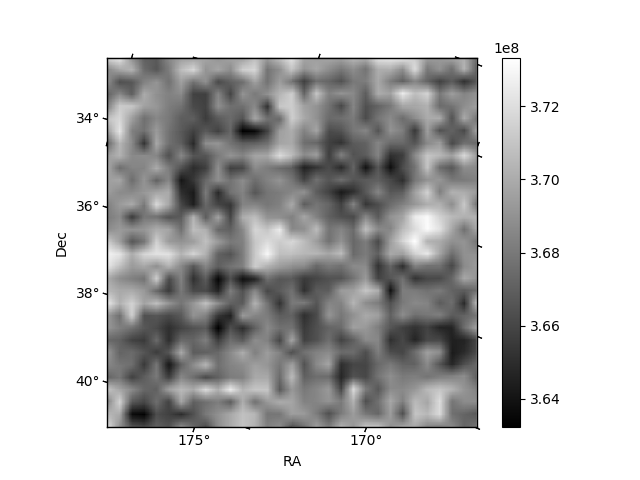
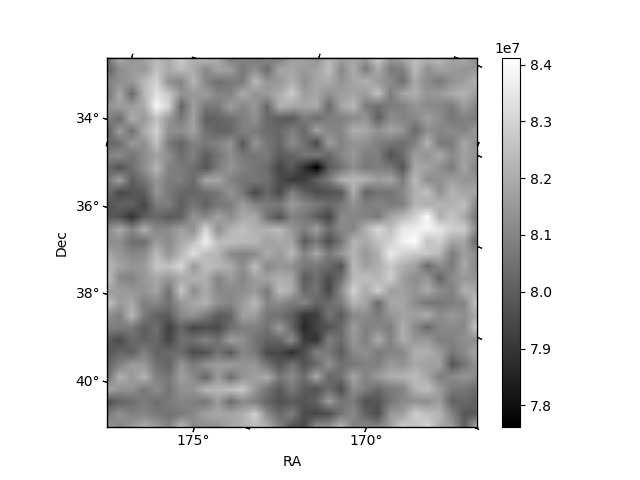
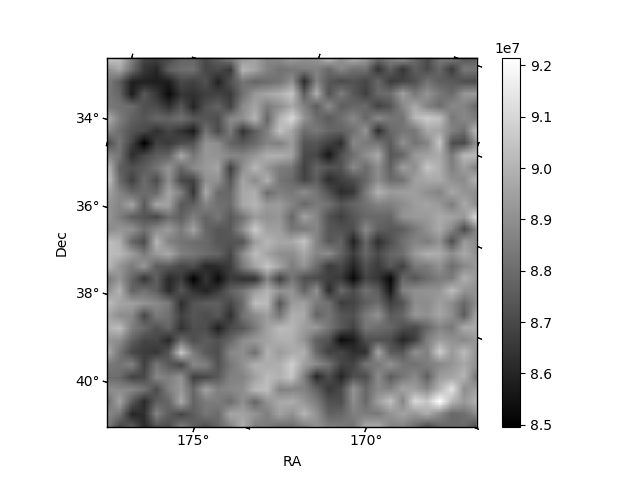
Histogram calculated using DETX and DETY for each event in the final _common_clean file
| Quadrant A | 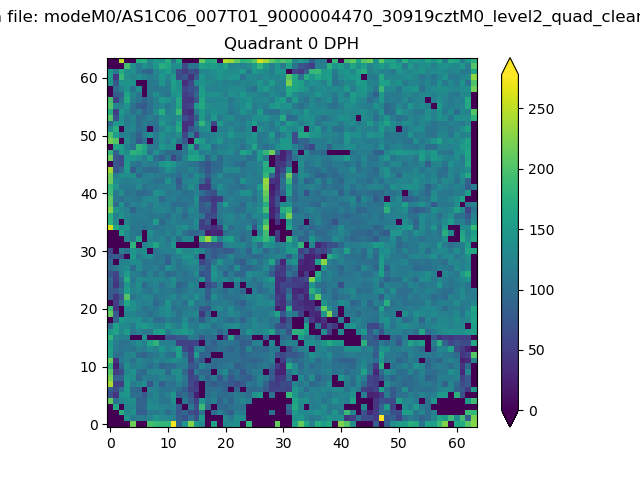 |
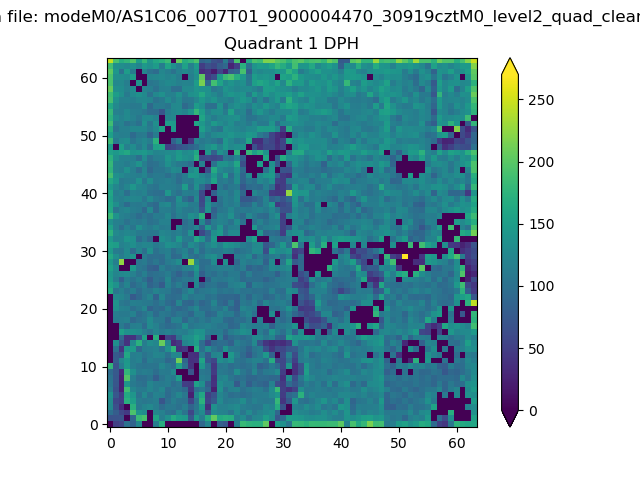 |
Quadrant B |
|---|---|---|---|
| Quadrant D | 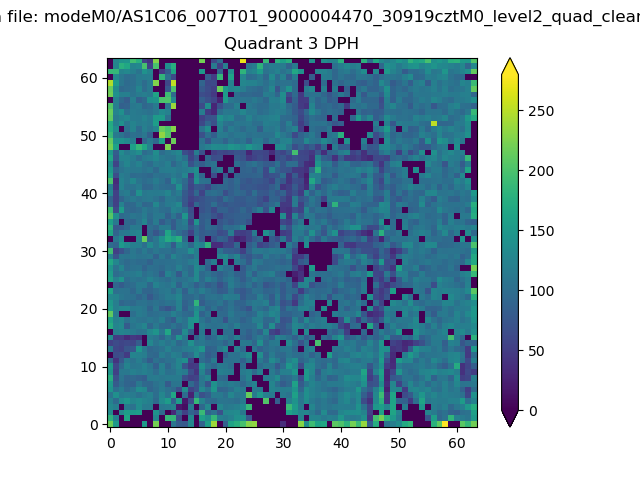 |
 |
Quadrant C |
| Plot type | Count rate plots | Images |
|---|---|---|
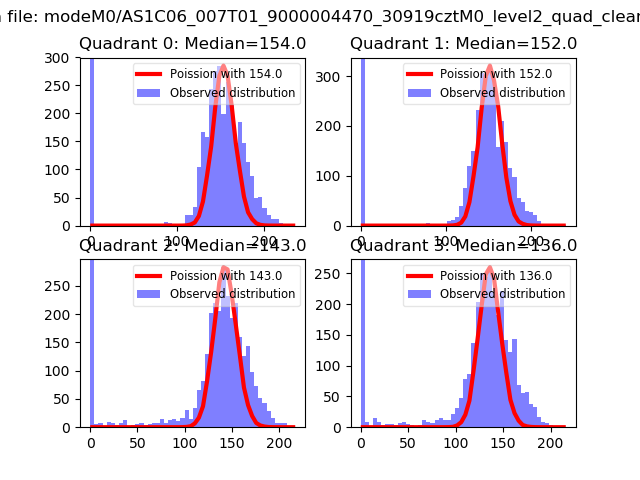
| Comparison with Poisson distribution Blue bars denote a histogram of data divided into 1 sec bins. Red curve is a Poisson curve with rate = median count rate of data. |
 |
 |
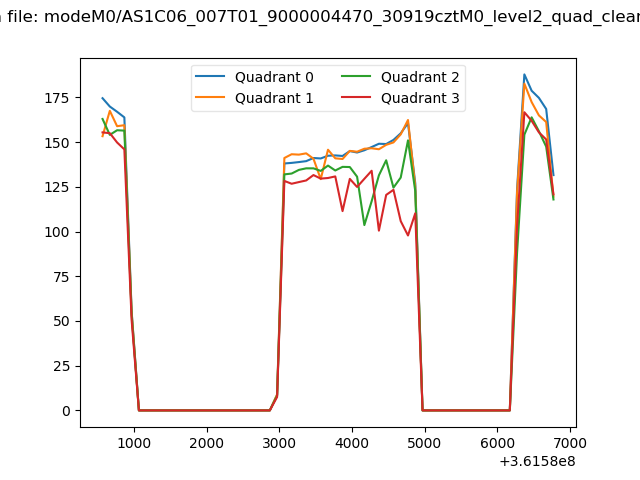
| Quadrant-wise count rates Data is divided into 100 sec bins |
 |
|
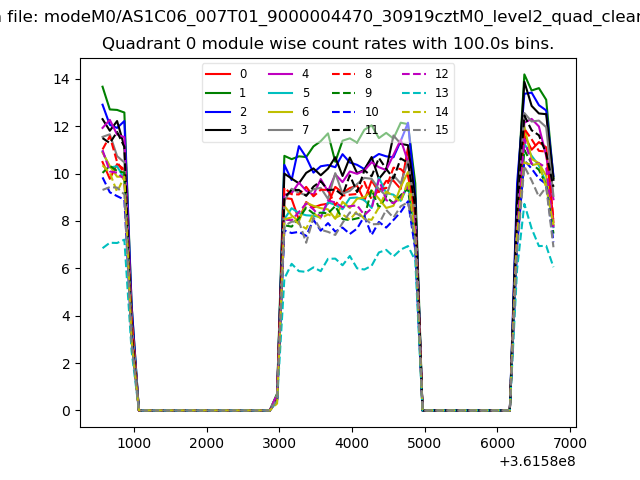
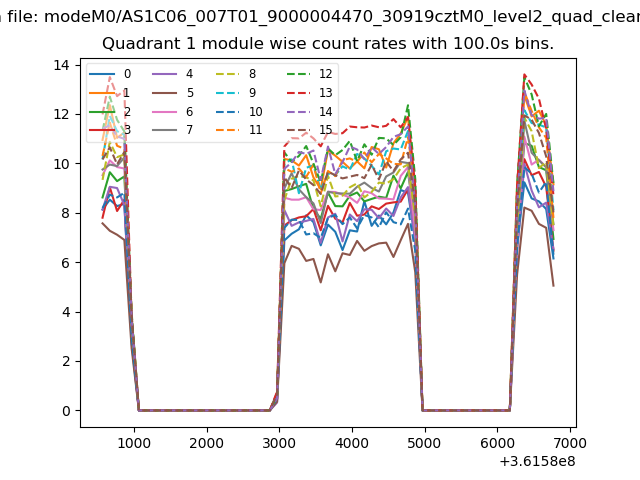
| Module-wise count rates for Quadrant A Data is divided into 100 sec bins |
 |
 |
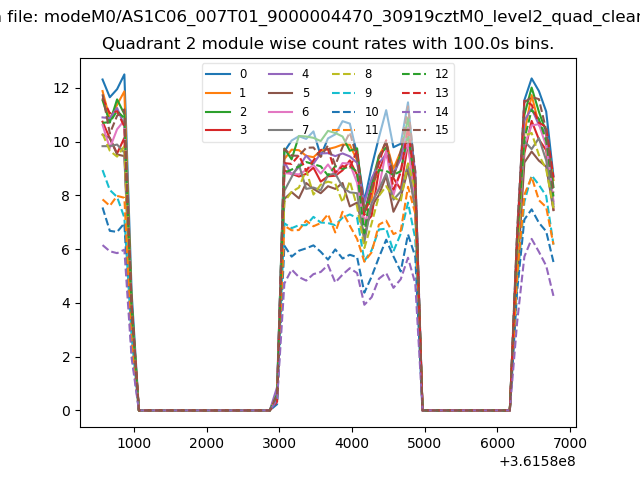
| Module-wise count rates for Quadrant B Data is divided into 100 sec bins |
 |
 |
| Module-wise count rates for Quadrant C Data is divided into 100 sec bins |
 |
 |
| Module-wise count rates for Quadrant D Data is divided into 100 sec bins |
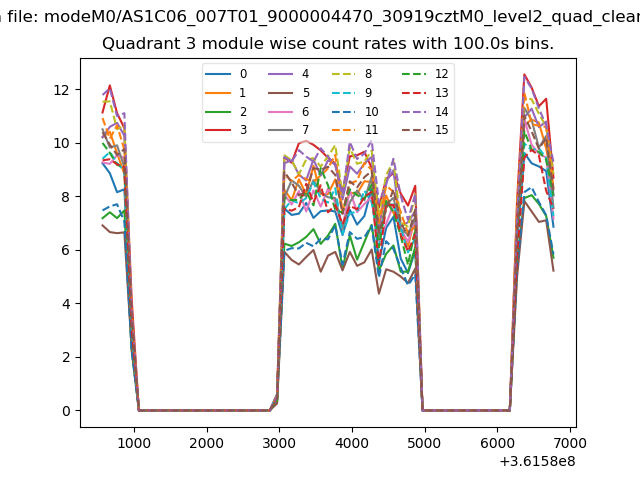 |
 |
| Parameter | Plot |
|---|---|
| CZT HV Monitor | 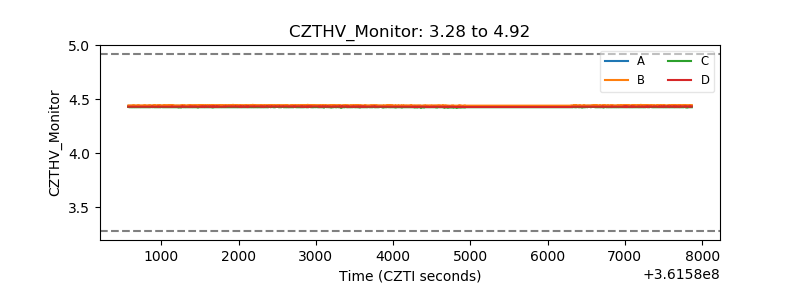 |
| D_VDD | 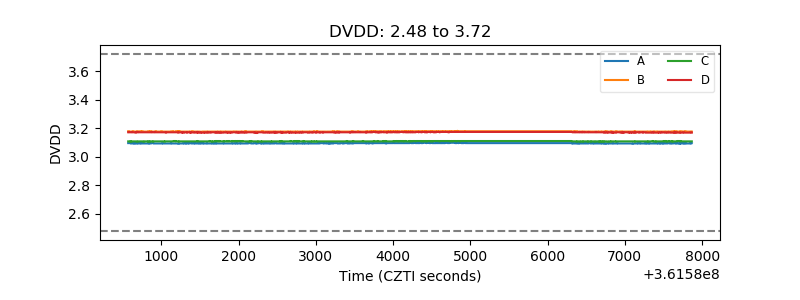 |
| Temperature 1 | 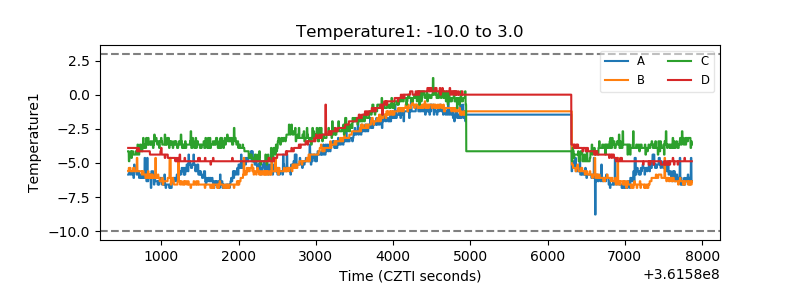 |
| Veto HV Monitor | 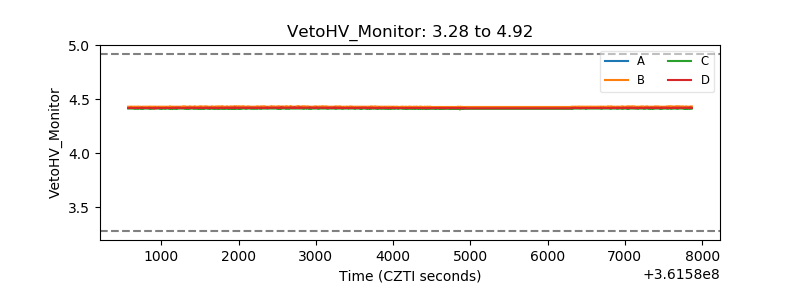 |
| Veto LLD |  |
| Alpha Counter | 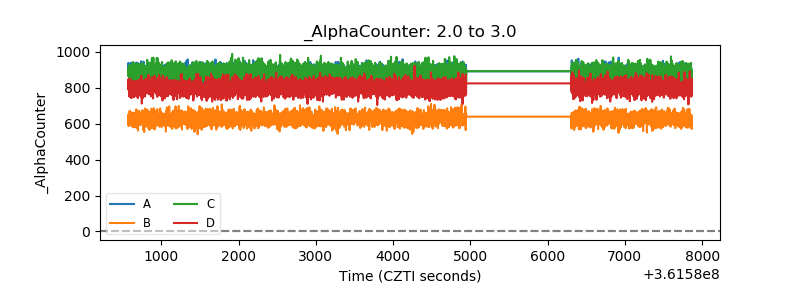 |
| _CPM_Rate | 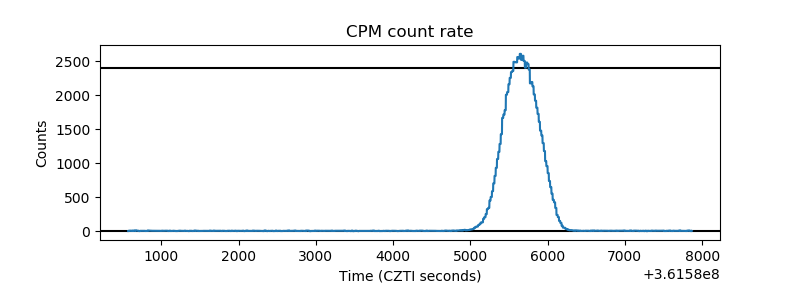 |
| CZT Counter | 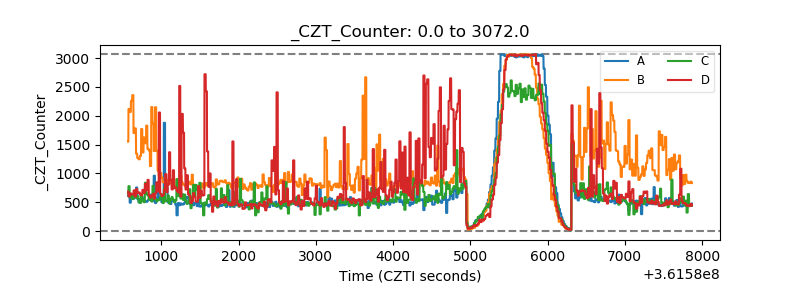 |
| +2.5 Volts monitor |  |
| +5 Volts monitor |  |
| _ROLL_ROT | 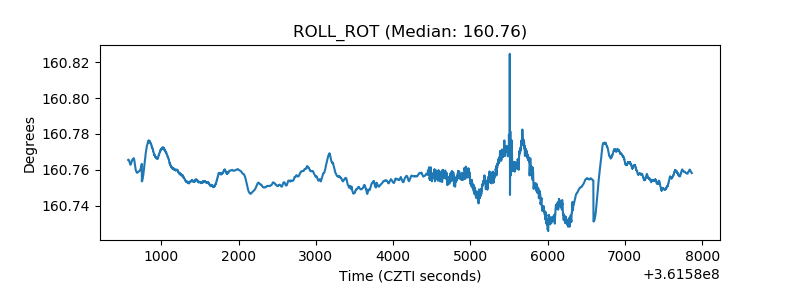 |
| _Roll_DEC | 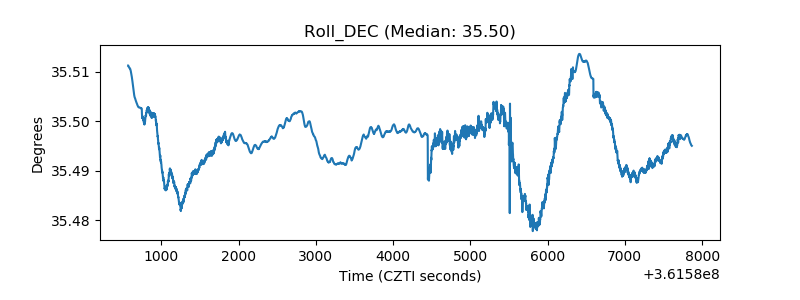 |
| _Roll_RA | 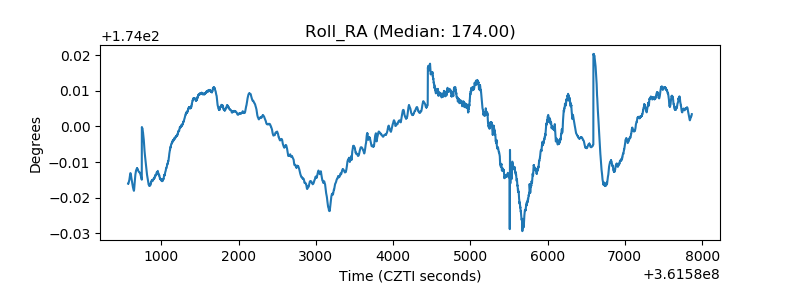 |
| Veto Counter | 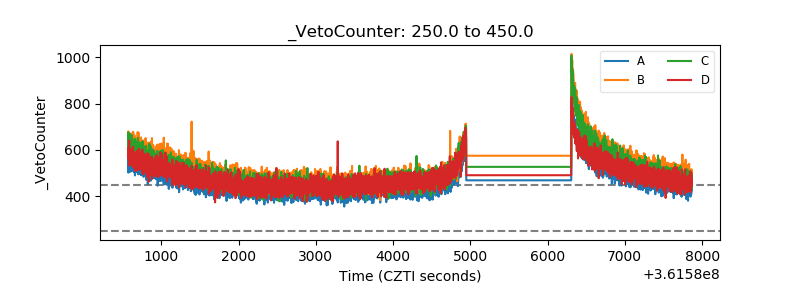 |