| Param | Original file | Final file |
|---|---|---|
| Filename | modeM0/AS1C06_007T01_9000004470_30920cztM0_level2.evt | modeM0/AS1C06_007T01_9000004470_30920cztM0_level2_quad_clean.evt |
| Size (bytes) | 634,458,240 | 72,155,520 |
| Size | 605.1 MB | 68.8 MB |
| Events in quadrant A | 3,307,388 | 460,227 |
| Events in quadrant B | 6,565,199 | 454,051 |
| Events in quadrant C | 3,666,288 | 426,043 |
| Events in quadrant D | 5,235,104 | 389,503 |
| Mode M0 | |||
|---|---|---|---|
| Quadrant | BADHDUFLAG | Total packets | Discarded packets |
| A | 0 | 13605 | 2 |
| B | 0 | 23689 | 2 |
| C | 0 | 14780 | 2 |
| D | 0 | 19794 | 2 |
| Mode M9 | |||
|---|---|---|---|
| Quadrant | BADHDUFLAG | Total packets | Discarded packets |
| A | 0 | 12 | 0 |
| B | 0 | 12 | 0 |
| C | 0 | 12 | 0 |
| D | 0 | 12 | 0 |
| Mode SS | |||
|---|---|---|---|
| Quadrant | BADHDUFLAG | Total packets | Discarded packets |
| A | 0 | 134 | 0 |
| B | 0 | 134 | 0 |
| C | 0 | 134 | 0 |
| D | 0 | 134 | 0 |
| Quadrant | Total seconds | Saturated seconds | Saturation percentage |
|---|---|---|---|
| A | 6510 | 64 | 0.983103% |
| B | 6510 | 378 | 5.806452% |
| C | 6510 | 414 | 6.359447% |
| D | 6511 | 572 | 8.785133% |
Noise dominated data is calculated using 1-second bins in cleaned event files. If a bin has >2000 counts, and if more than 50% of those come from <1% of pixels, then it is considered to be noise-dominated and hence unusable.
| Quadrant | # 1 sec bins | Bins with >0 counts | Bins with >2000 counts | High rate bins dominated by noise | Noise dominated (total time) | Noise dominated (detector-on time) | Marked lightcurve |
|---|---|---|---|---|---|---|---|
| A | 7745 | 6510 | 0 | 0 | 0.00% | 0.00% | 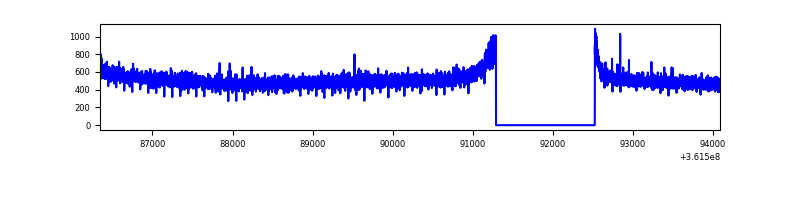 |
| B | 7745 | 6510 | 141 | 141 | 1.82% | 2.17% | 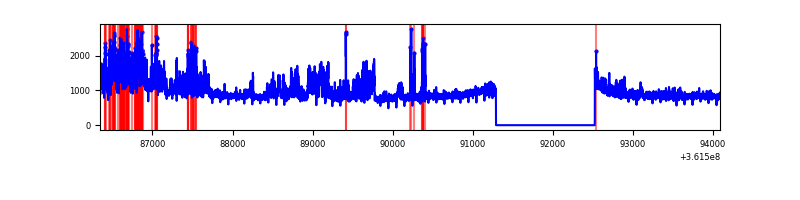 |
| C | 7745 | 6510 | 6 | 6 | 0.08% | 0.09% | 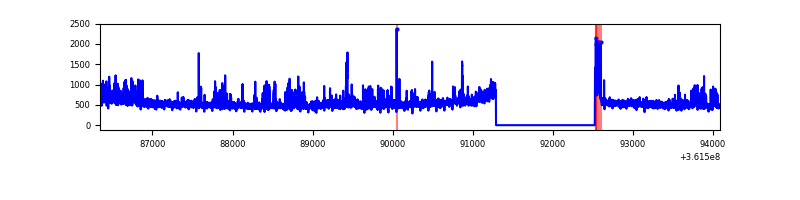 |
| D | 7746 | 6511 | 474 | 474 | 6.12% | 7.28% | 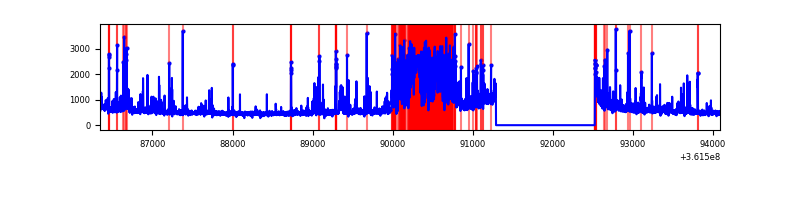 |
Top three noisy pixels from each quadrant. If the there are fewer than three noisy pixels in the level2.evt file, extra rows are filled as -1
| Pixel properties | Quadrant properties | ||||||
|---|---|---|---|---|---|---|---|
| Quadrant | DetID | PixID | Counts | Sigma | Mean | Median | Sigma |
| A | 13 | 254 | 12298 | 67.36 | 855 | 840 | 170.1 |
| A | 3 | 137 | 8157 | 43.02 | 855 | 840 | 170.1 |
| A | 0 | 226 | 7315 | 38.07 | 855 | 840 | 170.1 |
| B | 6 | 159 | 1927564 | 12293.68 | 844 | 825 | 156.7 |
| B | 6 | 36 | 1210957 | 7721.32 | 844 | 825 | 156.7 |
| B | 5 | 172 | 46961 | 294.37 | 844 | 825 | 156.7 |
| C | 14 | 238 | 225436 | 1226.13 | 795 | 801 | 183.2 |
| C | 14 | 254 | 136329 | 739.76 | 795 | 801 | 183.2 |
| C | 3 | 233 | 112094 | 607.48 | 795 | 801 | 183.2 |
| D | 12 | 233 | 1168763 | 6245.15 | 786 | 767 | 187.0 |
| D | 12 | 218 | 329289 | 1756.57 | 786 | 767 | 187.0 |
| D | 8 | 195 | 297636 | 1587.33 | 786 | 767 | 187.0 |
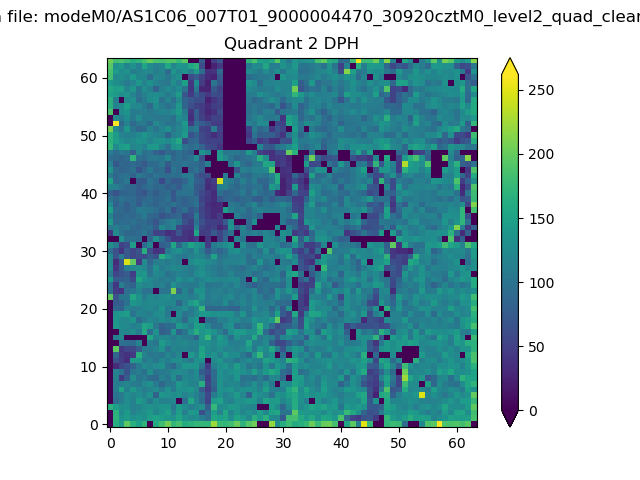
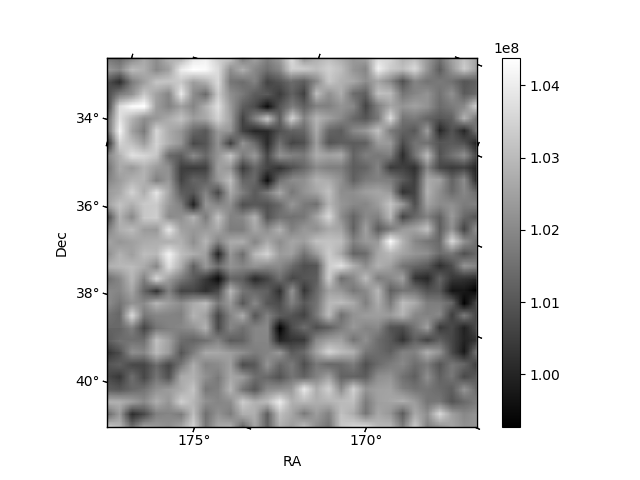
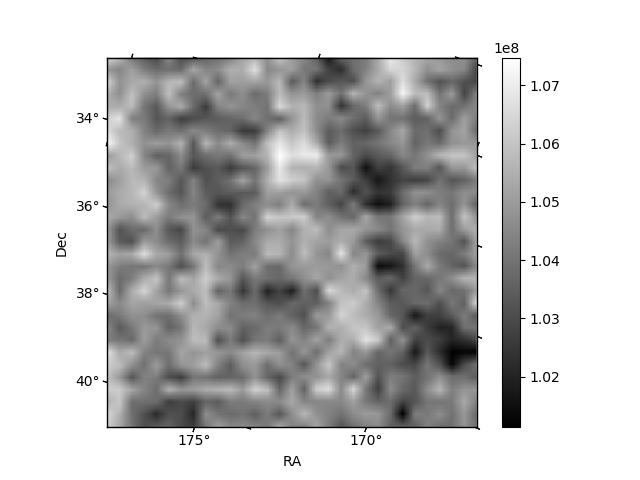
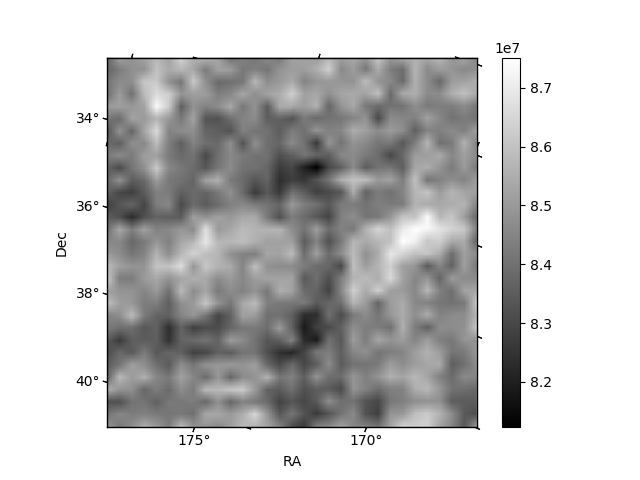
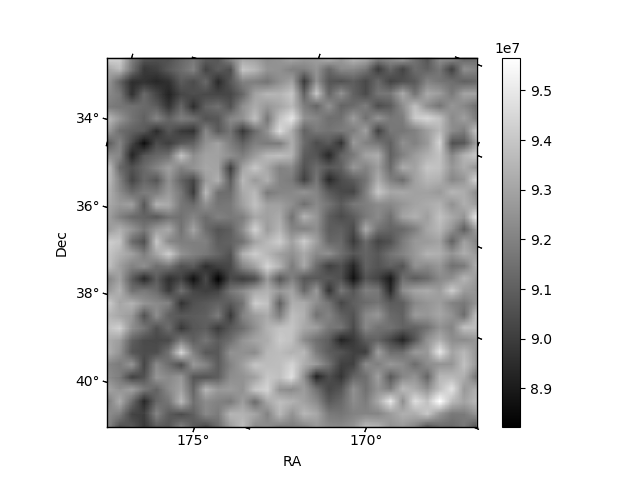
Histogram calculated using DETX and DETY for each event in the final _common_clean file
| Quadrant A | 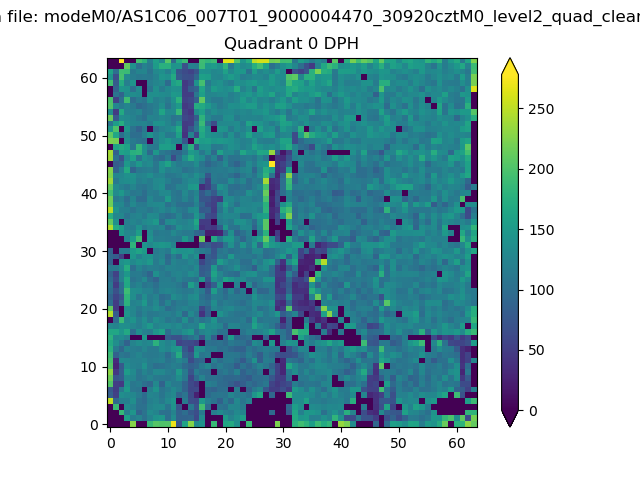 |
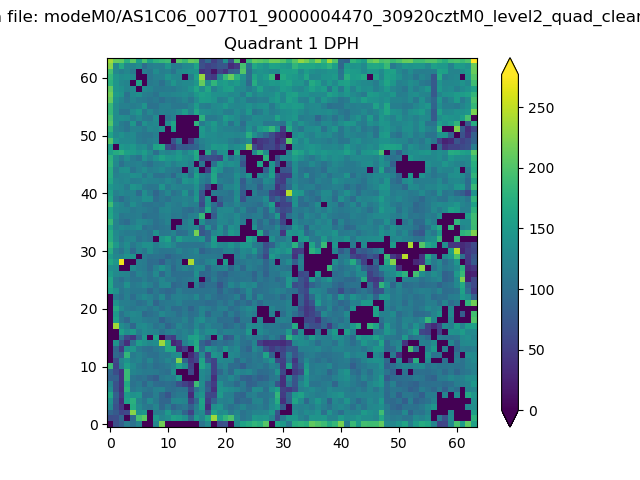 |
Quadrant B |
|---|---|---|---|
| Quadrant D | 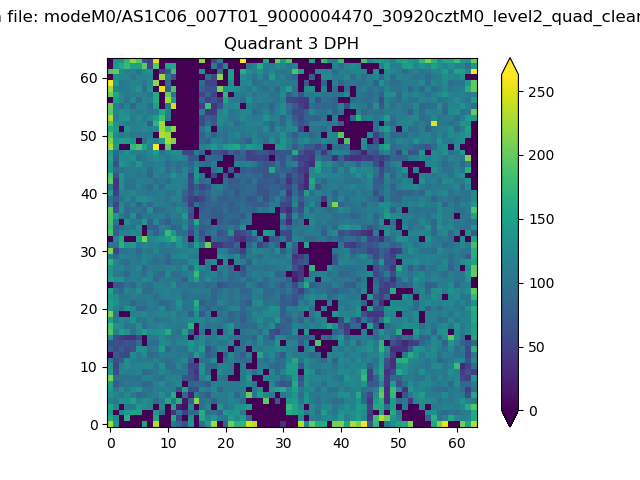 |
 |
Quadrant C |
| Plot type | Count rate plots | Images |
|---|---|---|
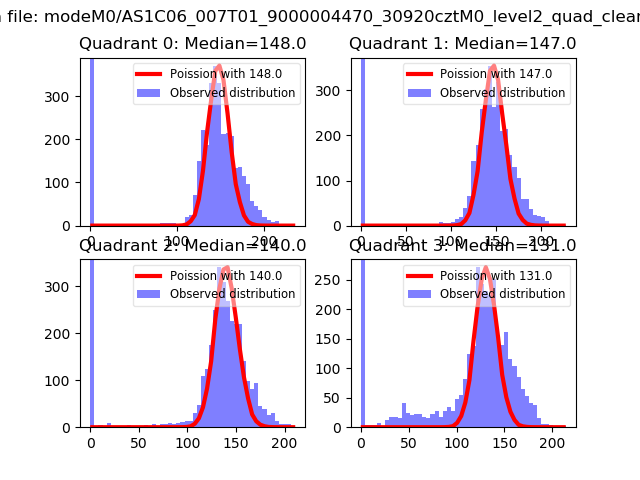
| Comparison with Poisson distribution Blue bars denote a histogram of data divided into 1 sec bins. Red curve is a Poisson curve with rate = median count rate of data. |
 |
 |
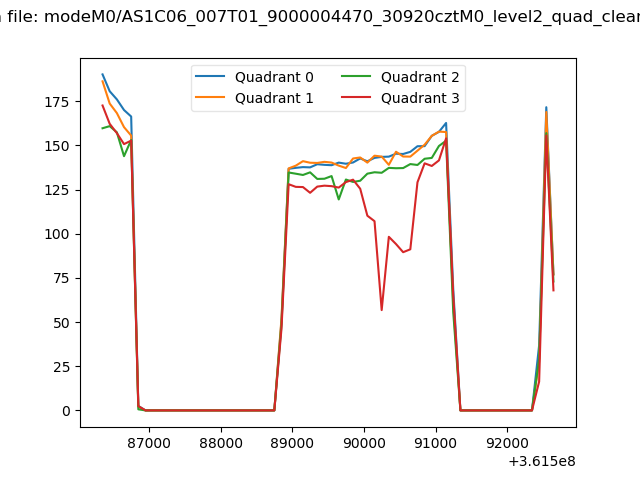
| Quadrant-wise count rates Data is divided into 100 sec bins |
 |
|
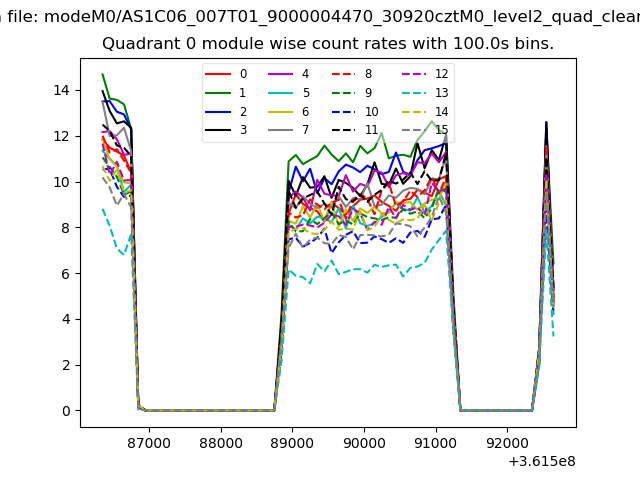
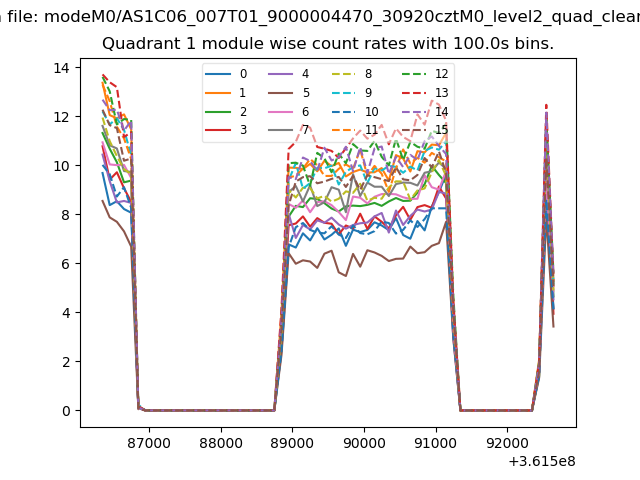
| Module-wise count rates for Quadrant A Data is divided into 100 sec bins |
 |
 |
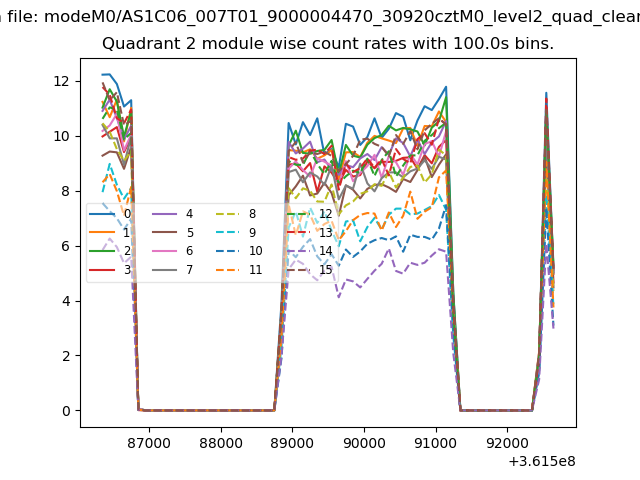
| Module-wise count rates for Quadrant B Data is divided into 100 sec bins |
 |
 |
| Module-wise count rates for Quadrant C Data is divided into 100 sec bins |
 |
 |
| Module-wise count rates for Quadrant D Data is divided into 100 sec bins |
 |
 |
| Parameter | Plot |
|---|---|
| CZT HV Monitor | 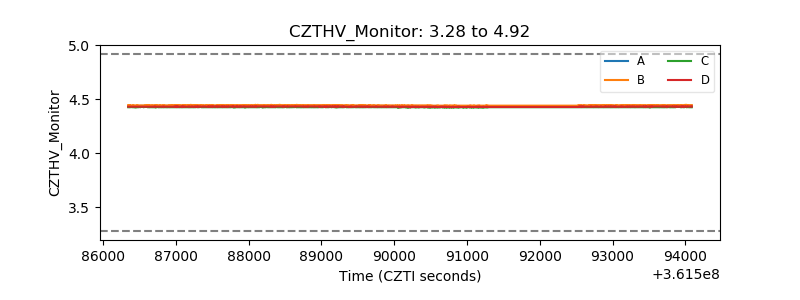 |
| D_VDD | 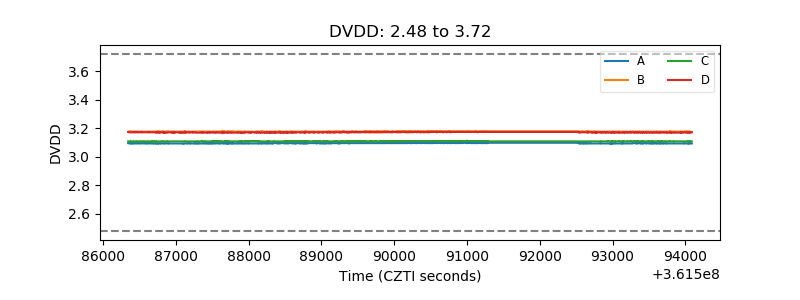 |
| Temperature 1 | 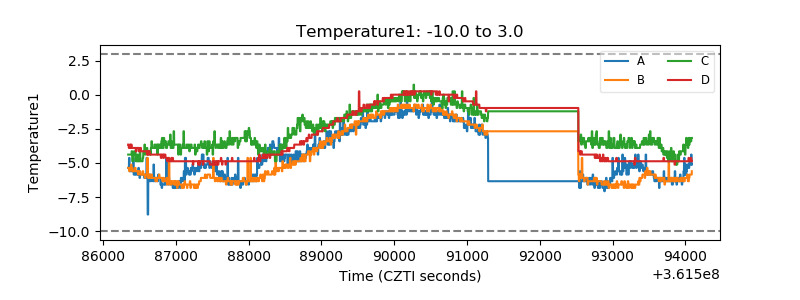 |
| Veto HV Monitor | 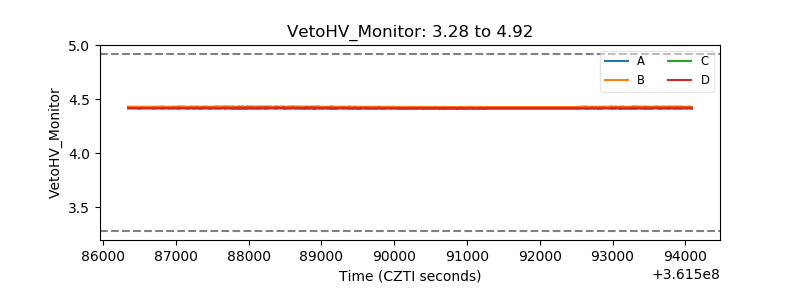 |
| Veto LLD | 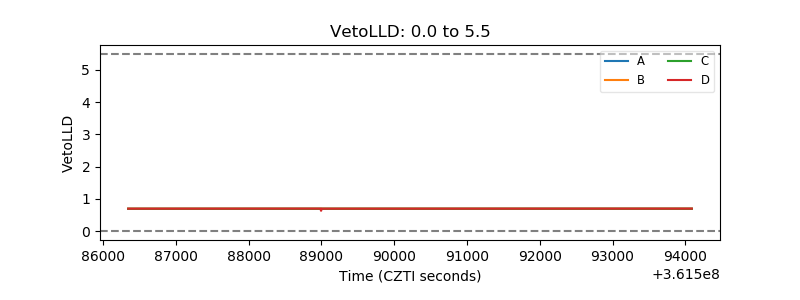 |
| Alpha Counter | 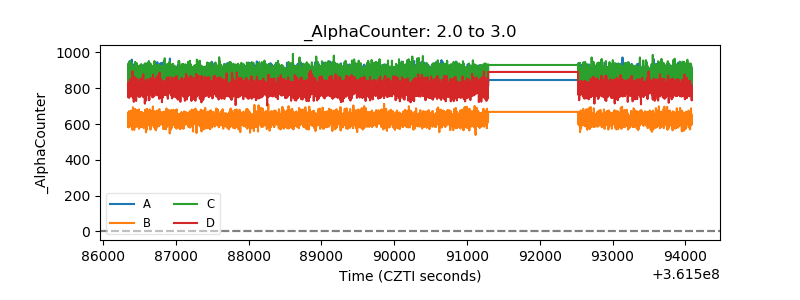 |
| _CPM_Rate | 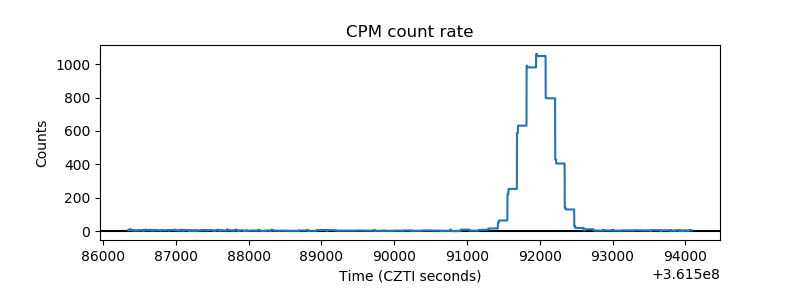 |
| CZT Counter | 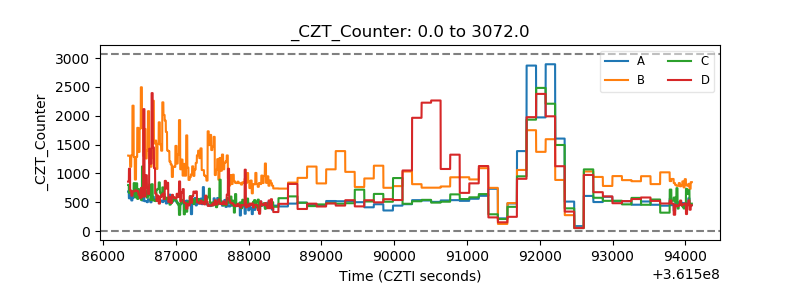 |
| +2.5 Volts monitor |  |
| +5 Volts monitor |  |
| _ROLL_ROT |  |
| _Roll_DEC |  |
| _Roll_RA | 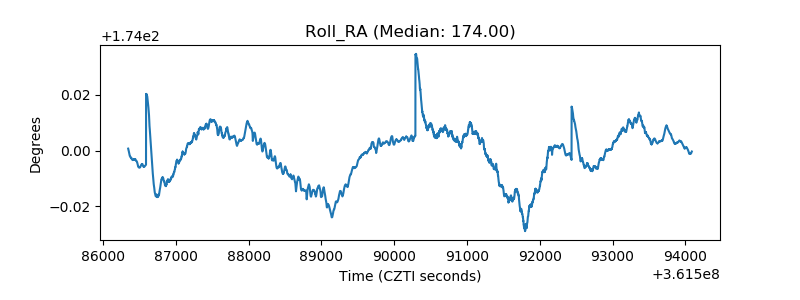 |
| Veto Counter | 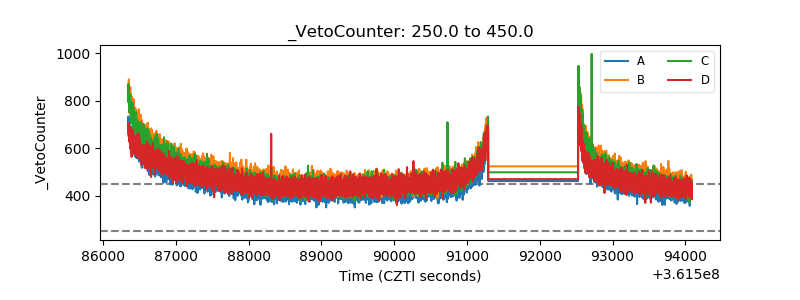 |