| Param | Original file | Final file |
|---|---|---|
| Filename | modeM0/AS1C06_007T01_9000004470_30921cztM0_level2.evt | modeM0/AS1C06_007T01_9000004470_30921cztM0_level2_quad_clean.evt |
| Size (bytes) | 654,690,240 | 67,461,120 |
| Size | 624.4 MB | 64.3 MB |
| Events in quadrant A | 3,139,837 | 427,617 |
| Events in quadrant B | 5,637,674 | 422,875 |
| Events in quadrant C | 3,712,369 | 380,589 |
| Events in quadrant D | 6,902,916 | 362,910 |
| Mode M0 | |||
|---|---|---|---|
| Quadrant | BADHDUFLAG | Total packets | Discarded packets |
| A | 0 | 13231 | 1 |
| B | 0 | 20917 | 1 |
| C | 0 | 14994 | 1 |
| D | 0 | 24796 | 1 |
| Mode M9 | |||
|---|---|---|---|
| Quadrant | BADHDUFLAG | Total packets | Discarded packets |
| A | 0 | 9 | 0 |
| B | 0 | 9 | 0 |
| C | 0 | 9 | 0 |
| D | 0 | 9 | 0 |
| Mode SS | |||
|---|---|---|---|
| Quadrant | BADHDUFLAG | Total packets | Discarded packets |
| A | 0 | 132 | 0 |
| B | 0 | 132 | 0 |
| C | 0 | 132 | 0 |
| D | 0 | 132 | 0 |
| Quadrant | Total seconds | Saturated seconds | Saturation percentage |
|---|---|---|---|
| A | 6416 | 90 | 1.402743% |
| B | 6417 | 230 | 3.584229% |
| C | 6417 | 690 | 10.752688% |
| D | 6417 | 1355 | 21.115786% |
Noise dominated data is calculated using 1-second bins in cleaned event files. If a bin has >2000 counts, and if more than 50% of those come from <1% of pixels, then it is considered to be noise-dominated and hence unusable.
| Quadrant | # 1 sec bins | Bins with >0 counts | Bins with >2000 counts | High rate bins dominated by noise | Noise dominated (total time) | Noise dominated (detector-on time) | Marked lightcurve |
|---|---|---|---|---|---|---|---|
| A | 7326 | 6416 | 0 | 0 | 0.00% | 0.00% | 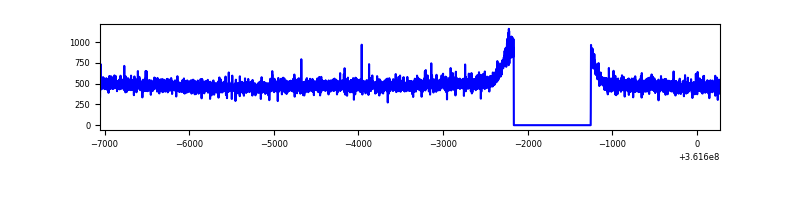 |
| B | 7327 | 6417 | 35 | 35 | 0.48% | 0.55% | 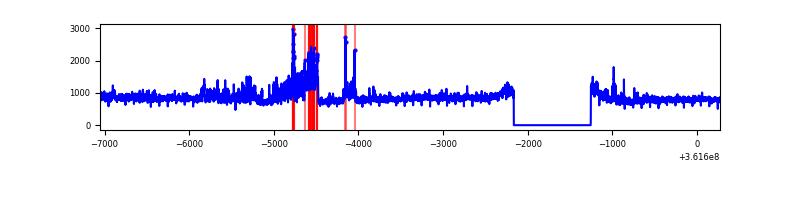 |
| C | 7327 | 6417 | 16 | 16 | 0.22% | 0.25% | 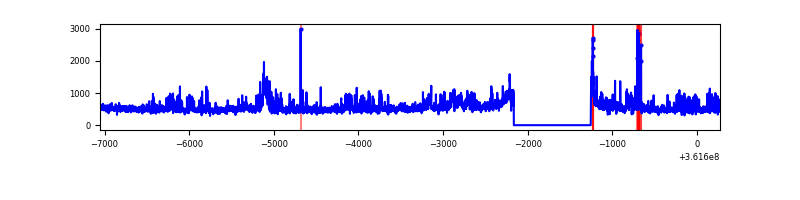 |
| D | 7327 | 6417 | 1203 | 1203 | 16.42% | 18.75% | 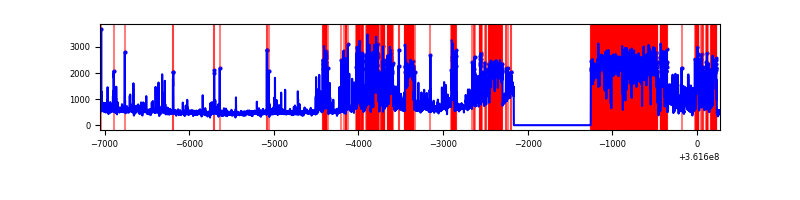 |
Top three noisy pixels from each quadrant. If the there are fewer than three noisy pixels in the level2.evt file, extra rows are filled as -1
| Pixel properties | Quadrant properties | ||||||
|---|---|---|---|---|---|---|---|
| Quadrant | DetID | PixID | Counts | Sigma | Mean | Median | Sigma |
| A | 13 | 254 | 11485 | 65.68 | 814 | 797 | 162.7 |
| A | 3 | 137 | 8024 | 44.41 | 814 | 797 | 162.7 |
| A | 0 | 226 | 6842 | 37.15 | 814 | 797 | 162.7 |
| B | 6 | 159 | 1836356 | 12076.77 | 804 | 784 | 152.0 |
| B | 6 | 36 | 442651 | 2907.17 | 804 | 784 | 152.0 |
| B | 0 | 190 | 63133 | 410.21 | 804 | 784 | 152.0 |
| C | 14 | 238 | 284343 | 1638.3 | 741 | 746 | 173.1 |
| C | 14 | 254 | 234417 | 1349.89 | 741 | 746 | 173.1 |
| C | 3 | 233 | 164050 | 943.39 | 741 | 746 | 173.1 |
| D | 13 | 174 | 2171104 | 12852.65 | 712 | 695 | 168.9 |
| D | 12 | 218 | 1134949 | 6716.79 | 712 | 695 | 168.9 |
| D | 8 | 195 | 423264 | 2502.35 | 712 | 695 | 168.9 |
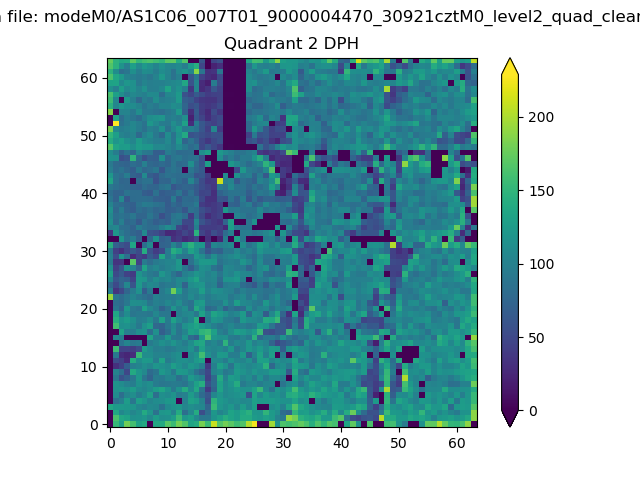
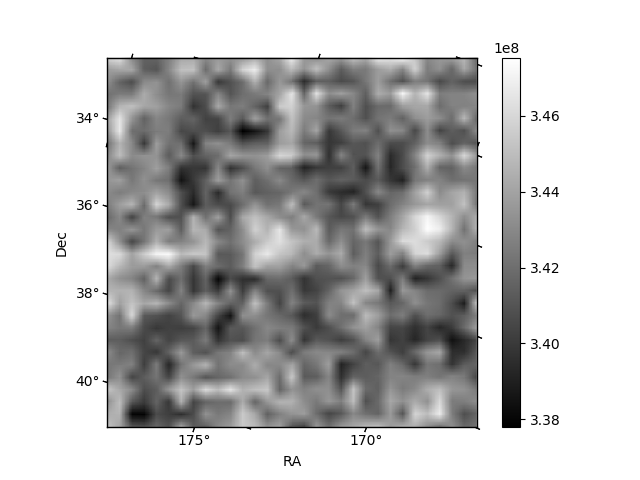
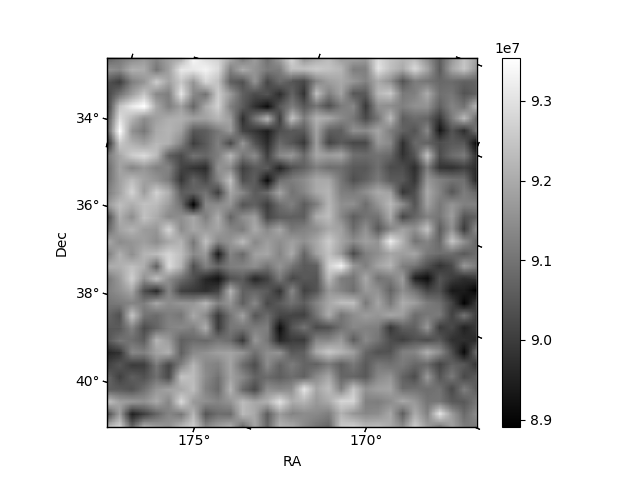
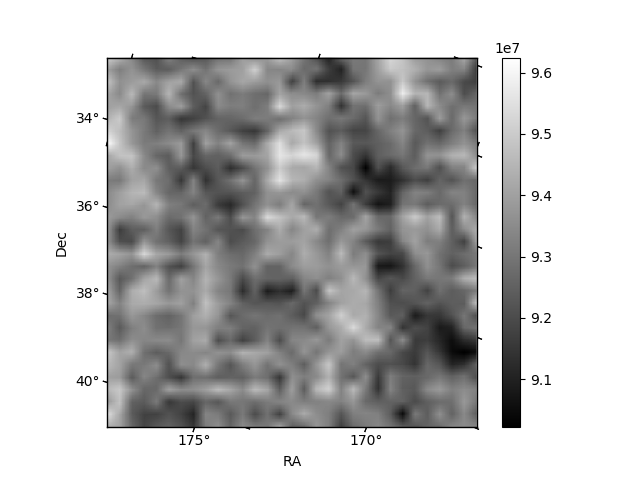
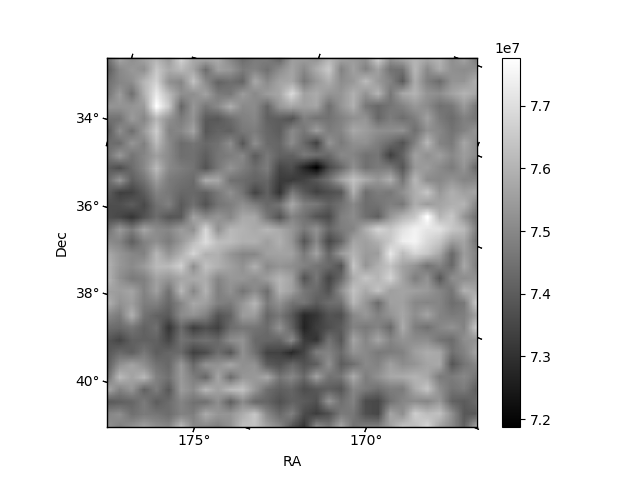
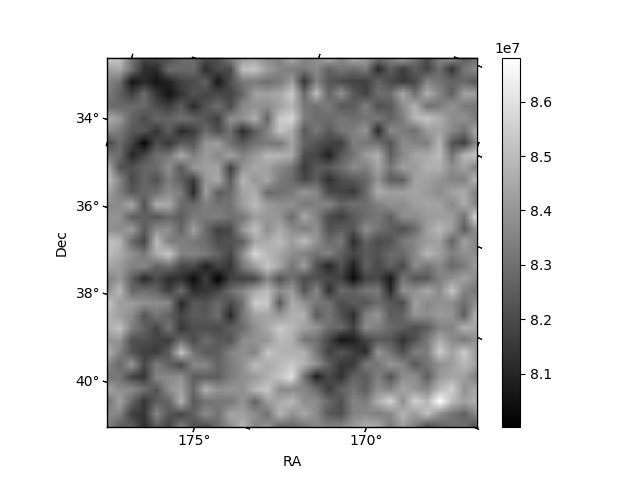
Histogram calculated using DETX and DETY for each event in the final _common_clean file
| Quadrant A | 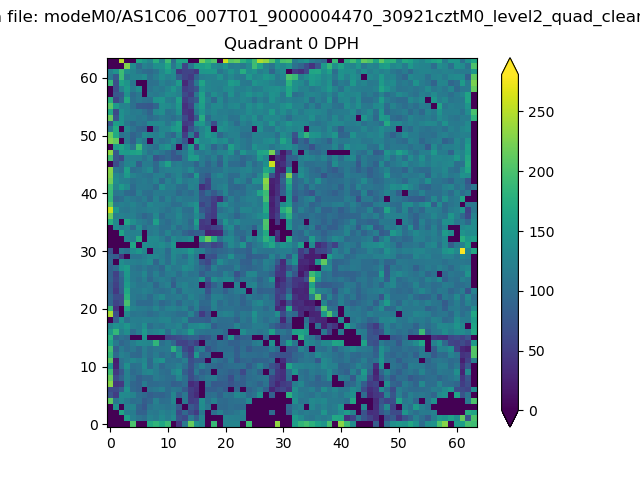 |
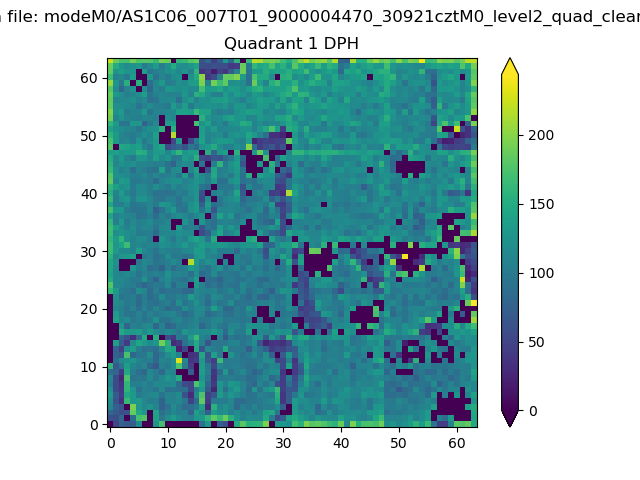 |
Quadrant B |
|---|---|---|---|
| Quadrant D | 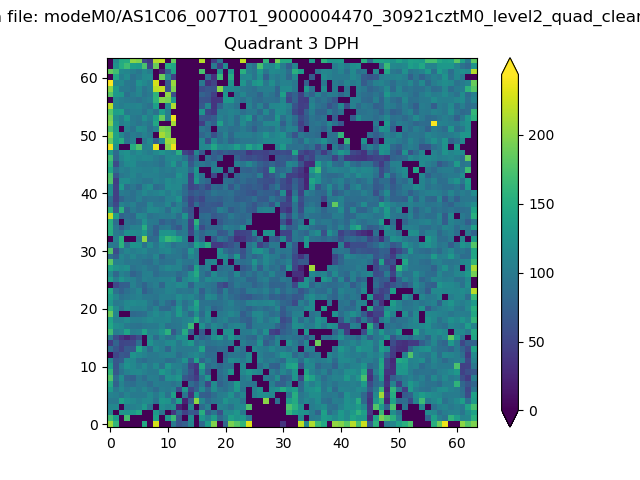 |
 |
Quadrant C |
| Plot type | Count rate plots | Images |
|---|---|---|
| Comparison with Poisson distribution Blue bars denote a histogram of data divided into 1 sec bins. Red curve is a Poisson curve with rate = median count rate of data. |
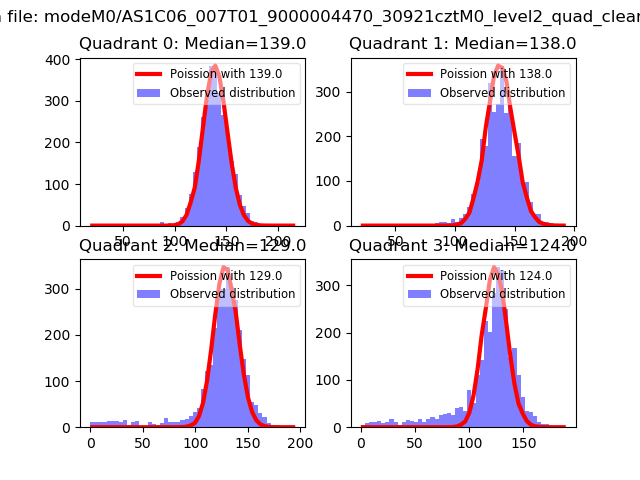 |
 |
| Quadrant-wise count rates Data is divided into 100 sec bins |
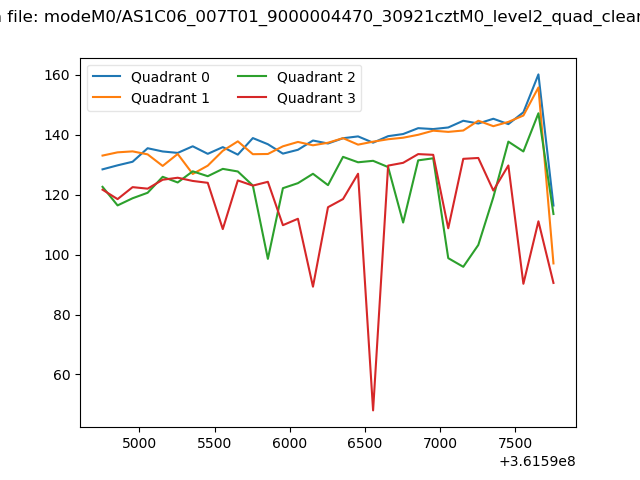 |
|
| Module-wise count rates for Quadrant A Data is divided into 100 sec bins |
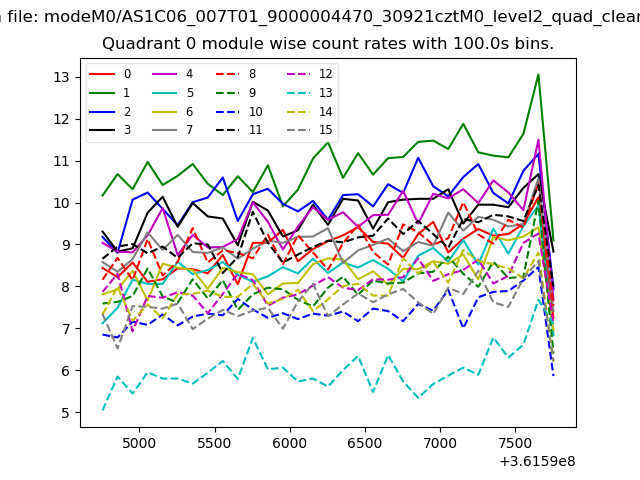 |
 |
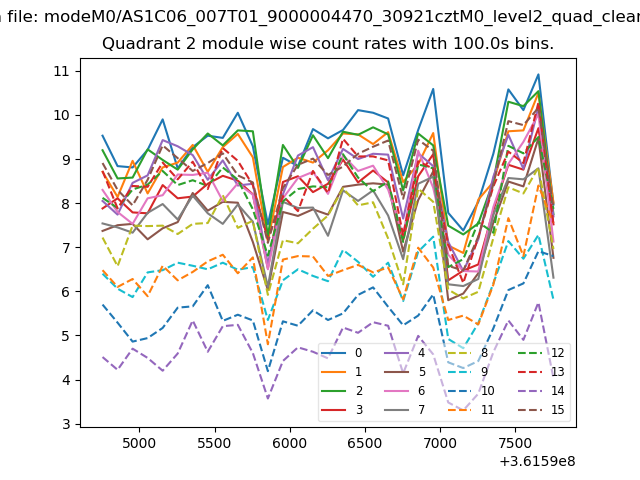
| Module-wise count rates for Quadrant B Data is divided into 100 sec bins |
 |
 |
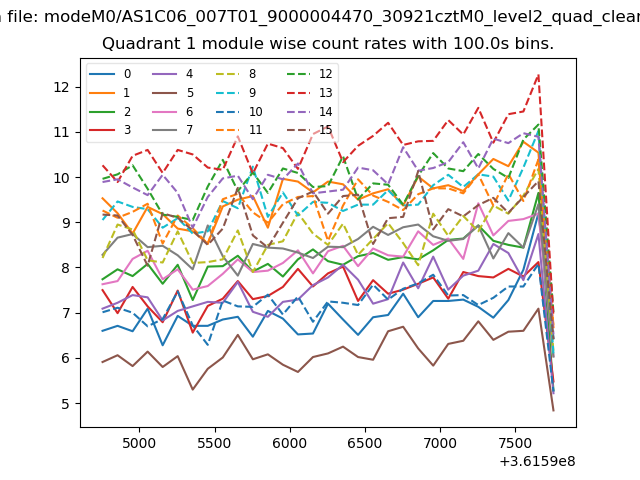
| Module-wise count rates for Quadrant C Data is divided into 100 sec bins |
 |
 |
| Module-wise count rates for Quadrant D Data is divided into 100 sec bins |
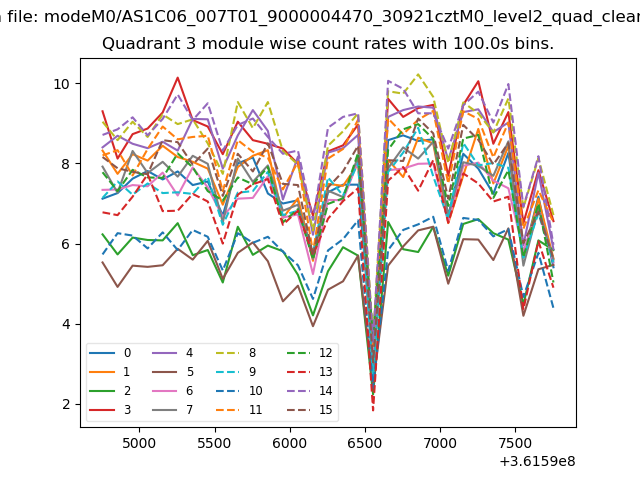 |
 |
| Parameter | Plot |
|---|---|
| CZT HV Monitor | 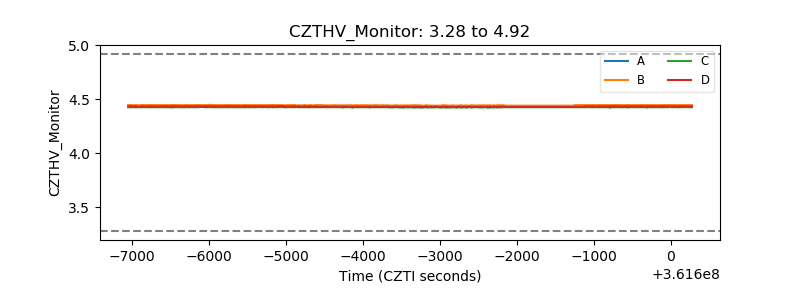 |
| D_VDD | 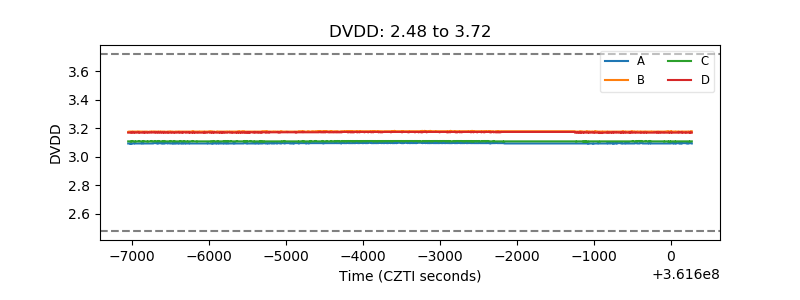 |
| Temperature 1 | 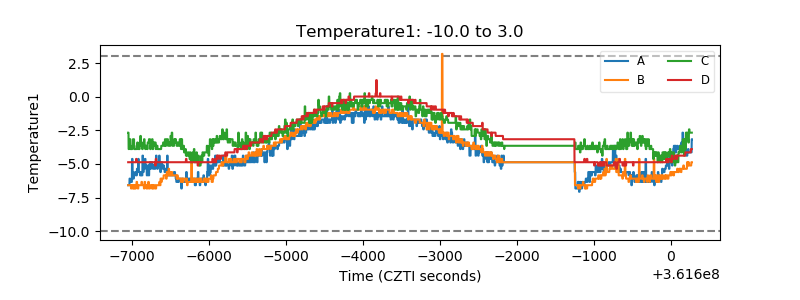 |
| Veto HV Monitor | 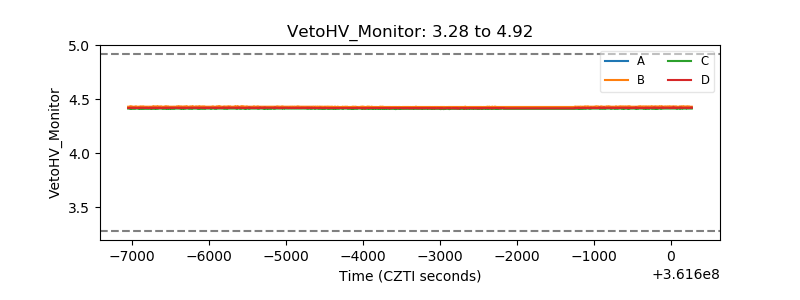 |
| Veto LLD | 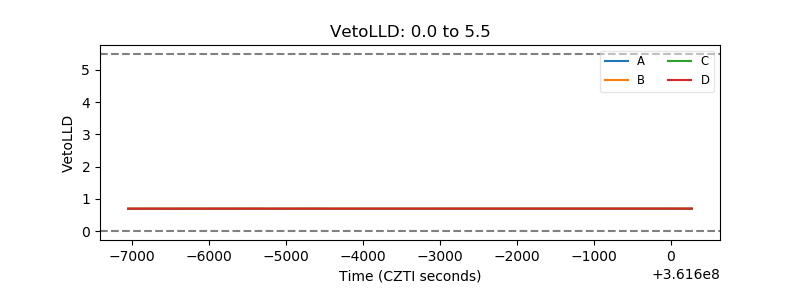 |
| Alpha Counter | 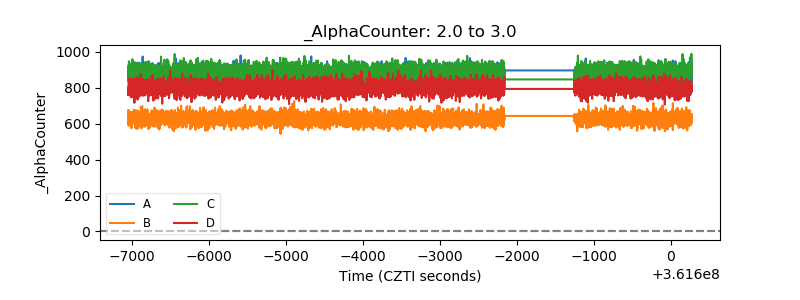 |
| _CPM_Rate | 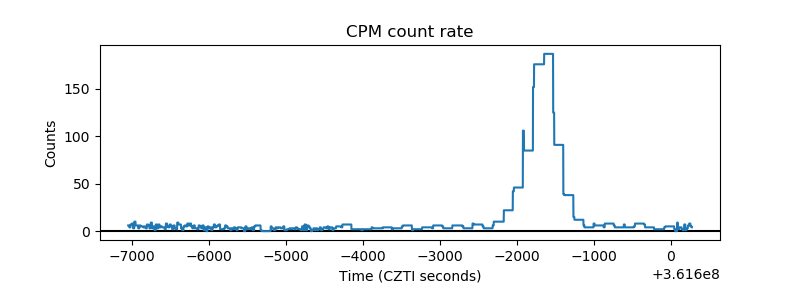 |
| CZT Counter | 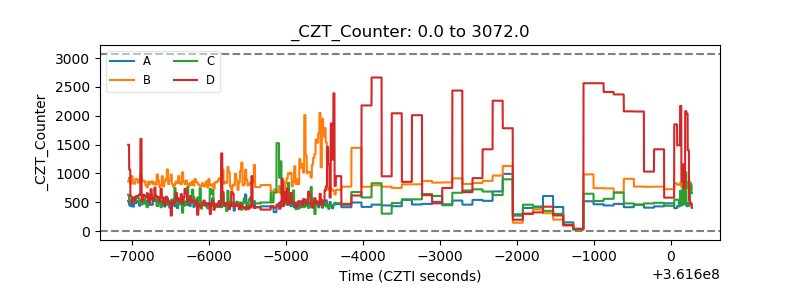 |
| +2.5 Volts monitor |  |
| +5 Volts monitor |  |
| _ROLL_ROT | 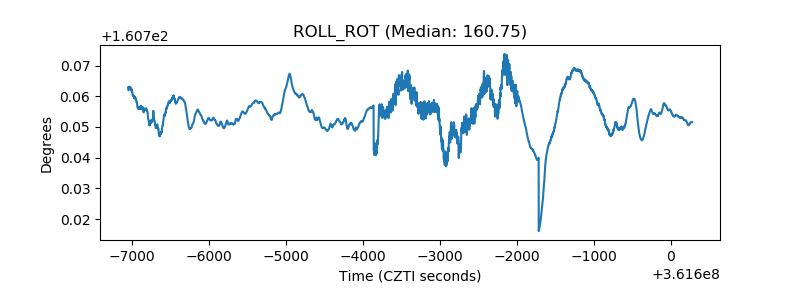 |
| _Roll_DEC |  |
| _Roll_RA | 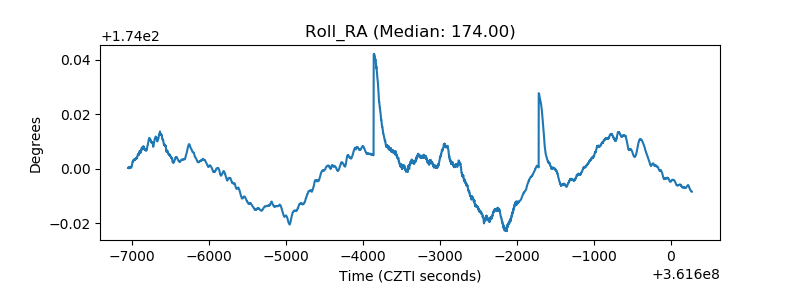 |
| Veto Counter | 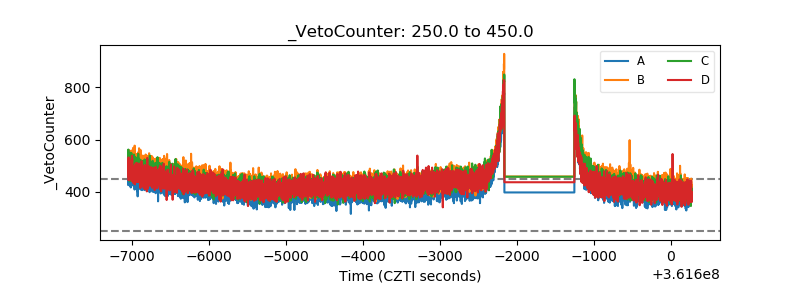 |