| Param | Original file | Final file |
|---|---|---|
| Filename | modeM0/AS1C06_007T01_9000004470_30922cztM0_level2.evt | modeM0/AS1C06_007T01_9000004470_30922cztM0_level2_quad_clean.evt |
| Size (bytes) | 616,875,840 | 79,441,920 |
| Size | 588.3 MB | 75.8 MB |
| Events in quadrant A | 3,171,281 | 509,189 |
| Events in quadrant B | 5,405,255 | 504,377 |
| Events in quadrant C | 3,588,979 | 473,934 |
| Events in quadrant D | 6,066,652 | 454,527 |
| Mode M0 | |||
|---|---|---|---|
| Quadrant | BADHDUFLAG | Total packets | Discarded packets |
| A | 0 | 13636 | 1 |
| B | 0 | 20676 | 1 |
| C | 0 | 14734 | 1 |
| D | 0 | 22670 | 1 |
| Mode M9 | |||
|---|---|---|---|
| Quadrant | BADHDUFLAG | Total packets | Discarded packets |
| A | 0 | 4 | 0 |
| B | 0 | 4 | 0 |
| C | 0 | 4 | 0 |
| D | 0 | 4 | 0 |
| Mode SS | |||
|---|---|---|---|
| Quadrant | BADHDUFLAG | Total packets | Discarded packets |
| A | 0 | 136 | 0 |
| B | 0 | 136 | 0 |
| C | 0 | 136 | 0 |
| D | 0 | 136 | 0 |
| Quadrant | Total seconds | Saturated seconds | Saturation percentage |
|---|---|---|---|
| A | 6641 | 152 | 2.288812% |
| B | 6641 | 258 | 3.884957% |
| C | 6641 | 707 | 10.645987% |
| D | 6642 | 641 | 9.650708% |
Noise dominated data is calculated using 1-second bins in cleaned event files. If a bin has >2000 counts, and if more than 50% of those come from <1% of pixels, then it is considered to be noise-dominated and hence unusable.
| Quadrant | # 1 sec bins | Bins with >0 counts | Bins with >2000 counts | High rate bins dominated by noise | Noise dominated (total time) | Noise dominated (detector-on time) | Marked lightcurve |
|---|---|---|---|---|---|---|---|
| A | 7081 | 6641 | 0 | 0 | 0.00% | 0.00% | 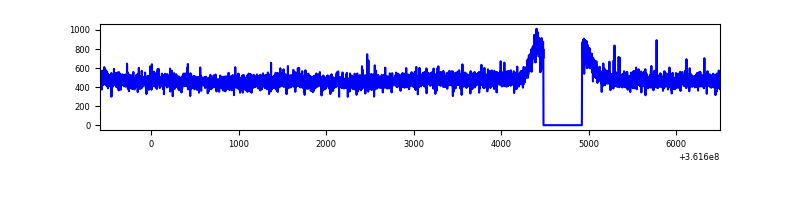 |
| B | 7081 | 6641 | 14 | 14 | 0.20% | 0.21% | 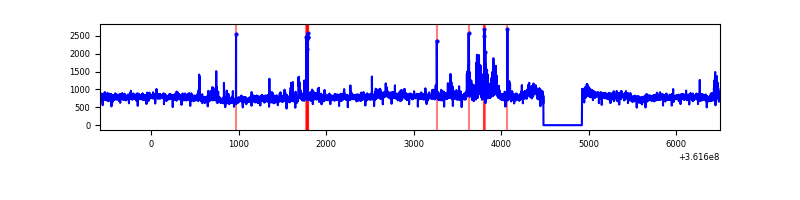 |
| C | 7081 | 6641 | 0 | 0 | 0.00% | 0.00% | 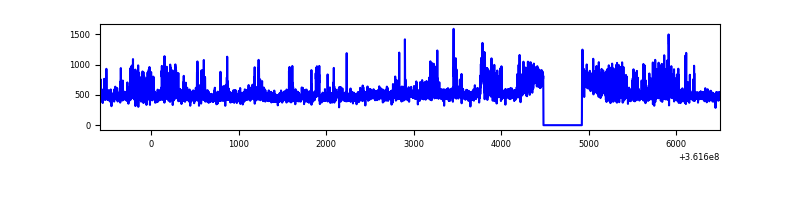 |
| D | 7082 | 6642 | 487 | 487 | 6.88% | 7.33% | 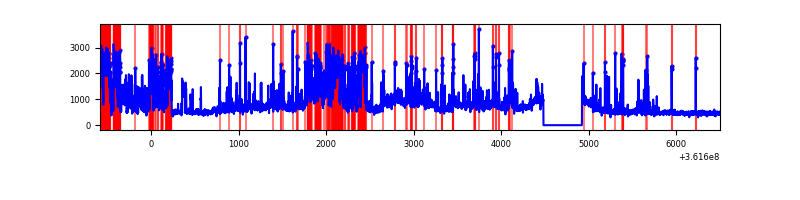 |
Top three noisy pixels from each quadrant. If the there are fewer than three noisy pixels in the level2.evt file, extra rows are filled as -1
| Pixel properties | Quadrant properties | ||||||
|---|---|---|---|---|---|---|---|
| Quadrant | DetID | PixID | Counts | Sigma | Mean | Median | Sigma |
| A | 13 | 254 | 11930 | 67.35 | 820 | 800 | 165.3 |
| A | 3 | 137 | 8011 | 43.63 | 820 | 800 | 165.3 |
| A | 0 | 226 | 7031 | 37.7 | 820 | 800 | 165.3 |
| B | 6 | 159 | 1915901 | 12172.56 | 811 | 792 | 157.3 |
| B | 6 | 36 | 128412 | 811.16 | 811 | 792 | 157.3 |
| B | 0 | 190 | 50844 | 318.13 | 811 | 792 | 157.3 |
| C | 14 | 238 | 275806 | 1571.38 | 751 | 756 | 175.0 |
| C | 14 | 254 | 223787 | 1274.19 | 751 | 756 | 175.0 |
| C | 3 | 233 | 83091 | 470.39 | 751 | 756 | 175.0 |
| D | 13 | 174 | 857670 | 4595.98 | 772 | 748 | 186.5 |
| D | 8 | 195 | 816344 | 4374.34 | 772 | 748 | 186.5 |
| D | 12 | 218 | 650902 | 3487.01 | 772 | 748 | 186.5 |
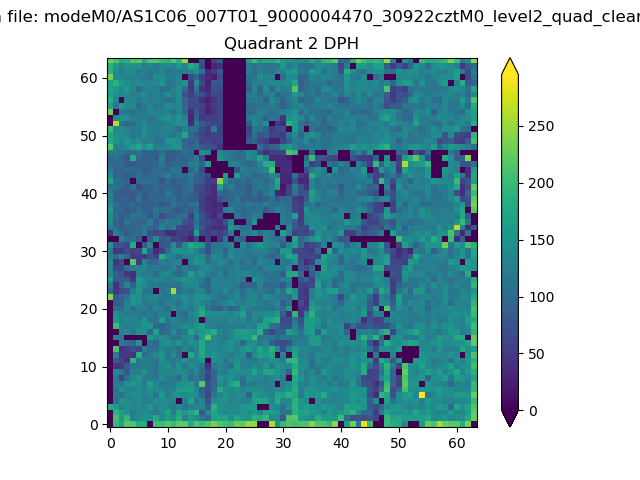
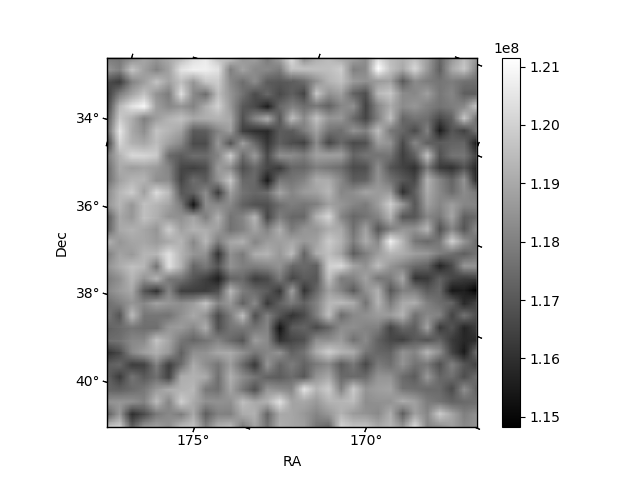
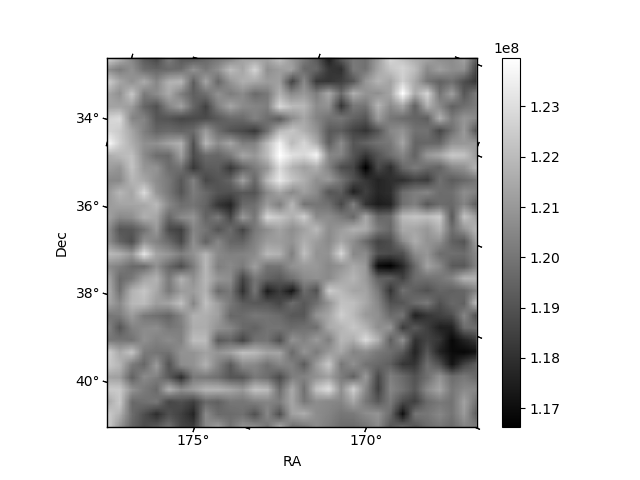
Histogram calculated using DETX and DETY for each event in the final _common_clean file
| Quadrant A | 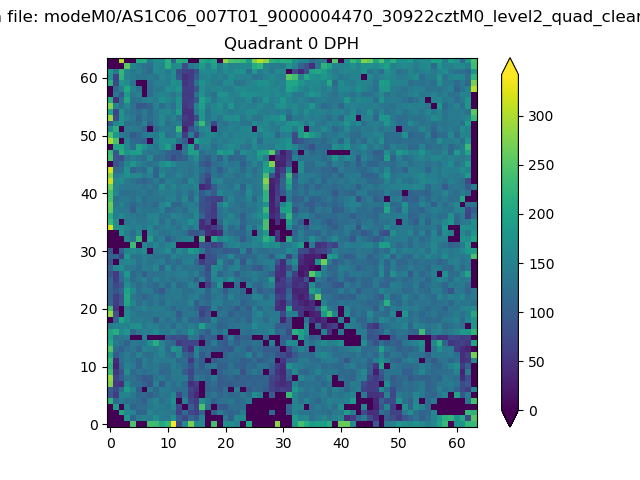 |
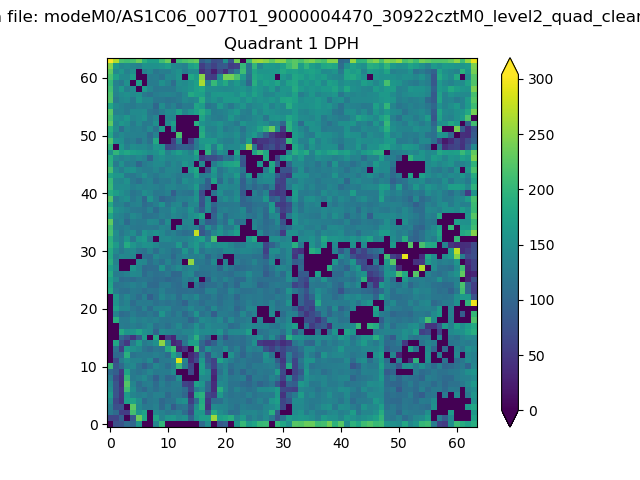 |
Quadrant B |
|---|---|---|---|
| Quadrant D | 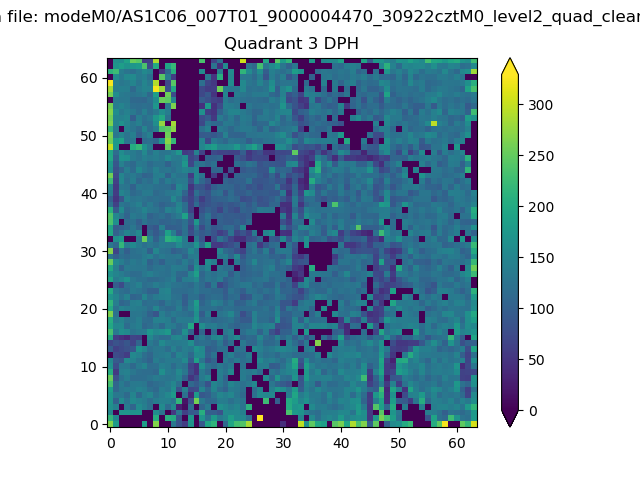 |
 |
Quadrant C |
| Plot type | Count rate plots | Images |
|---|---|---|
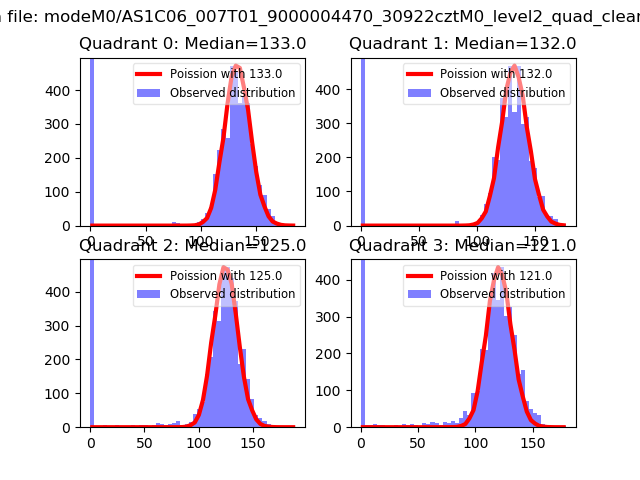
| Comparison with Poisson distribution Blue bars denote a histogram of data divided into 1 sec bins. Red curve is a Poisson curve with rate = median count rate of data. |
 |
 |
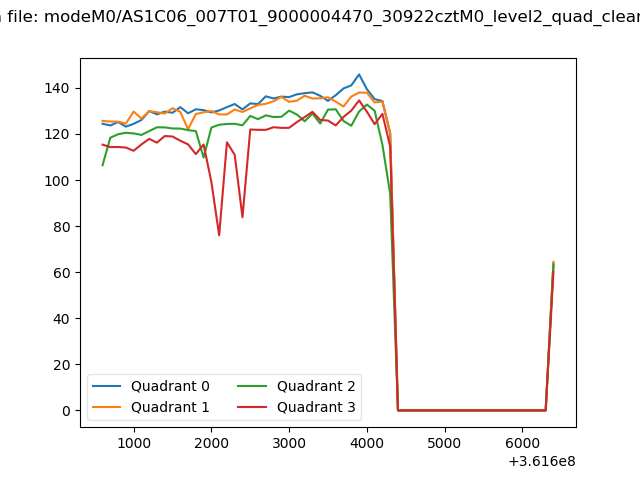
| Quadrant-wise count rates Data is divided into 100 sec bins |
 |
|
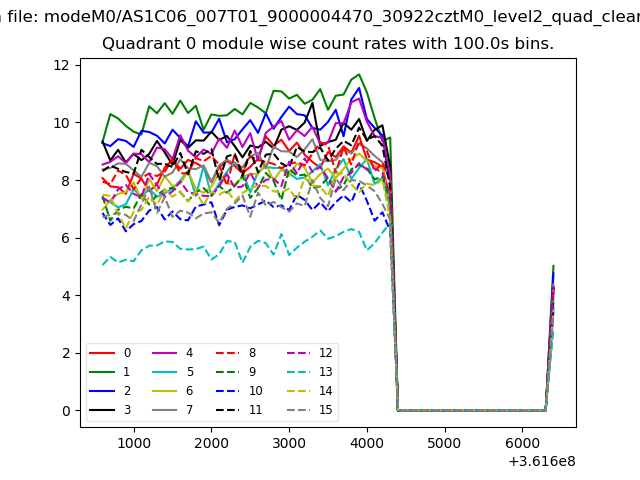
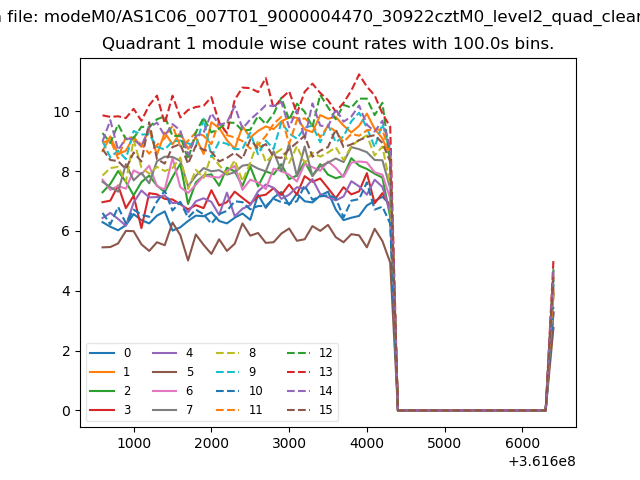
| Module-wise count rates for Quadrant A Data is divided into 100 sec bins |
 |
 |
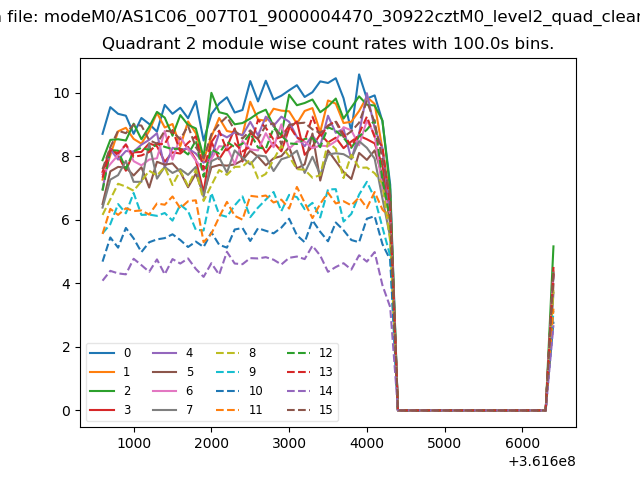
| Module-wise count rates for Quadrant B Data is divided into 100 sec bins |
 |
 |
| Module-wise count rates for Quadrant C Data is divided into 100 sec bins |
 |
 |
| Module-wise count rates for Quadrant D Data is divided into 100 sec bins |
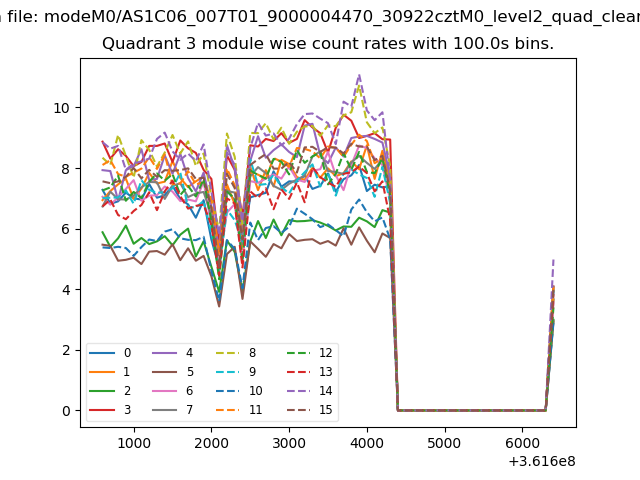 |
 |
| Parameter | Plot |
|---|---|
| CZT HV Monitor | 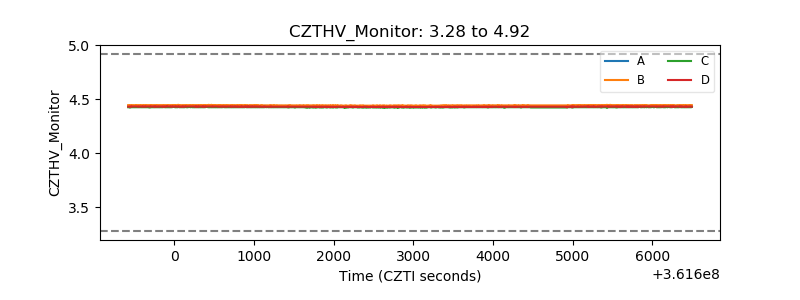 |
| D_VDD |  |
| Temperature 1 | 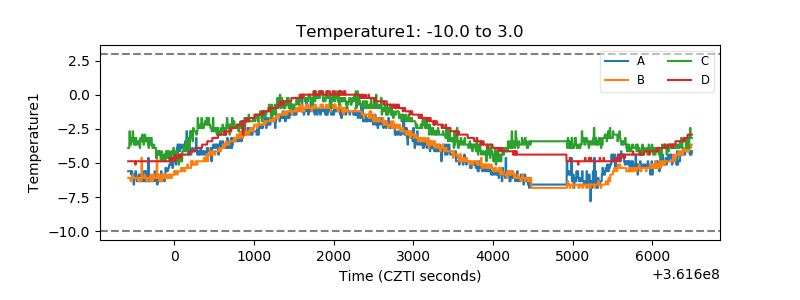 |
| Veto HV Monitor | 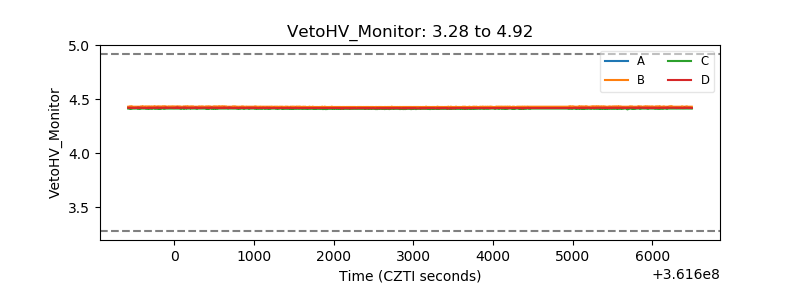 |
| Veto LLD |  |
| Alpha Counter | 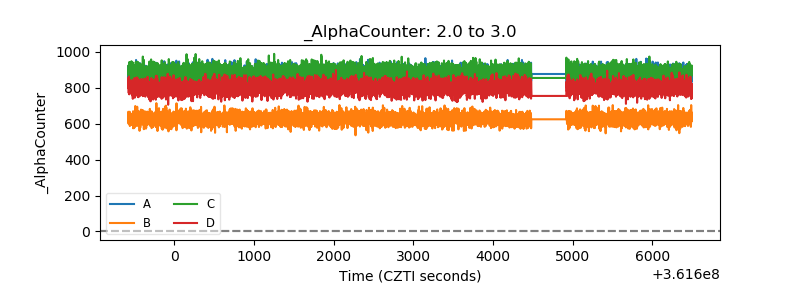 |
| _CPM_Rate | 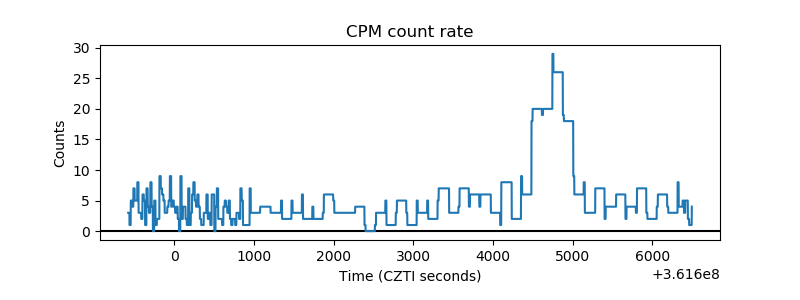 |
| CZT Counter | 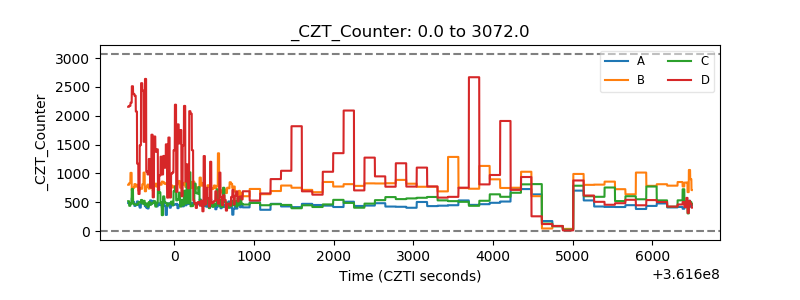 |
| +2.5 Volts monitor |  |
| +5 Volts monitor |  |
| _ROLL_ROT | 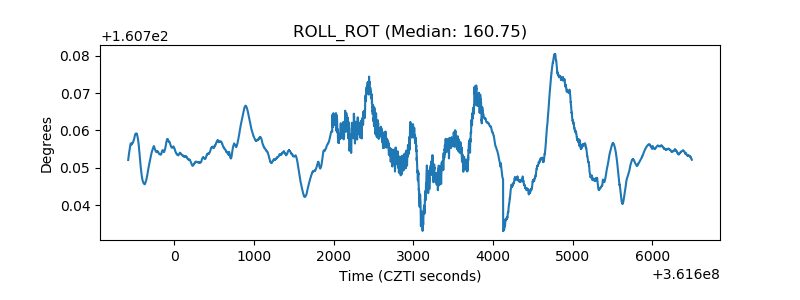 |
| _Roll_DEC | 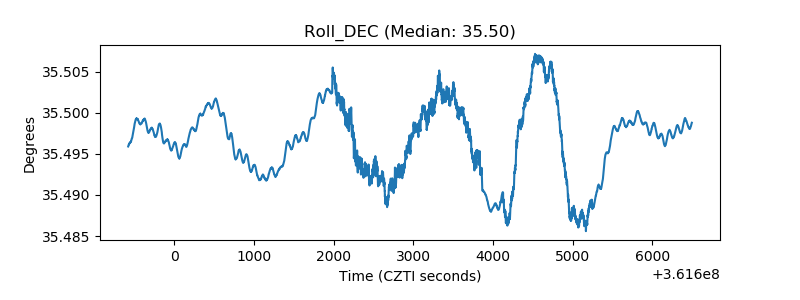 |
| _Roll_RA | 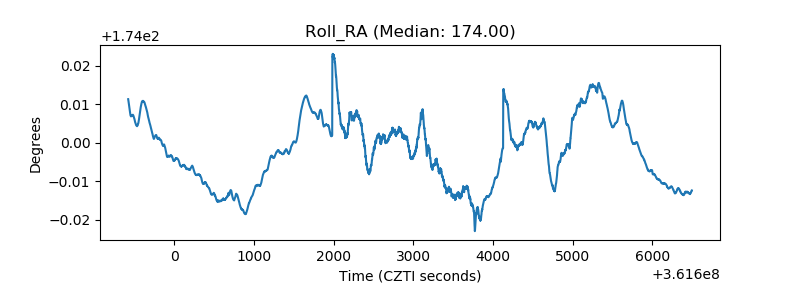 |
| Veto Counter | 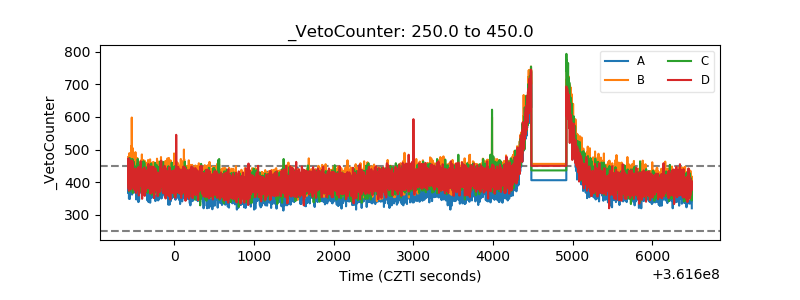 |