| Param | Original file | Final file |
|---|---|---|
| Filename | modeM0/AS1C06_007T01_9000004470_30923cztM0_level2.evt | modeM0/AS1C06_007T01_9000004470_30923cztM0_level2_quad_clean.evt |
| Size (bytes) | 714,119,040 | 85,936,320 |
| Size | 681.0 MB | 82.0 MB |
| Events in quadrant A | 3,741,467 | 540,891 |
| Events in quadrant B | 6,195,994 | 537,713 |
| Events in quadrant C | 4,652,939 | 498,670 |
| Events in quadrant D | 6,509,185 | 482,966 |
| Mode M0 | |||
|---|---|---|---|
| Quadrant | BADHDUFLAG | Total packets | Discarded packets |
| A | 0 | 16179 | 2 |
| B | 0 | 24053 | 2 |
| C | 0 | 18762 | 2 |
| D | 0 | 24553 | 2 |
| Mode M9 | |||
|---|---|---|---|
| Quadrant | BADHDUFLAG | Total packets | Discarded packets |
| A | 1 | 139684788243240 | 46 |
| B | 1 | -1 | -1 |
| C | 1 | -1 | -1 |
| D | 1 | -1 | -1 |
| Mode SS | |||
|---|---|---|---|
| Quadrant | BADHDUFLAG | Total packets | Discarded packets |
| A | 0 | 156 | 0 |
| B | 0 | 156 | 0 |
| C | 0 | 156 | 0 |
| D | 0 | 156 | 0 |
| Quadrant | Total seconds | Saturated seconds | Saturation percentage |
|---|---|---|---|
| A | 7790 | 294 | 3.774069% |
| B | 7790 | 494 | 6.341463% |
| C | 7790 | 1242 | 15.943517% |
| D | 7790 | 664 | 8.523748% |
Noise dominated data is calculated using 1-second bins in cleaned event files. If a bin has >2000 counts, and if more than 50% of those come from <1% of pixels, then it is considered to be noise-dominated and hence unusable.
| Quadrant | # 1 sec bins | Bins with >0 counts | Bins with >2000 counts | High rate bins dominated by noise | Noise dominated (total time) | Noise dominated (detector-on time) | Marked lightcurve |
|---|---|---|---|---|---|---|---|
| A | 7820 | 7791 | 0 | 0 | 0.00% | 0.00% | 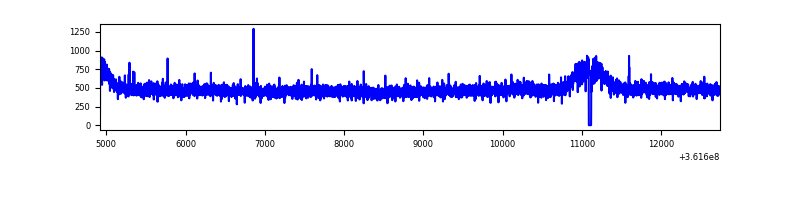 |
| B | 7820 | 7790 | 24 | 24 | 0.31% | 0.31% | 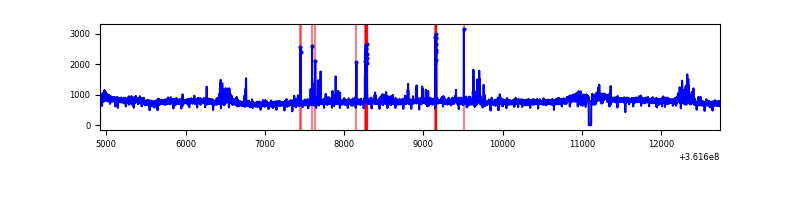 |
| C | 7820 | 7791 | 18 | 18 | 0.23% | 0.23% |  |
| D | 7820 | 7791 | 398 | 398 | 5.09% | 5.11% | 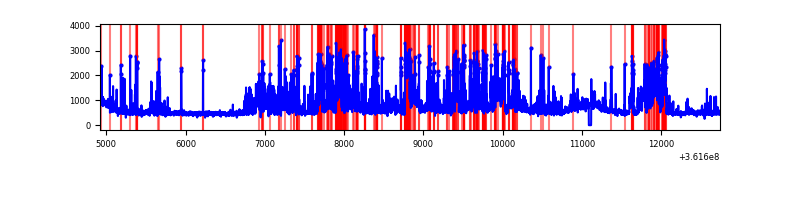 |
Top three noisy pixels from each quadrant. If the there are fewer than three noisy pixels in the level2.evt file, extra rows are filled as -1
| Pixel properties | Quadrant properties | ||||||
|---|---|---|---|---|---|---|---|
| Quadrant | DetID | PixID | Counts | Sigma | Mean | Median | Sigma |
| A | 13 | 254 | 14591 | 69.8 | 966 | 943 | 195.5 |
| A | 3 | 137 | 9635 | 44.45 | 966 | 943 | 195.5 |
| A | 0 | 226 | 8129 | 36.75 | 966 | 943 | 195.5 |
| B | 6 | 159 | 2194626 | 11937.84 | 951 | 926 | 183.8 |
| B | 0 | 190 | 90090 | 485.22 | 951 | 926 | 183.8 |
| B | 5 | 172 | 48055 | 256.47 | 951 | 926 | 183.8 |
| C | 14 | 238 | 398718 | 1959.22 | 870 | 873 | 203.1 |
| C | 14 | 254 | 369763 | 1816.63 | 870 | 873 | 203.1 |
| C | 3 | 233 | 353815 | 1738.09 | 870 | 873 | 203.1 |
| D | 12 | 218 | 932600 | 4246.69 | 915 | 887 | 219.4 |
| D | 13 | 174 | 481522 | 2190.7 | 915 | 887 | 219.4 |
| D | 1 | 52 | 467138 | 2125.14 | 915 | 887 | 219.4 |
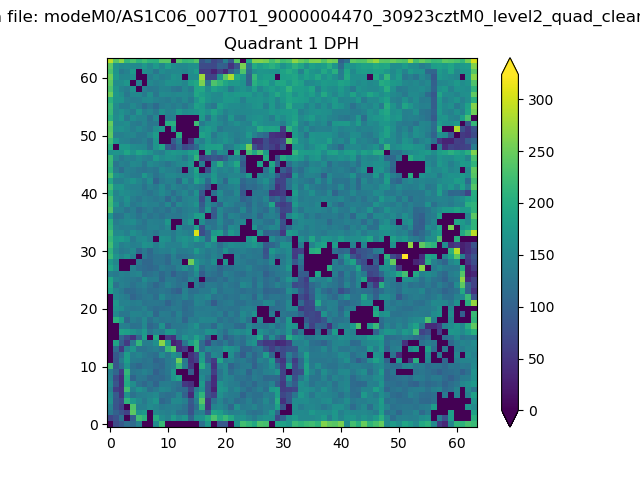
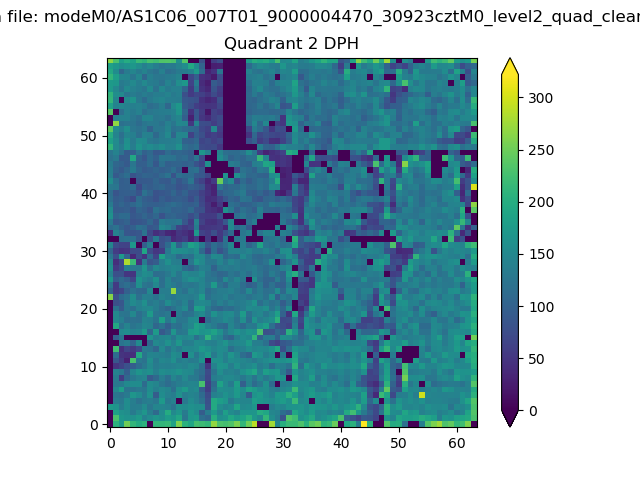
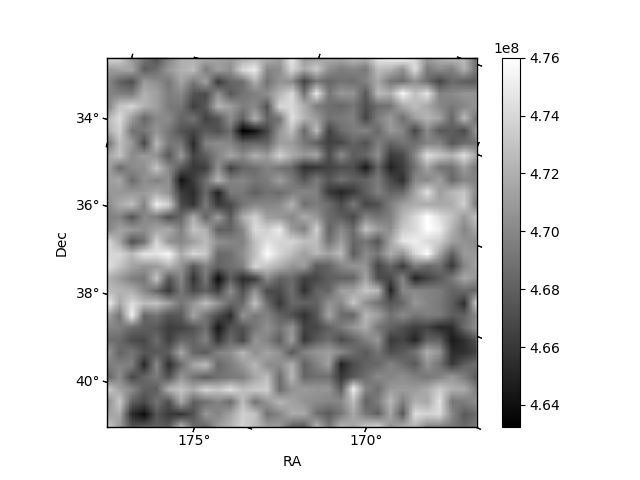
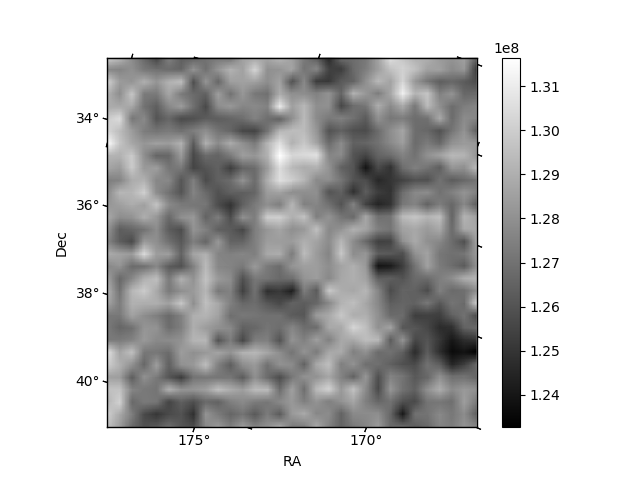
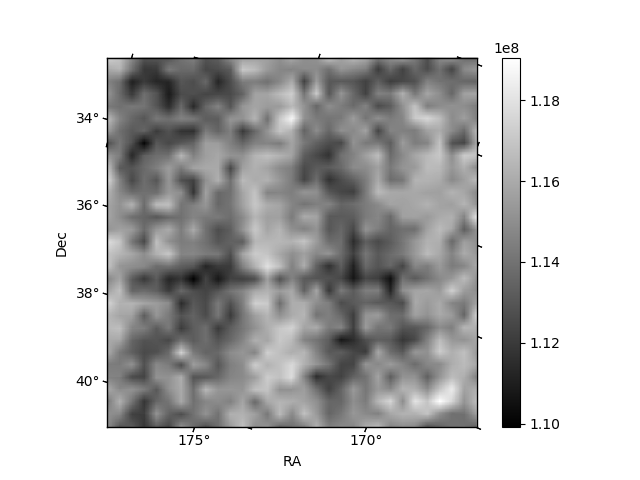
Histogram calculated using DETX and DETY for each event in the final _common_clean file
| Quadrant A | 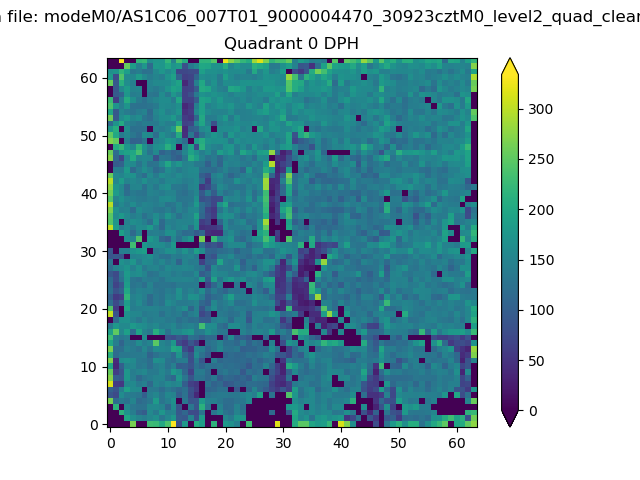 |
 |
Quadrant B |
|---|---|---|---|
| Quadrant D | 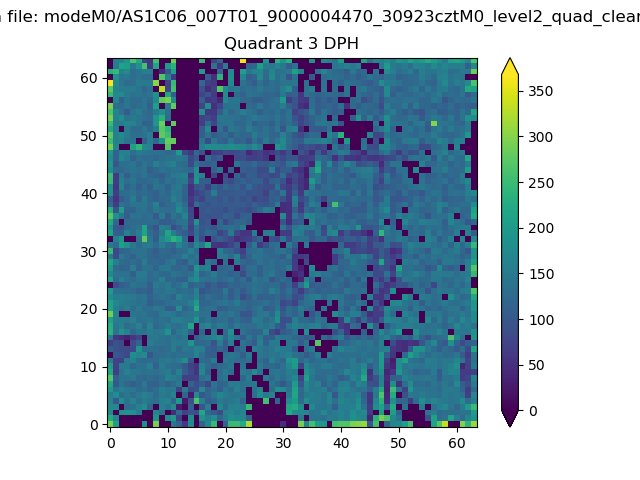 |
 |
Quadrant C |
| Plot type | Count rate plots | Images |
|---|---|---|
| Comparison with Poisson distribution Blue bars denote a histogram of data divided into 1 sec bins. Red curve is a Poisson curve with rate = median count rate of data. |
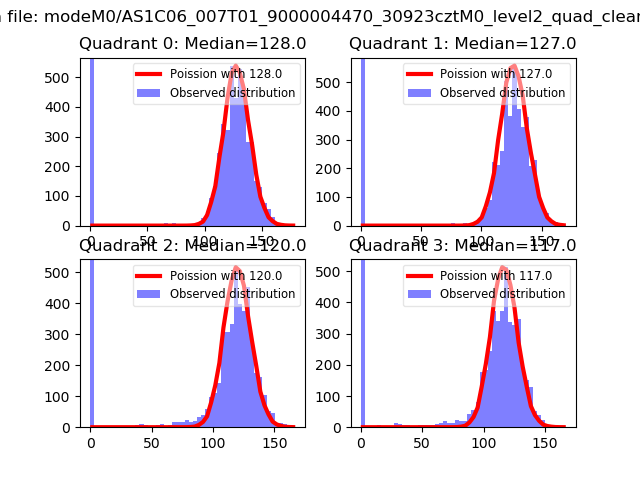 |
 |
| Quadrant-wise count rates Data is divided into 100 sec bins |
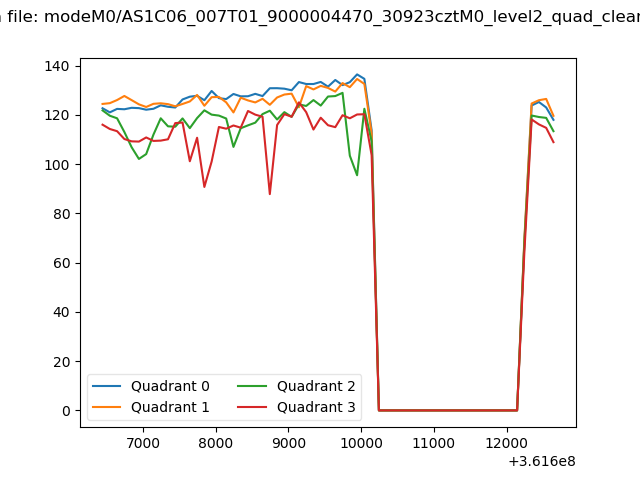 |
|
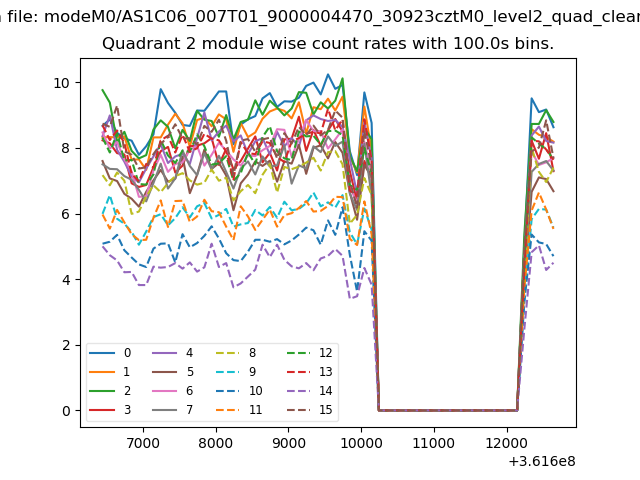
| Module-wise count rates for Quadrant A Data is divided into 100 sec bins |
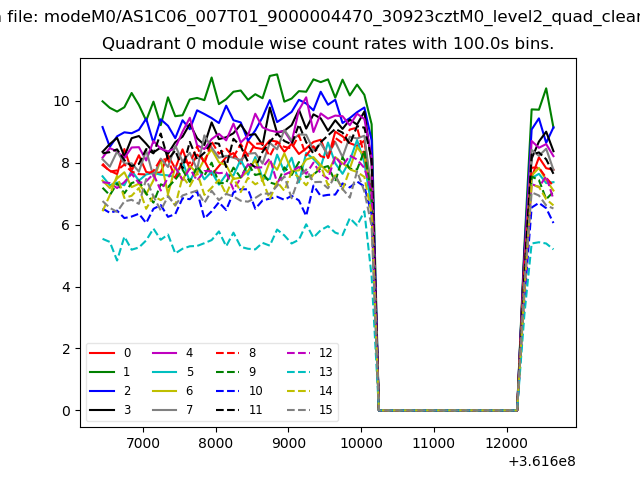 |
 |
| Module-wise count rates for Quadrant B Data is divided into 100 sec bins |
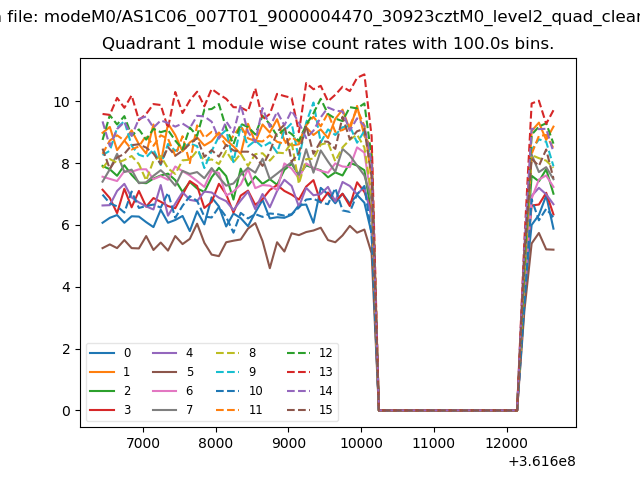 |
 |
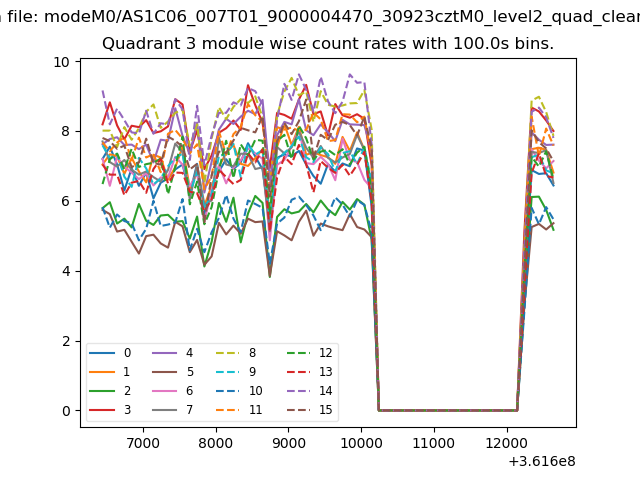
| Module-wise count rates for Quadrant C Data is divided into 100 sec bins |
 |
 |
| Module-wise count rates for Quadrant D Data is divided into 100 sec bins |
 |
 |
| Parameter | Plot |
|---|---|
| CZT HV Monitor | 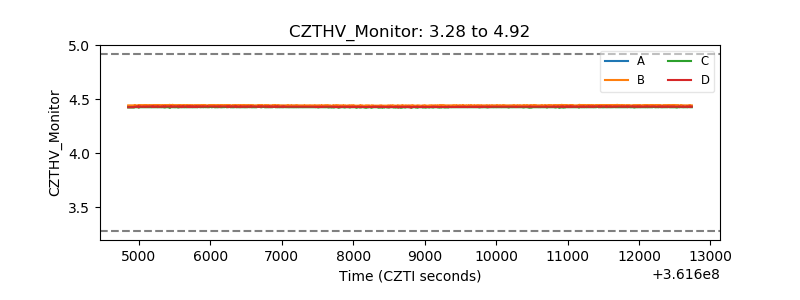 |
| D_VDD | 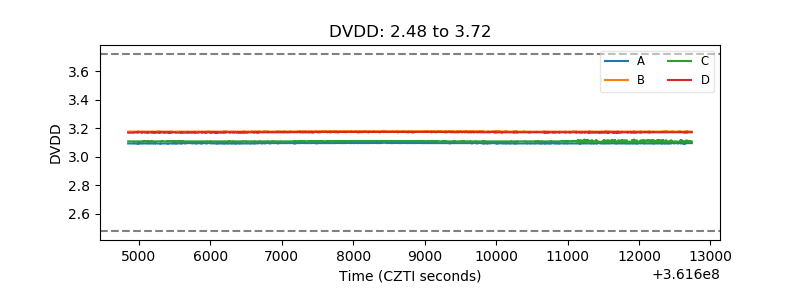 |
| Temperature 1 | 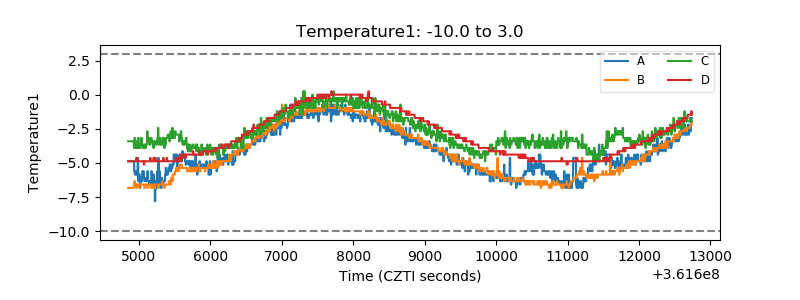 |
| Veto HV Monitor |  |
| Veto LLD | 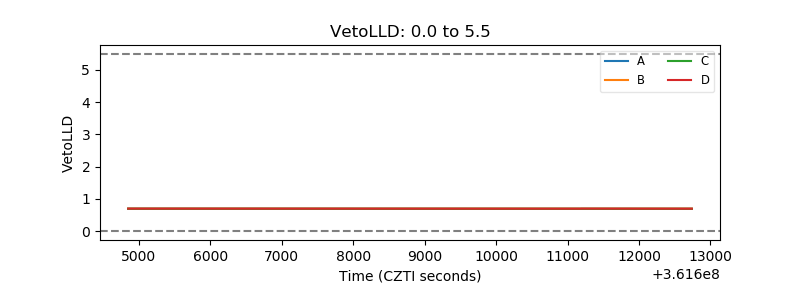 |
| Alpha Counter | 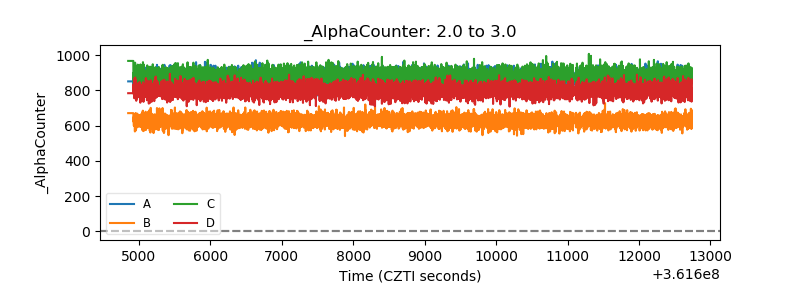 |
| _CPM_Rate | 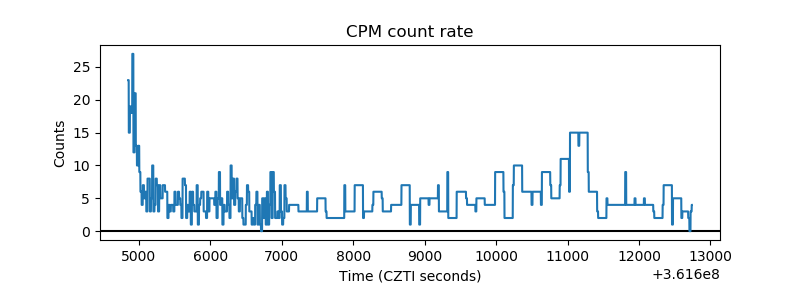 |
| CZT Counter | 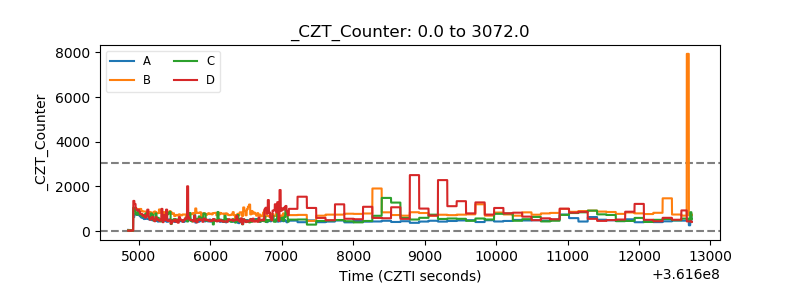 |
| +2.5 Volts monitor |  |
| +5 Volts monitor | 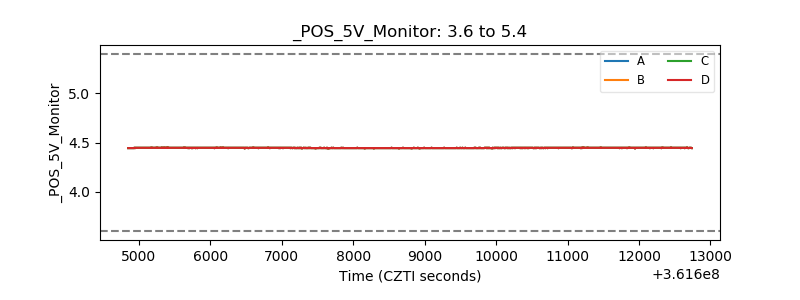 |
| _ROLL_ROT | 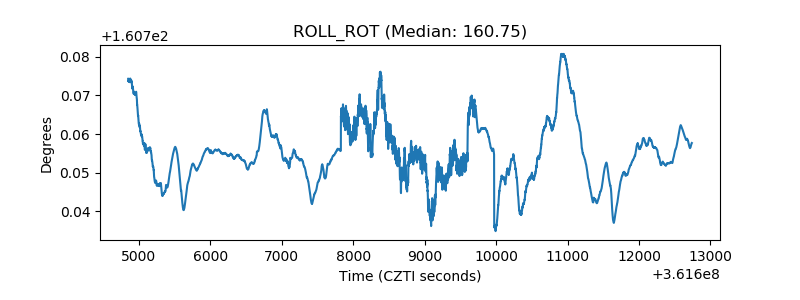 |
| _Roll_DEC | 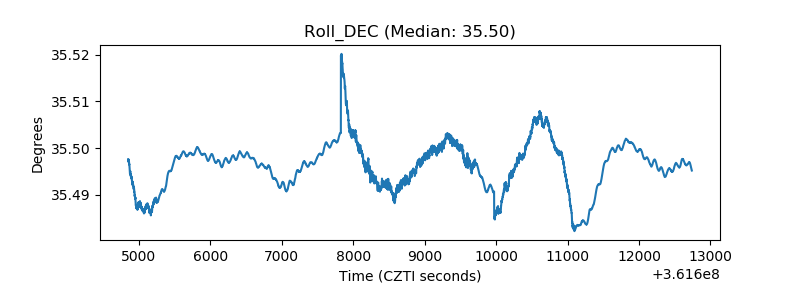 |
| _Roll_RA | 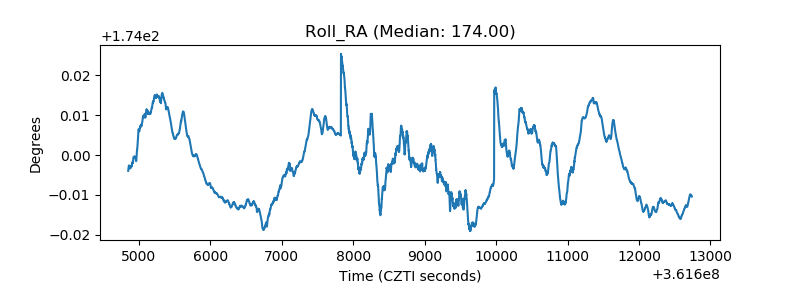 |
| Veto Counter | 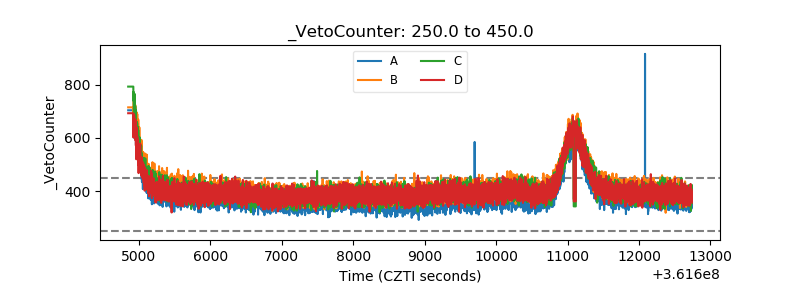 |