| Param | Original file | Final file |
|---|---|---|
| Filename | modeM0/AS1C06_007T01_9000004470_30927cztM0_level2.evt | modeM0/AS1C06_007T01_9000004470_30927cztM0_level2_quad_clean.evt |
| Size (bytes) | 1,734,491,520 | 239,561,280 |
| Size | 1.6 GB | 228.5 MB |
| Events in quadrant A | 9,614,270 | 1,565,955 |
| Events in quadrant B | 15,726,524 | 1,549,150 |
| Events in quadrant C | 10,555,345 | 1,441,897 |
| Events in quadrant D | 15,378,791 | 1,414,187 |
| Mode M0 | |||
|---|---|---|---|
| Quadrant | BADHDUFLAG | Total packets | Discarded packets |
| A | 0 | 40952 | 4 |
| B | 0 | 59875 | 4 |
| C | 0 | 42960 | 4 |
| D | 0 | 57892 | 4 |
| Mode M9 | |||
|---|---|---|---|
| Quadrant | BADHDUFLAG | Total packets | Discarded packets |
| A | 0 | 19 | 0 |
| B | 0 | 19 | 0 |
| C | 0 | 19 | 0 |
| D | 0 | 19 | 0 |
| Mode SS | |||
|---|---|---|---|
| Quadrant | BADHDUFLAG | Total packets | Discarded packets |
| A | 0 | 378 | 0 |
| B | 0 | 378 | 0 |
| C | 0 | 378 | 0 |
| D | 0 | 378 | 0 |
| Quadrant | Total seconds | Saturated seconds | Saturation percentage |
|---|---|---|---|
| A | 18627 | 461 | 2.474902% |
| B | 18627 | 682 | 3.661352% |
| C | 18626 | 1806 | 9.696124% |
| D | 18627 | 1649 | 8.852741% |
Noise dominated data is calculated using 1-second bins in cleaned event files. If a bin has >2000 counts, and if more than 50% of those come from <1% of pixels, then it is considered to be noise-dominated and hence unusable.
| Quadrant | # 1 sec bins | Bins with >0 counts | Bins with >2000 counts | High rate bins dominated by noise | Noise dominated (total time) | Noise dominated (detector-on time) | Marked lightcurve |
|---|---|---|---|---|---|---|---|
| A | 20452 | 18629 | 188 | 188 | 0.92% | 1.01% |  |
| B | 20452 | 18627 | 197 | 197 | 0.96% | 1.06% | 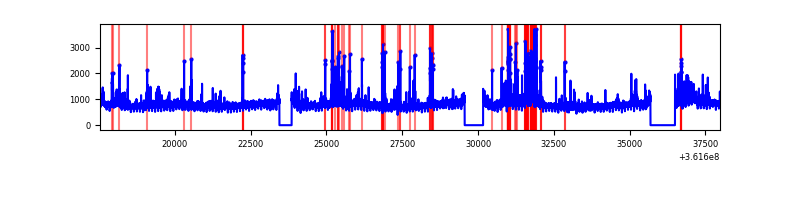 |
| C | 20451 | 18627 | 30 | 30 | 0.15% | 0.16% | 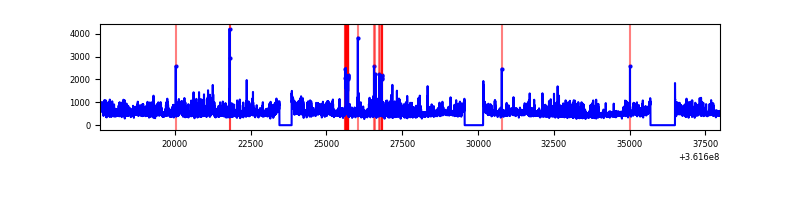 |
| D | 20452 | 18628 | 1331 | 1331 | 6.51% | 7.15% | 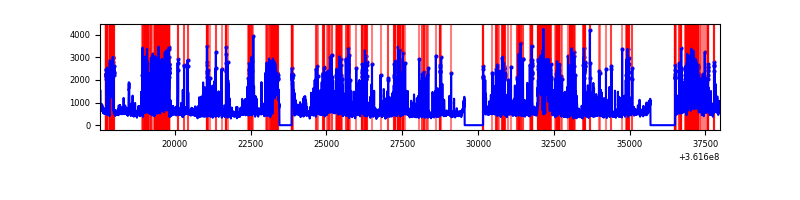 |
Top three noisy pixels from each quadrant. If the there are fewer than three noisy pixels in the level2.evt file, extra rows are filled as -1
| Pixel properties | Quadrant properties | ||||||
|---|---|---|---|---|---|---|---|
| Quadrant | DetID | PixID | Counts | Sigma | Mean | Median | Sigma |
| A | 0 | 13 | 922346 | 2029.4 | 2242 | 2193 | 453.4 |
| A | 13 | 254 | 38736 | 80.59 | 2242 | 2193 | 453.4 |
| A | 11 | 47 | 37084 | 76.95 | 2242 | 2193 | 453.4 |
| B | 6 | 159 | 5530968 | 13140.78 | 2212 | 2155 | 420.7 |
| B | 5 | 255 | 621101 | 1471.1 | 2212 | 2155 | 420.7 |
| B | 0 | 183 | 261040 | 615.31 | 2212 | 2155 | 420.7 |
| C | 14 | 238 | 786064 | 1604.19 | 2079 | 2090 | 488.7 |
| C | 3 | 233 | 746795 | 1523.84 | 2079 | 2090 | 488.7 |
| C | 14 | 254 | 651957 | 1329.78 | 2079 | 2090 | 488.7 |
| D | 12 | 233 | 1759028 | 3450.36 | 2114 | 2056 | 509.2 |
| D | 8 | 195 | 1202083 | 2356.63 | 2114 | 2056 | 509.2 |
| D | 13 | 249 | 971474 | 1903.75 | 2114 | 2056 | 509.2 |
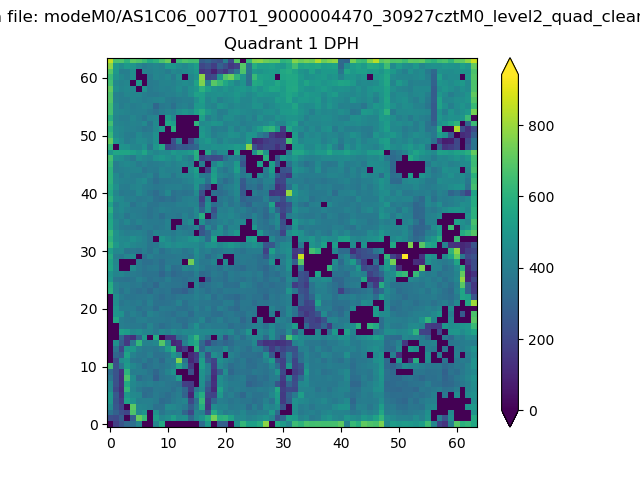
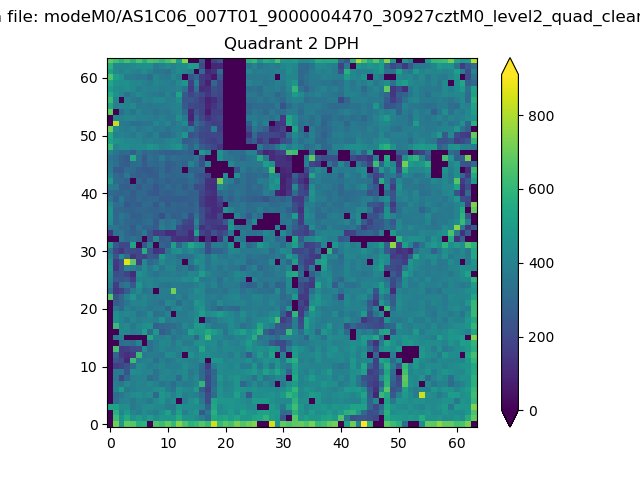
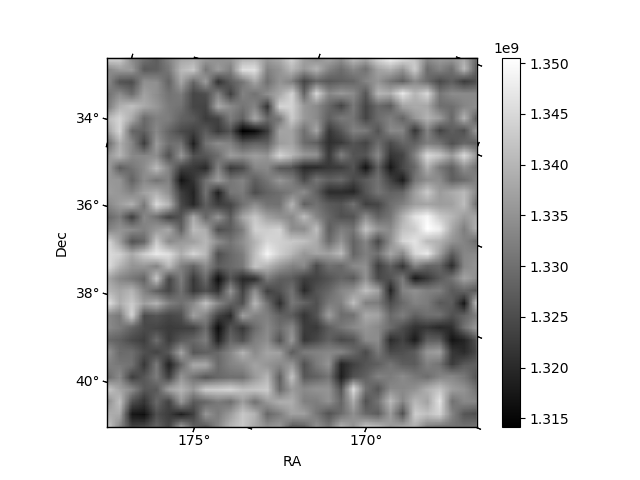
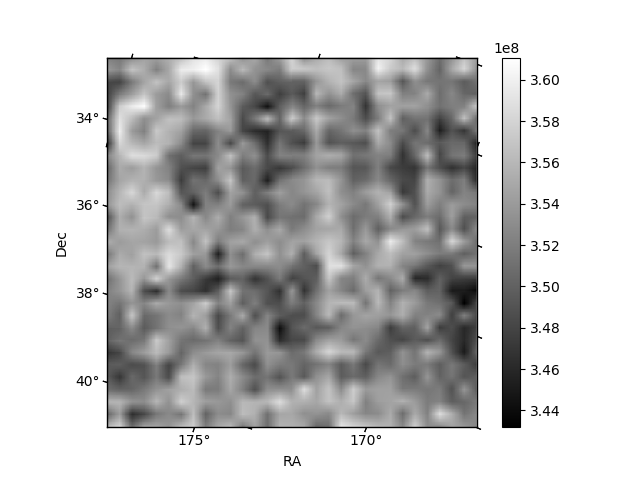
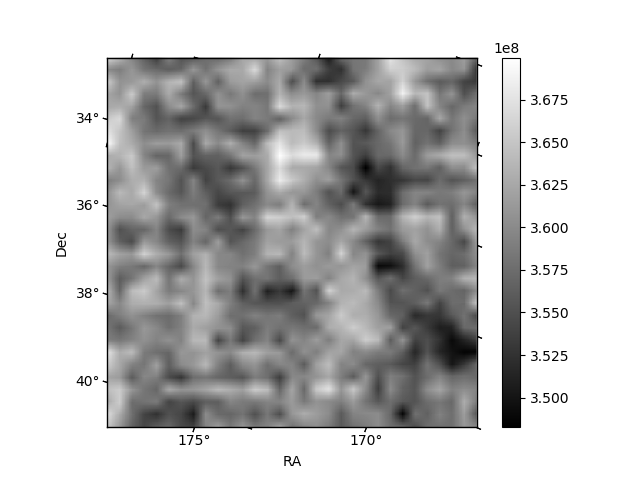
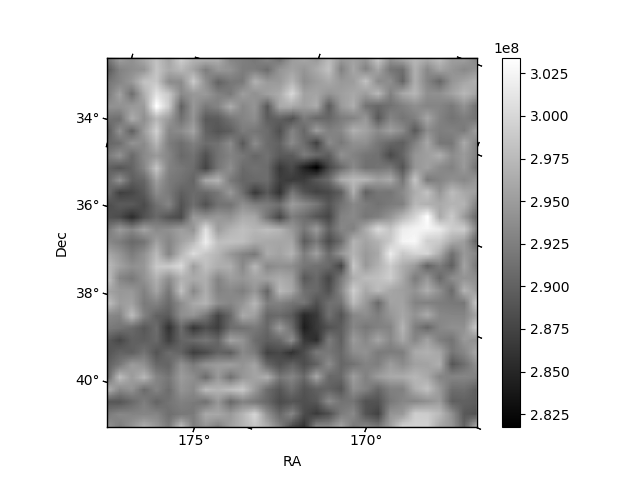
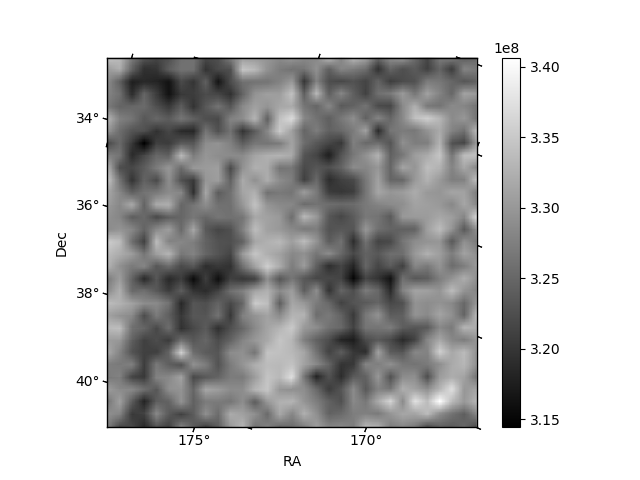
Histogram calculated using DETX and DETY for each event in the final _common_clean file
| Quadrant A | 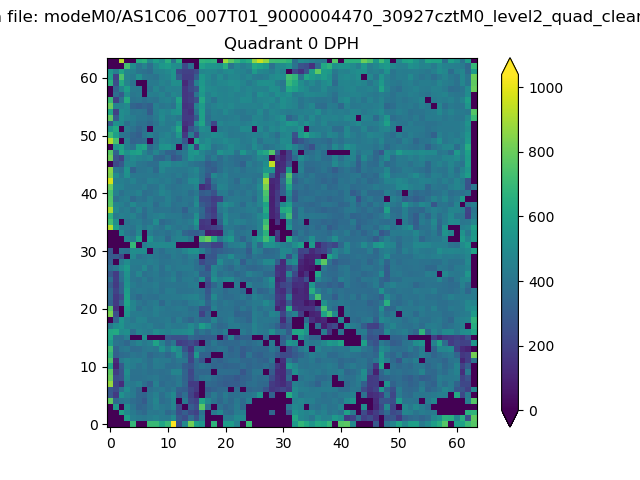 |
 |
Quadrant B |
|---|---|---|---|
| Quadrant D | 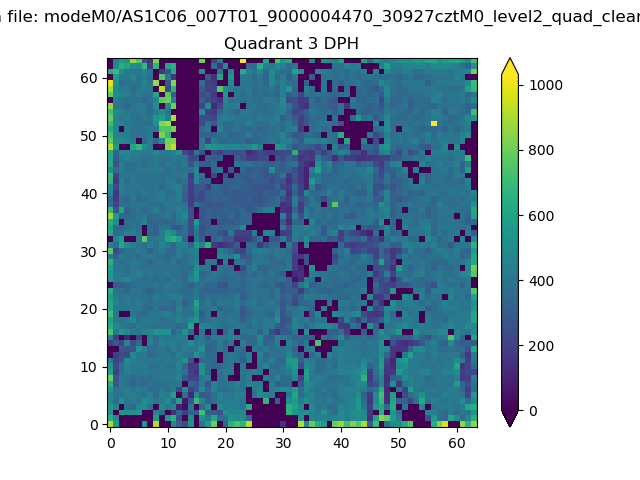 |
 |
Quadrant C |
| Plot type | Count rate plots | Images |
|---|---|---|
| Comparison with Poisson distribution Blue bars denote a histogram of data divided into 1 sec bins. Red curve is a Poisson curve with rate = median count rate of data. |
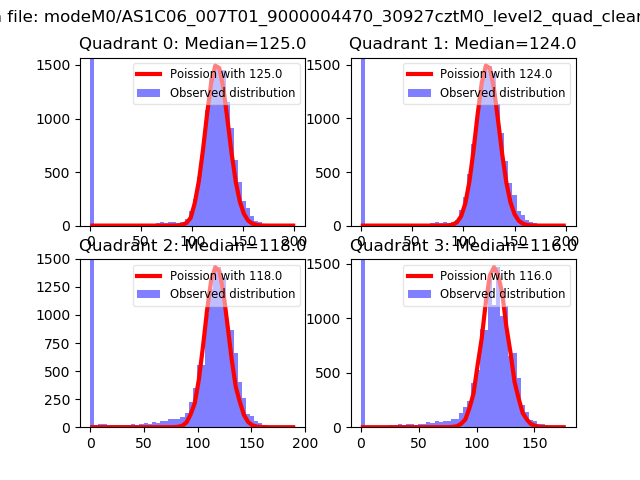 |
 |
| Quadrant-wise count rates Data is divided into 100 sec bins |
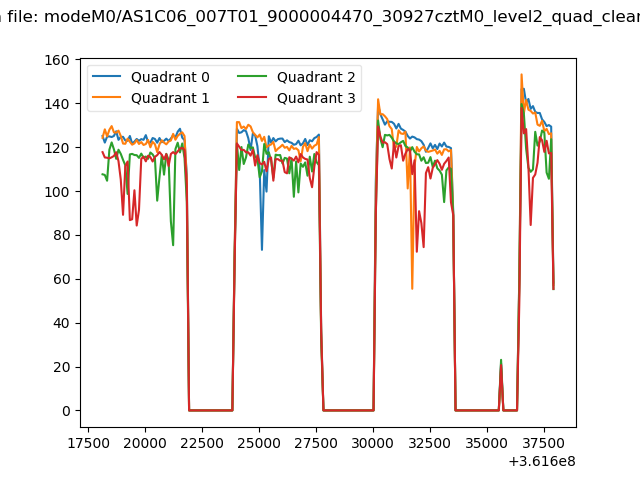 |
|
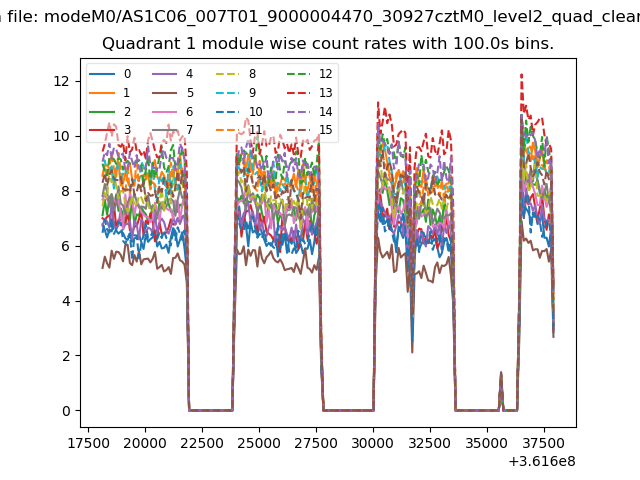
| Module-wise count rates for Quadrant A Data is divided into 100 sec bins |
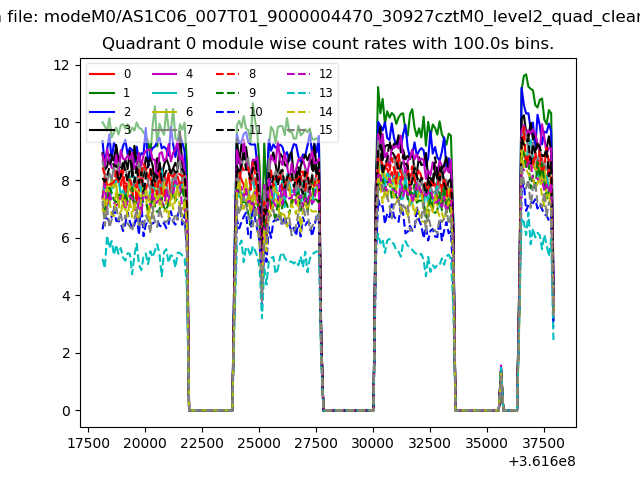 |
 |
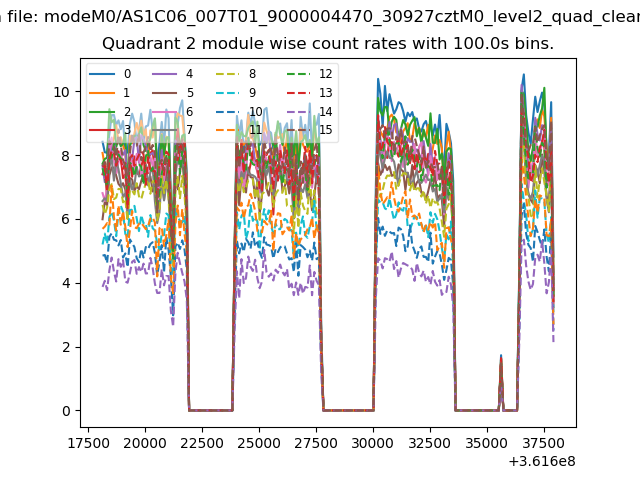
| Module-wise count rates for Quadrant B Data is divided into 100 sec bins |
 |
 |
| Module-wise count rates for Quadrant C Data is divided into 100 sec bins |
 |
 |
| Module-wise count rates for Quadrant D Data is divided into 100 sec bins |
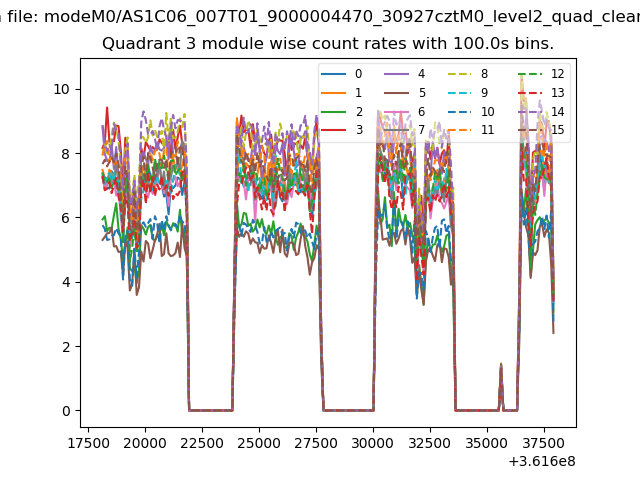 |
 |
| Parameter | Plot |
|---|---|
| CZT HV Monitor | 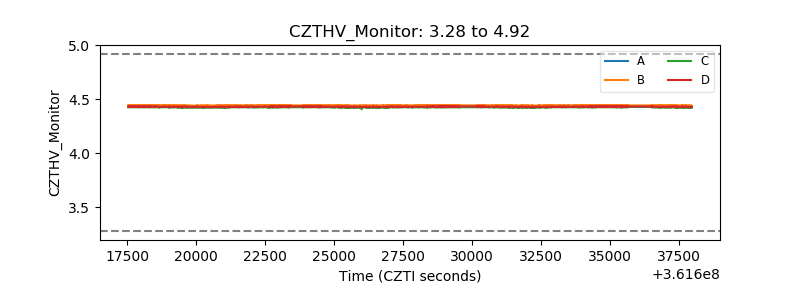 |
| D_VDD | 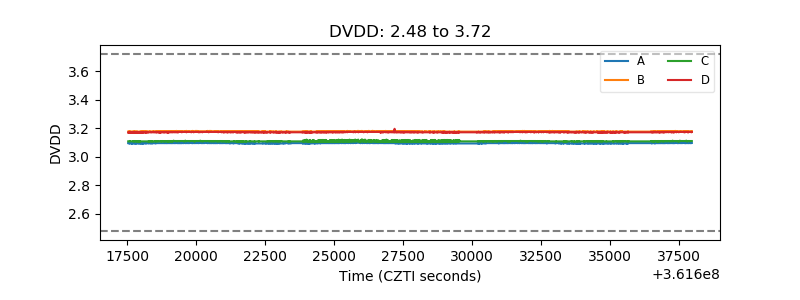 |
| Temperature 1 | 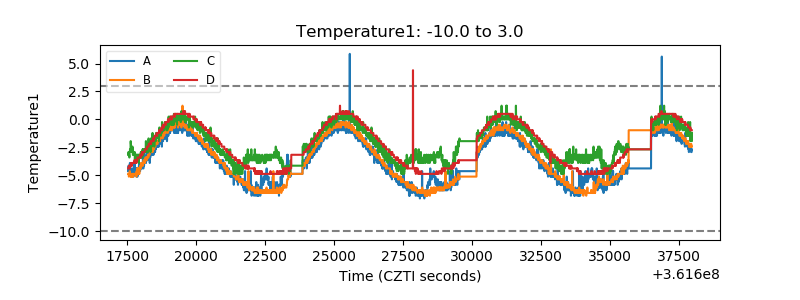 |
| Veto HV Monitor |  |
| Veto LLD | 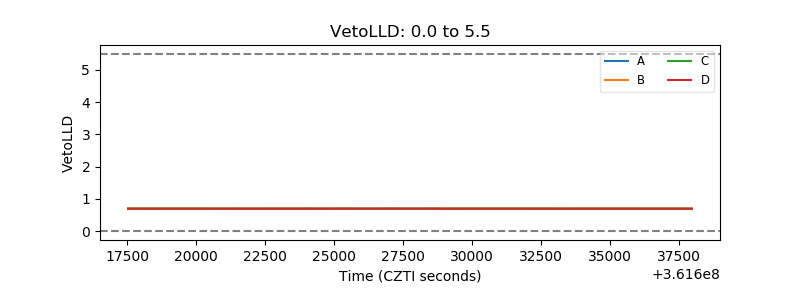 |
| Alpha Counter | 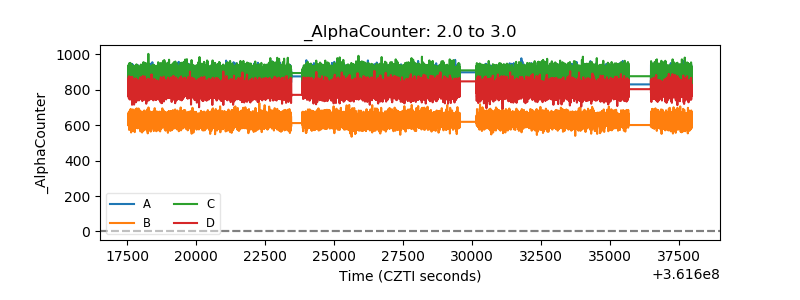 |
| _CPM_Rate | 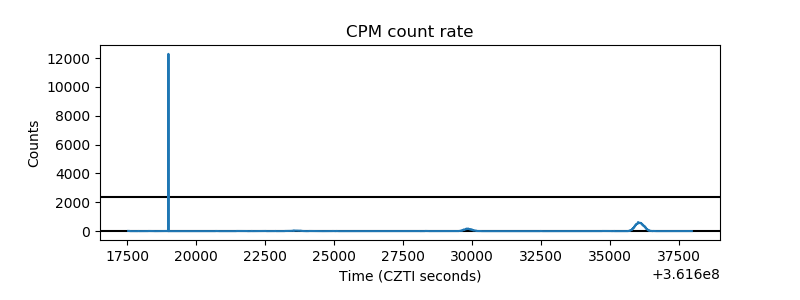 |
| CZT Counter | 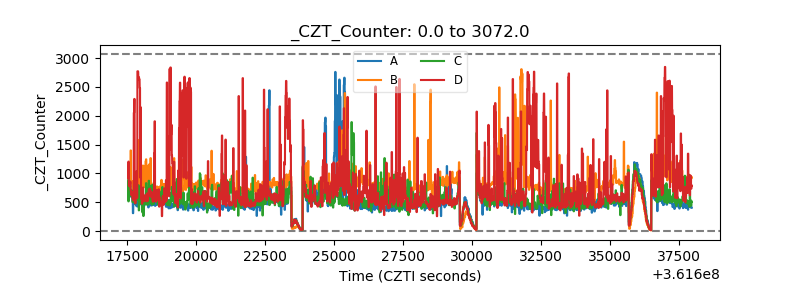 |
| +2.5 Volts monitor |  |
| +5 Volts monitor |  |
| _ROLL_ROT | 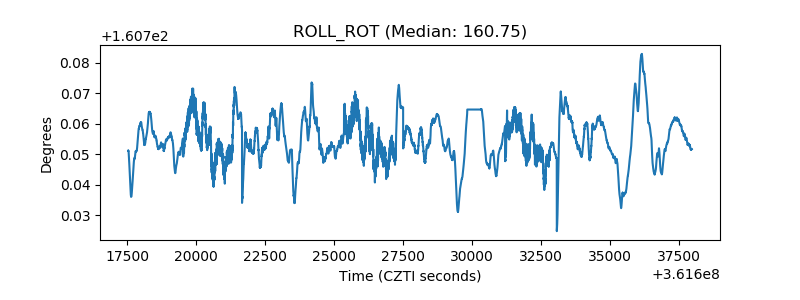 |
| _Roll_DEC | 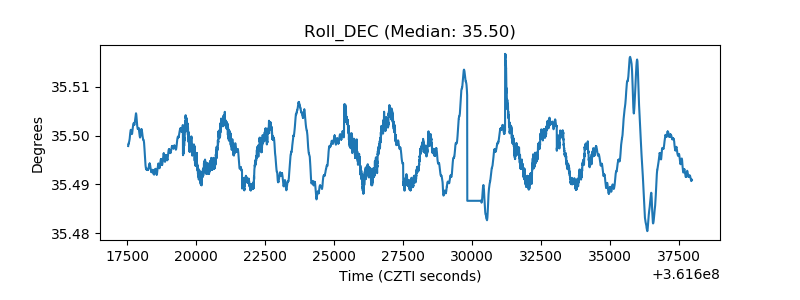 |
| _Roll_RA | 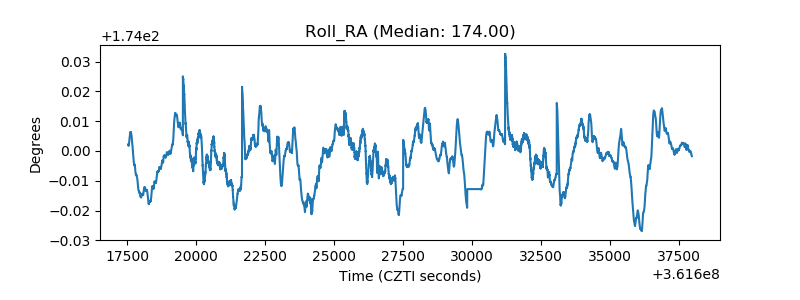 |
| Veto Counter | 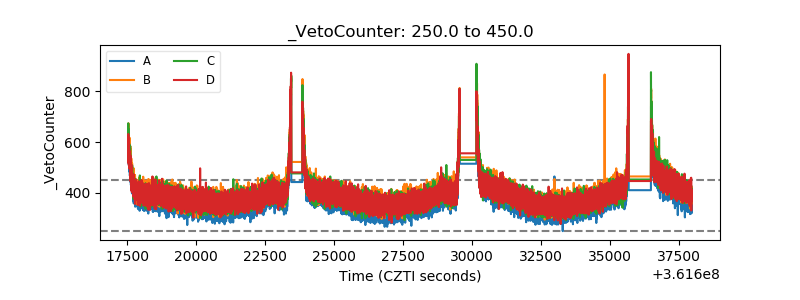 |