| Param | Original file | Final file |
|---|---|---|
| Filename | modeM0/AS1C06_007T01_9000004470_30928cztM0_level2.evt | modeM0/AS1C06_007T01_9000004470_30928cztM0_level2_quad_clean.evt |
| Size (bytes) | 573,788,160 | 84,343,680 |
| Size | 547.2 MB | 80.4 MB |
| Events in quadrant A | 2,901,659 | 559,339 |
| Events in quadrant B | 5,278,070 | 550,982 |
| Events in quadrant C | 3,459,069 | 512,712 |
| Events in quadrant D | 5,315,513 | 494,620 |
| Mode M0 | |||
|---|---|---|---|
| Quadrant | BADHDUFLAG | Total packets | Discarded packets |
| A | 0 | 12795 | 1 |
| B | 0 | 20145 | 1 |
| C | 0 | 14332 | 1 |
| D | 0 | 20108 | 1 |
| Mode M9 | |||
|---|---|---|---|
| Quadrant | BADHDUFLAG | Total packets | Discarded packets |
| A | 0 | 10 | 0 |
| B | 0 | 10 | 0 |
| C | 0 | 10 | 0 |
| D | 0 | 10 | 0 |
| Mode SS | |||
|---|---|---|---|
| Quadrant | BADHDUFLAG | Total packets | Discarded packets |
| A | 0 | 128 | 0 |
| B | 0 | 128 | 0 |
| C | 0 | 128 | 0 |
| D | 0 | 128 | 0 |
| Quadrant | Total seconds | Saturated seconds | Saturation percentage |
|---|---|---|---|
| A | 6242 | 30 | 0.480615% |
| B | 6243 | 99 | 1.585776% |
| C | 6243 | 449 | 7.192055% |
| D | 6242 | 566 | 9.067607% |
Noise dominated data is calculated using 1-second bins in cleaned event files. If a bin has >2000 counts, and if more than 50% of those come from <1% of pixels, then it is considered to be noise-dominated and hence unusable.
| Quadrant | # 1 sec bins | Bins with >0 counts | Bins with >2000 counts | High rate bins dominated by noise | Noise dominated (total time) | Noise dominated (detector-on time) | Marked lightcurve |
|---|---|---|---|---|---|---|---|
| A | 7237 | 6242 | 0 | 0 | 0.00% | 0.00% | 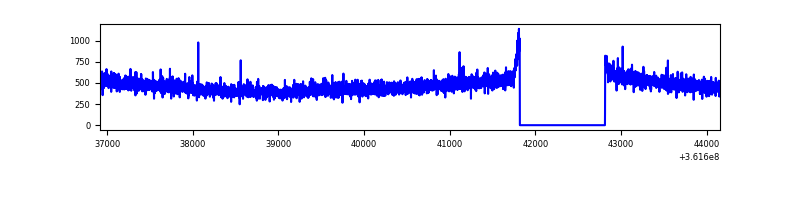 |
| B | 7238 | 6243 | 6 | 6 | 0.08% | 0.10% | 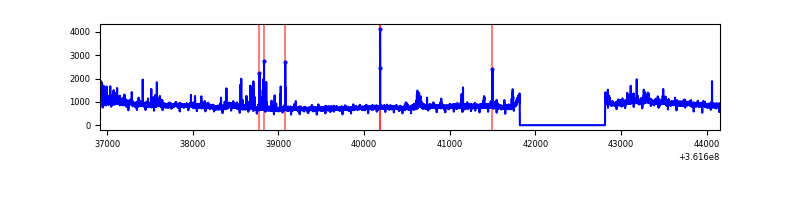 |
| C | 7238 | 6243 | 2 | 2 | 0.03% | 0.03% | 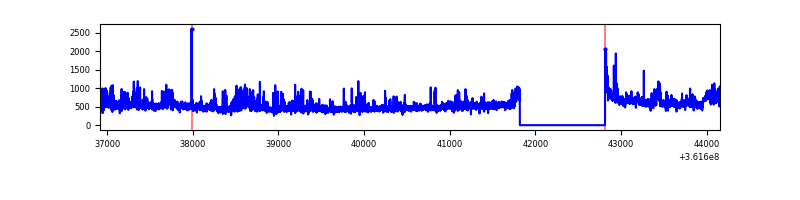 |
| D | 7237 | 6242 | 458 | 458 | 6.33% | 7.34% | 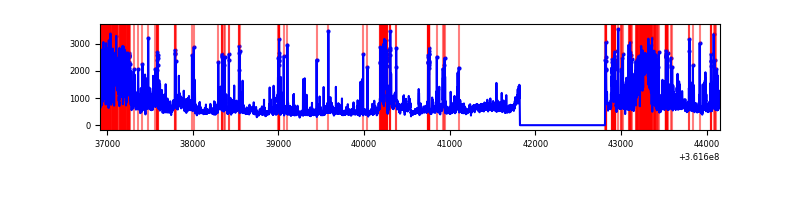 |
Top three noisy pixels from each quadrant. If the there are fewer than three noisy pixels in the level2.evt file, extra rows are filled as -1
| Pixel properties | Quadrant properties | ||||||
|---|---|---|---|---|---|---|---|
| Quadrant | DetID | PixID | Counts | Sigma | Mean | Median | Sigma |
| A | 13 | 254 | 12823 | 79.95 | 750 | 734 | 151.2 |
| A | 3 | 137 | 7164 | 42.52 | 750 | 734 | 151.2 |
| A | 0 | 226 | 6377 | 37.32 | 750 | 734 | 151.2 |
| B | 6 | 159 | 2008909 | 14185.44 | 744 | 727 | 141.6 |
| B | 0 | 183 | 89732 | 628.72 | 744 | 727 | 141.6 |
| B | 5 | 255 | 55668 | 388.09 | 744 | 727 | 141.6 |
| C | 3 | 233 | 262764 | 1588.47 | 701 | 706 | 165.0 |
| C | 14 | 238 | 224601 | 1357.15 | 701 | 706 | 165.0 |
| C | 14 | 254 | 165650 | 999.81 | 701 | 706 | 165.0 |
| D | 12 | 233 | 810741 | 4729.1 | 708 | 687 | 171.3 |
| D | 8 | 195 | 370024 | 2156.19 | 708 | 687 | 171.3 |
| D | 13 | 174 | 339897 | 1980.31 | 708 | 687 | 171.3 |
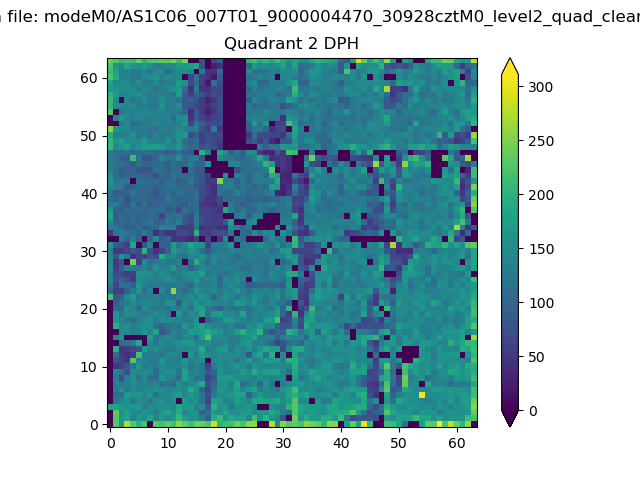
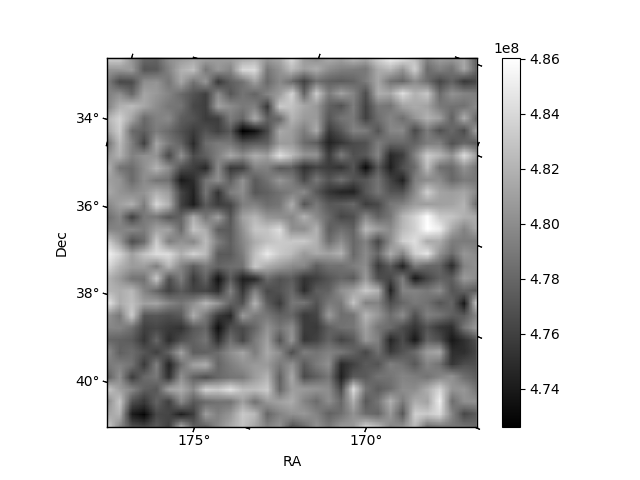
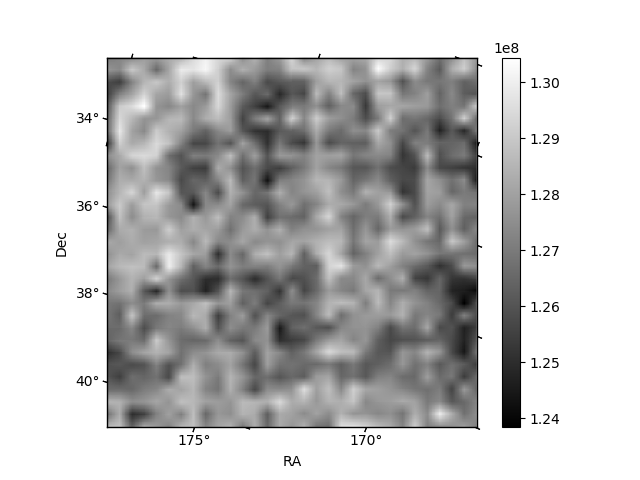
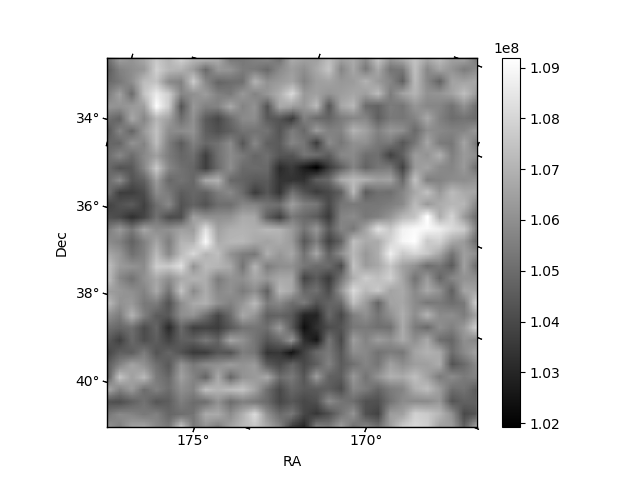
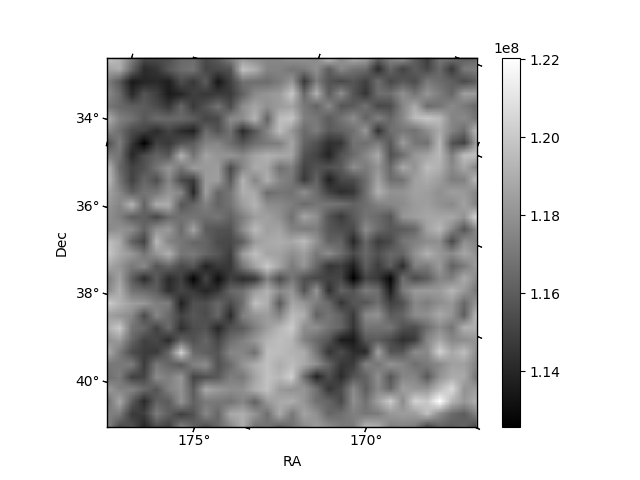
Histogram calculated using DETX and DETY for each event in the final _common_clean file
| Quadrant A | 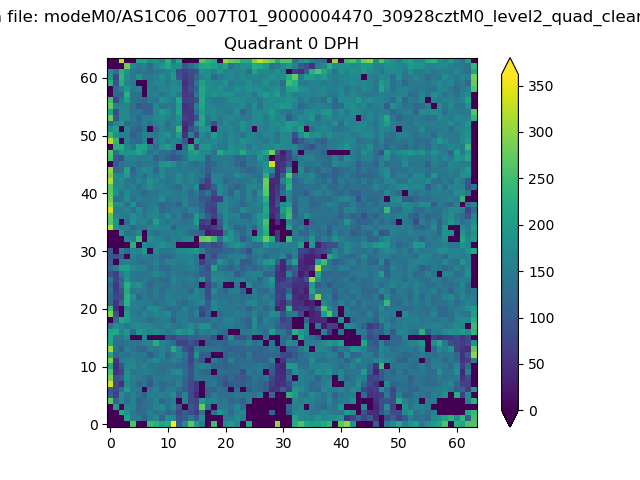 |
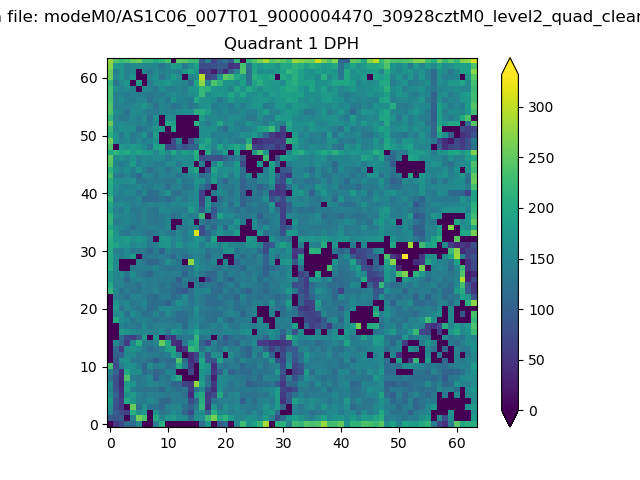 |
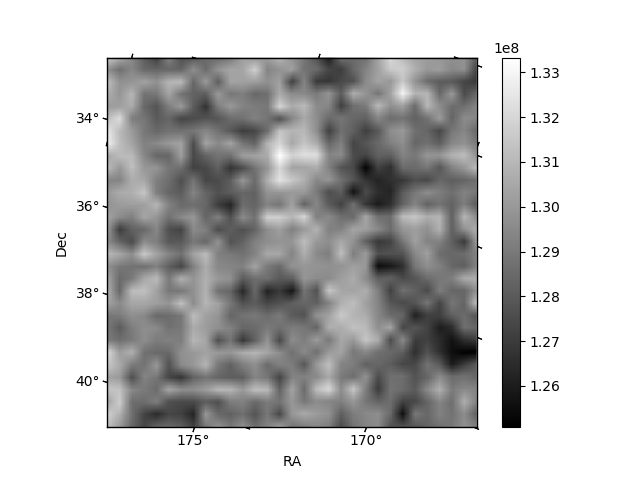
Quadrant B |
|---|---|---|---|
| Quadrant D | 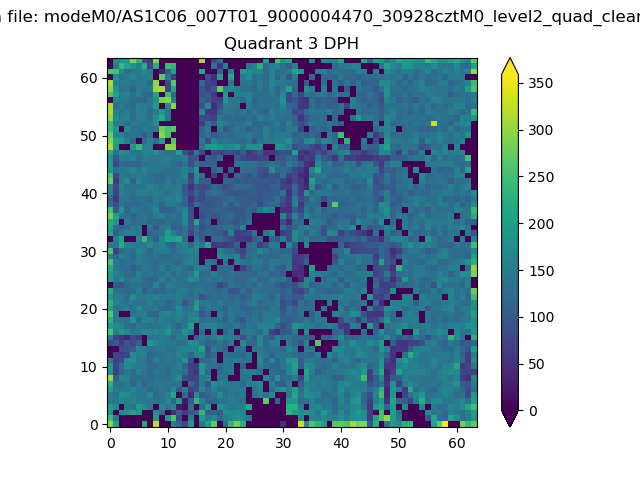 |
 |
Quadrant C |
| Plot type | Count rate plots | Images |
|---|---|---|
| Comparison with Poisson distribution Blue bars denote a histogram of data divided into 1 sec bins. Red curve is a Poisson curve with rate = median count rate of data. |
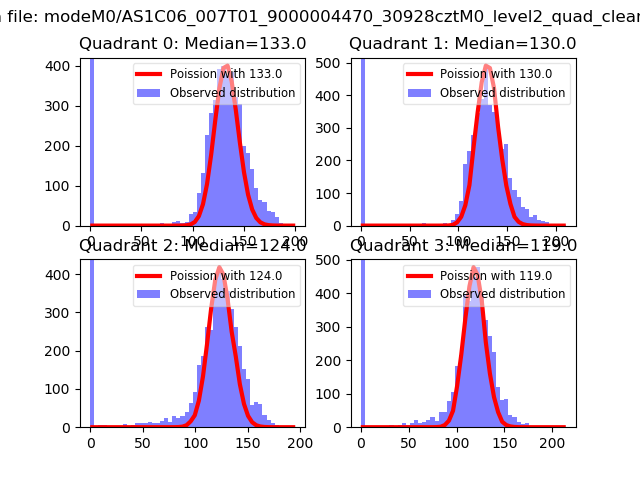 |
 |
| Quadrant-wise count rates Data is divided into 100 sec bins |
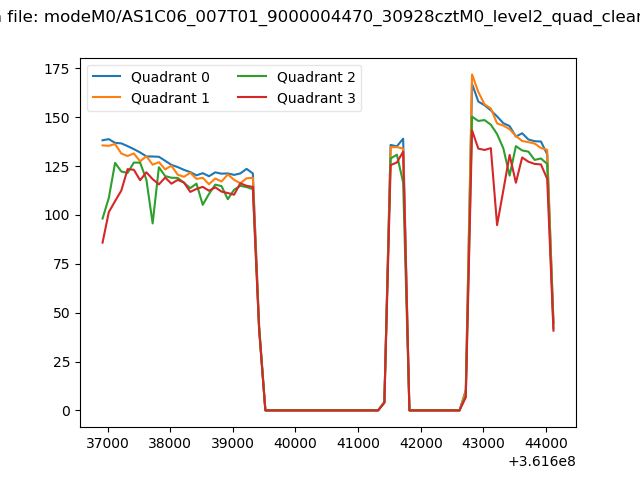 |
|
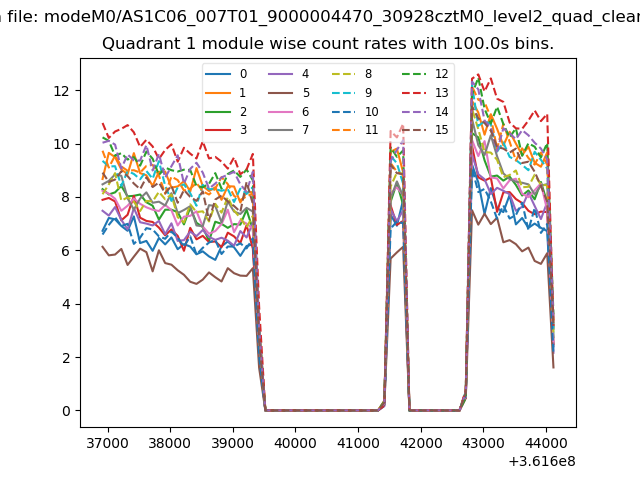
| Module-wise count rates for Quadrant A Data is divided into 100 sec bins |
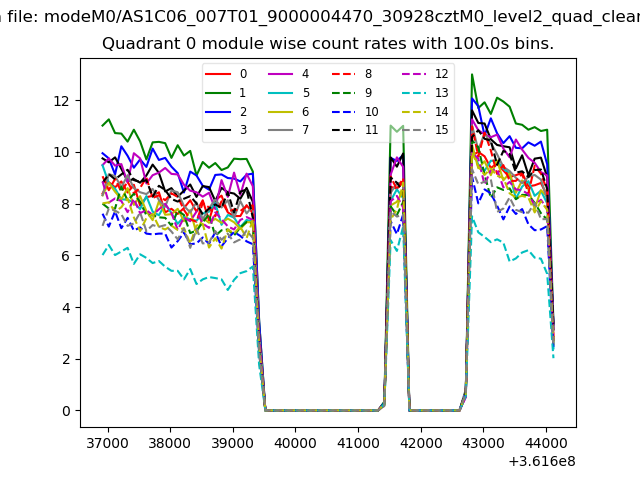 |
 |
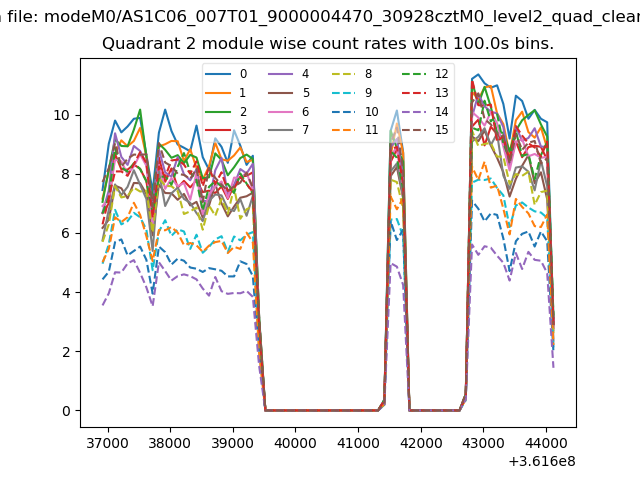
| Module-wise count rates for Quadrant B Data is divided into 100 sec bins |
 |
 |
| Module-wise count rates for Quadrant C Data is divided into 100 sec bins |
 |
 |
| Module-wise count rates for Quadrant D Data is divided into 100 sec bins |
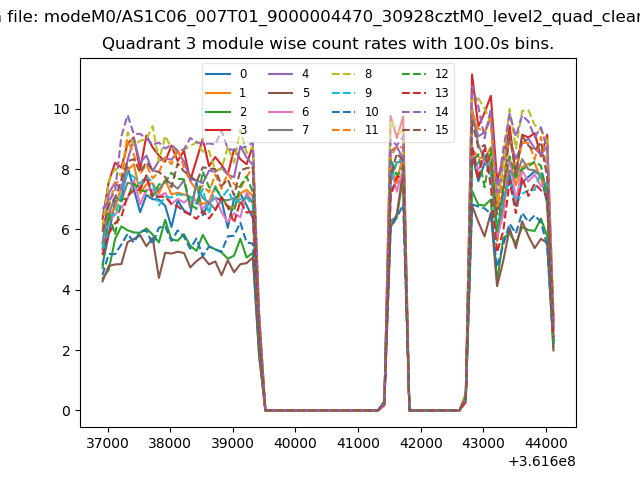 |
 |
| Parameter | Plot |
|---|---|
| CZT HV Monitor | 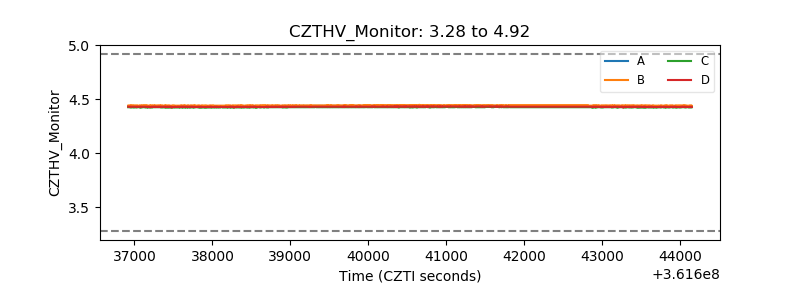 |
| D_VDD | 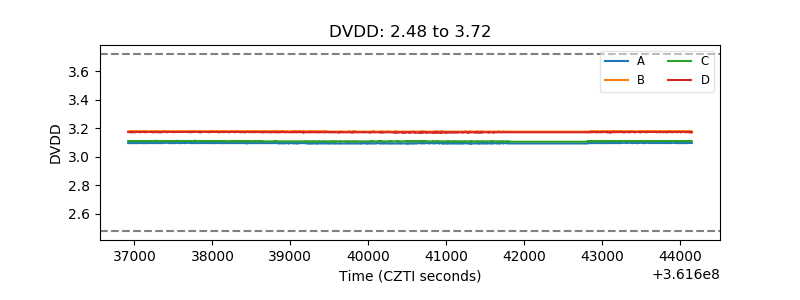 |
| Temperature 1 | 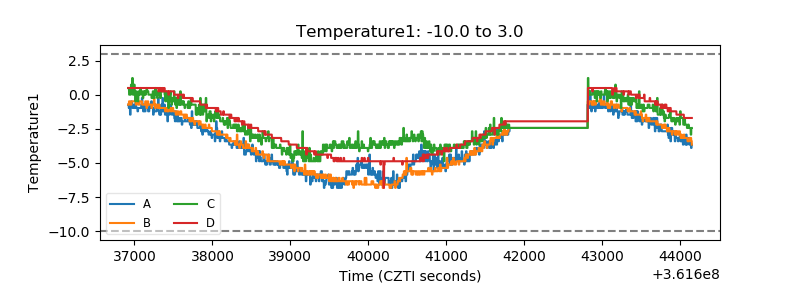 |
| Veto HV Monitor | 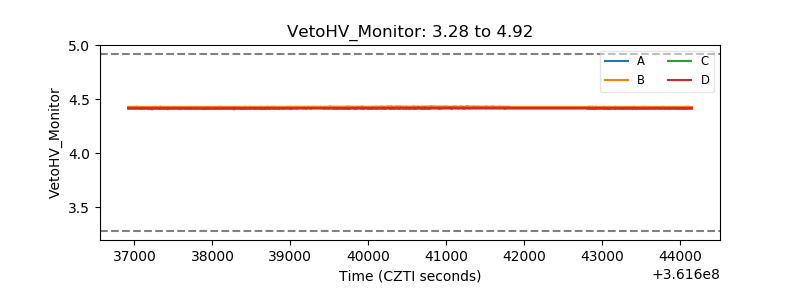 |
| Veto LLD | 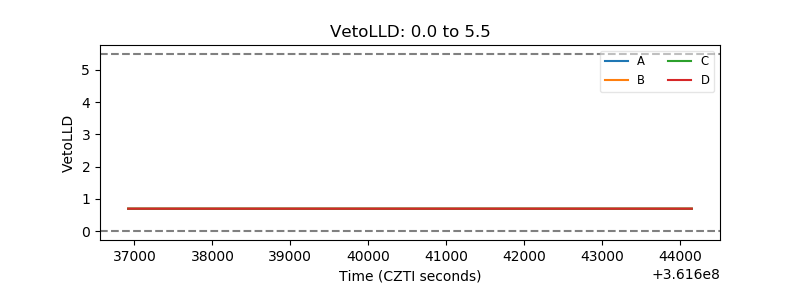 |
| Alpha Counter | 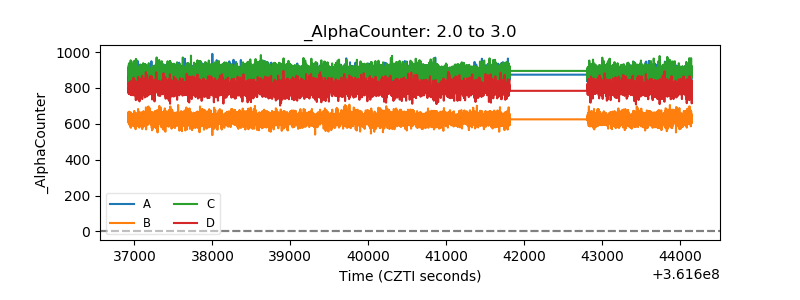 |
| _CPM_Rate | 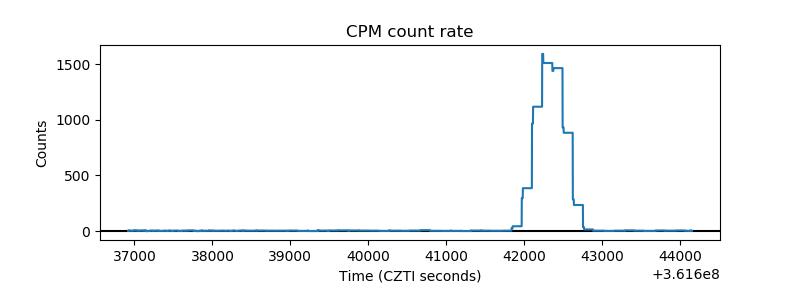 |
| CZT Counter | 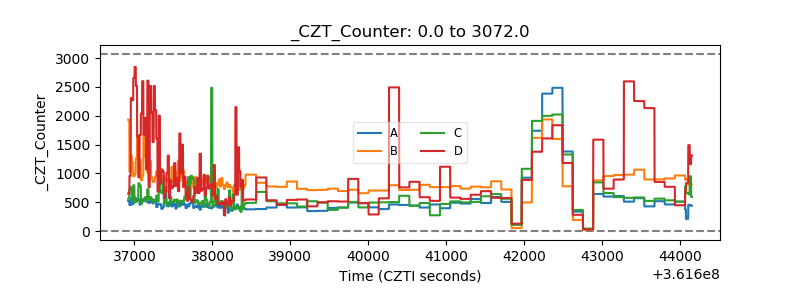 |
| +2.5 Volts monitor |  |
| +5 Volts monitor |  |
| _ROLL_ROT | 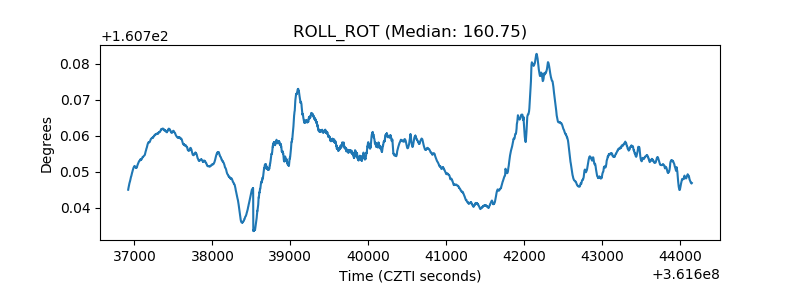 |
| _Roll_DEC | 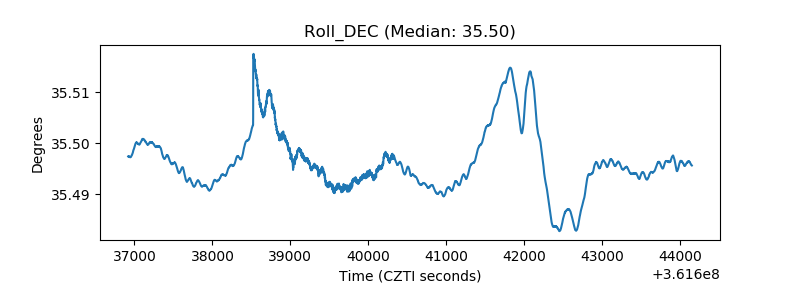 |
| _Roll_RA | 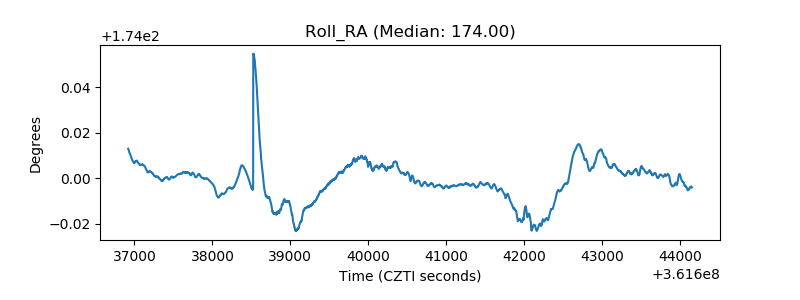 |
| Veto Counter | 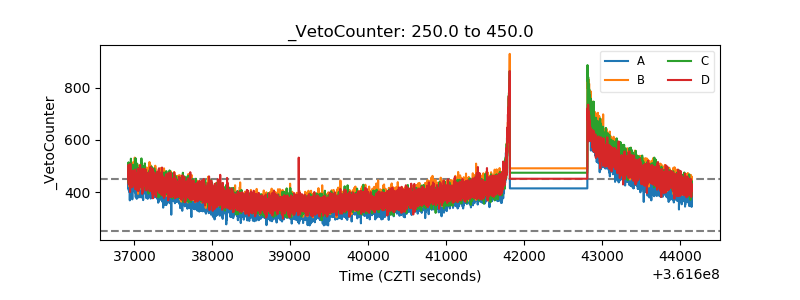 |