| Param | Original file | Final file |
|---|---|---|
| Filename | modeM0/AS1C06_007T01_9000004470_30931cztM0_level2.evt | modeM0/AS1C06_007T01_9000004470_30931cztM0_level2_quad_clean.evt |
| Size (bytes) | 563,313,600 | 90,987,840 |
| Size | 537.2 MB | 86.8 MB |
| Events in quadrant A | 2,968,519 | 609,426 |
| Events in quadrant B | 5,445,954 | 610,016 |
| Events in quadrant C | 3,787,765 | 566,703 |
| Events in quadrant D | 4,446,521 | 544,819 |
| Mode M0 | |||
|---|---|---|---|
| Quadrant | BADHDUFLAG | Total packets | Discarded packets |
| A | 0 | 12613 | 1 |
| B | 0 | 20524 | 1 |
| C | 0 | 15267 | 1 |
| D | 0 | 17376 | 1 |
| Mode M9 | |||
|---|---|---|---|
| Quadrant | BADHDUFLAG | Total packets | Discarded packets |
| A | 0 | 12 | 0 |
| B | 0 | 12 | 0 |
| C | 0 | 12 | 0 |
| D | 0 | 12 | 0 |
| Mode SS | |||
|---|---|---|---|
| Quadrant | BADHDUFLAG | Total packets | Discarded packets |
| A | 0 | 124 | 0 |
| B | 0 | 124 | 0 |
| C | 0 | 124 | 0 |
| D | 0 | 124 | 0 |
| Quadrant | Total seconds | Saturated seconds | Saturation percentage |
|---|---|---|---|
| A | 6073 | 27 | 0.444591% |
| B | 6073 | 166 | 2.733410% |
| C | 6073 | 504 | 8.299028% |
| D | 6073 | 293 | 4.824634% |
Noise dominated data is calculated using 1-second bins in cleaned event files. If a bin has >2000 counts, and if more than 50% of those come from <1% of pixels, then it is considered to be noise-dominated and hence unusable.
| Quadrant | # 1 sec bins | Bins with >0 counts | Bins with >2000 counts | High rate bins dominated by noise | Noise dominated (total time) | Noise dominated (detector-on time) | Marked lightcurve |
|---|---|---|---|---|---|---|---|
| A | 7303 | 6074 | 0 | 0 | 0.00% | 0.00% |  |
| B | 7303 | 6073 | 31 | 31 | 0.42% | 0.51% |  |
| C | 7303 | 6073 | 9 | 9 | 0.12% | 0.15% |  |
| D | 7303 | 6074 | 247 | 247 | 3.38% | 4.07% |  |
Top three noisy pixels from each quadrant. If the there are fewer than three noisy pixels in the level2.evt file, extra rows are filled as -1
| Pixel properties | Quadrant properties | ||||||
|---|---|---|---|---|---|---|---|
| Quadrant | DetID | PixID | Counts | Sigma | Mean | Median | Sigma |
| A | 13 | 254 | 12382 | 75.41 | 769 | 753 | 154.2 |
| A | 3 | 137 | 6887 | 39.78 | 769 | 753 | 154.2 |
| A | 0 | 226 | 6556 | 37.63 | 769 | 753 | 154.2 |
| B | 6 | 159 | 1919177 | 13452.93 | 767 | 747 | 142.6 |
| B | 0 | 190 | 247124 | 1727.71 | 767 | 747 | 142.6 |
| B | 5 | 255 | 86755 | 603.13 | 767 | 747 | 142.6 |
| C | 3 | 233 | 466125 | 2769.9 | 720 | 727 | 168.0 |
| C | 14 | 238 | 240954 | 1429.76 | 720 | 727 | 168.0 |
| C | 14 | 254 | 181716 | 1077.19 | 720 | 727 | 168.0 |
| D | 8 | 195 | 420261 | 2407.1 | 729 | 710 | 174.3 |
| D | 13 | 249 | 380920 | 2181.39 | 729 | 710 | 174.3 |
| D | 13 | 174 | 314268 | 1798.98 | 729 | 710 | 174.3 |
Histogram calculated using DETX and DETY for each event in the final _common_clean file
| Quadrant A |  |
 |
Quadrant B |
|---|---|---|---|
| Quadrant D |  |
 |
Quadrant C |
| Plot type | Count rate plots | Images |
|---|---|---|
| Comparison with Poisson distribution Blue bars denote a histogram of data divided into 1 sec bins. Red curve is a Poisson curve with rate = median count rate of data. |
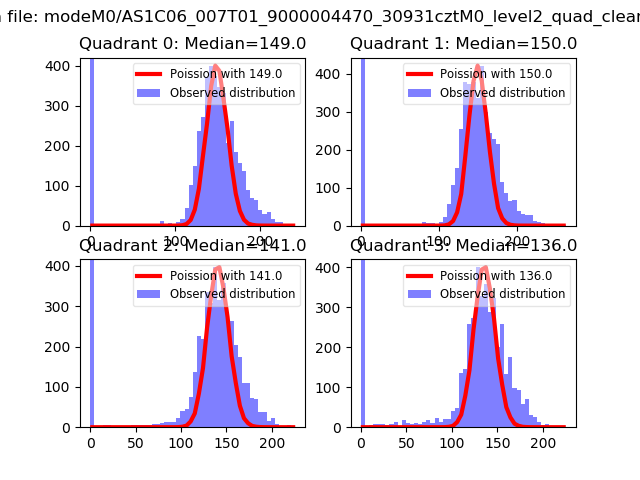 |
 |
| Quadrant-wise count rates Data is divided into 100 sec bins |
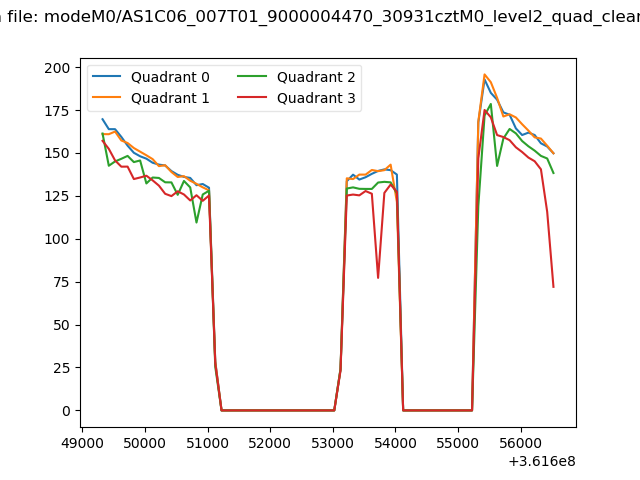 |
|
| Module-wise count rates for Quadrant A Data is divided into 100 sec bins |
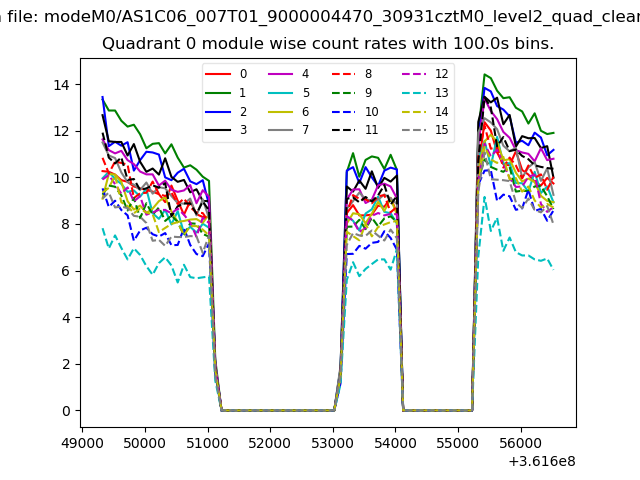 |
 |
| Module-wise count rates for Quadrant B Data is divided into 100 sec bins |
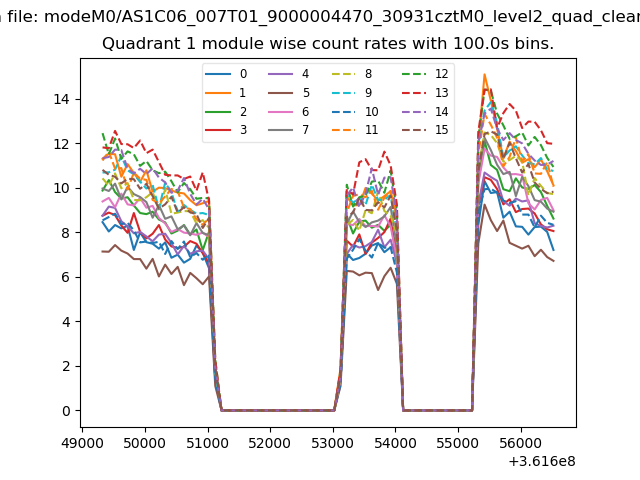 |
 |
| Module-wise count rates for Quadrant C Data is divided into 100 sec bins |
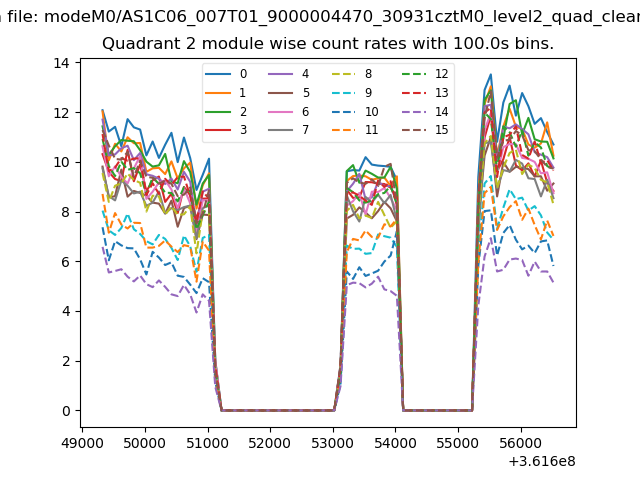 |
 |
| Module-wise count rates for Quadrant D Data is divided into 100 sec bins |
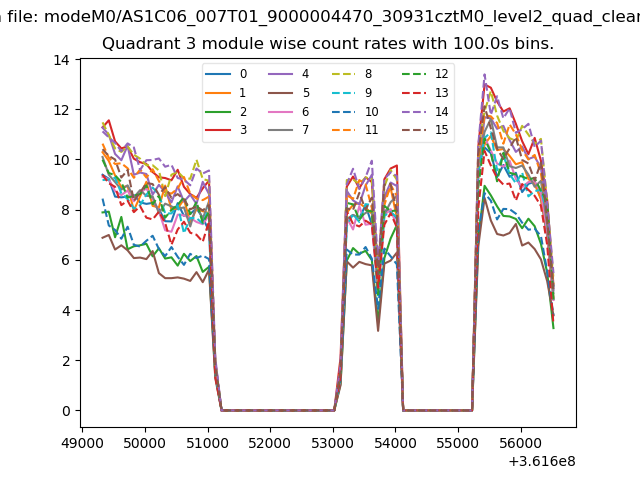 |
 |
| Parameter | Plot |
|---|---|
| CZT HV Monitor | 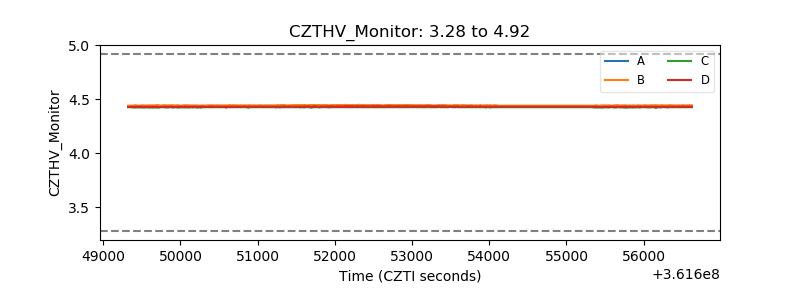 |
| D_VDD |  |
| Temperature 1 |  |
| Veto HV Monitor |  |
| Veto LLD |  |
| Alpha Counter | 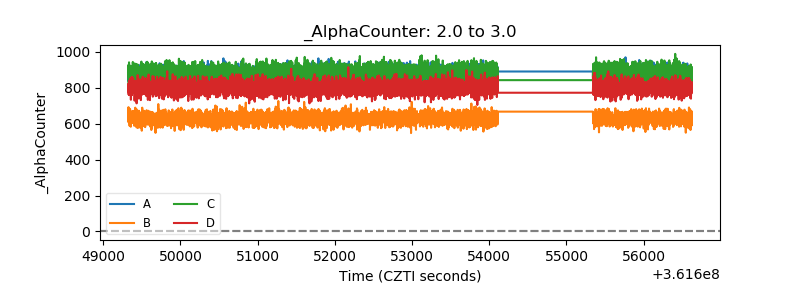 |
| _CPM_Rate | 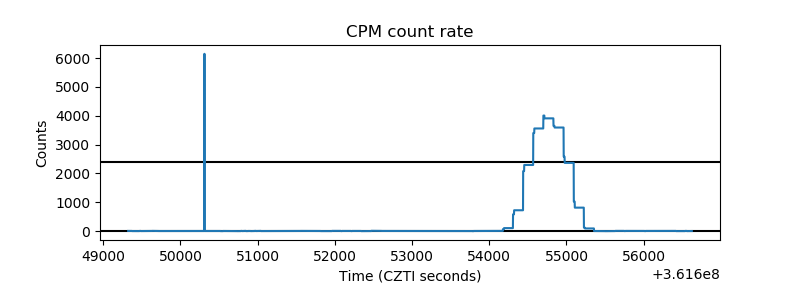 |
| CZT Counter |  |
| +2.5 Volts monitor |  |
| +5 Volts monitor |  |
| _ROLL_ROT | 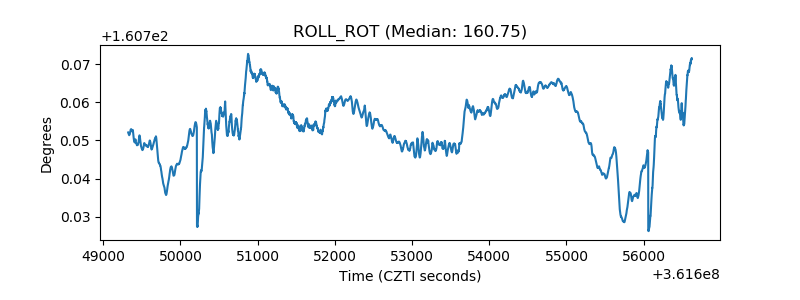 |
| _Roll_DEC |  |
| _Roll_RA |  |
| Veto Counter | 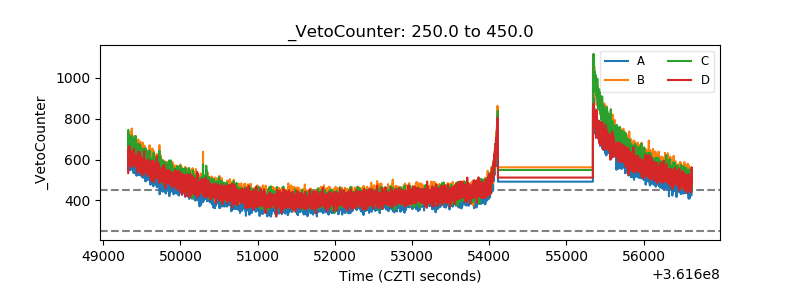 |