| Param | Original file | Final file |
|---|---|---|
| Filename | modeM0/AS1A10_058T10_9000004472cztM0_level2.fits | modeM0/AS1A10_058T10_9000004472cztM0_level2_quad_clean.evt |
| Size (bytes) | 914,034,240 | 690,042,240 |
| Size | 871.7 MB | 658.1 MB |
| Events in quadrant A | 5,716,764 | 3,902,100 |
| Events in quadrant B | 5,362,602 | 3,815,431 |
| Events in quadrant C | 5,549,544 | 3,635,281 |
| Events in quadrant D | 4,887,654 | 3,378,862 |
| Mode M0 | |||
|---|---|---|---|
| Quadrant | BADHDUFLAG | Total packets | Discarded packets |
| A | 0 | 188668 | 0 |
| B | 0 | 277706 | 0 |
| C | 0 | 201040 | 0 |
| D | 0 | 225826 | 0 |
| Mode M9 | |||
|---|---|---|---|
| Quadrant | BADHDUFLAG | Total packets | Discarded packets |
| A | 0 | 152 | 0 |
| B | 0 | 153 | 0 |
| C | 0 | 153 | 0 |
| D | 0 | 152 | 0 |
| Mode SS | |||
|---|---|---|---|
| Quadrant | BADHDUFLAG | Total packets | Discarded packets |
| A | 0 | 1824 | 0 |
| B | 0 | 1824 | 0 |
| C | 0 | 1830 | 0 |
| D | 0 | 1826 | 0 |
| Quadrant | Total seconds | Saturated seconds | Saturation percentage |
|---|---|---|---|
| A | 89927 | 952 | 1.058636% |
| B | 89857 | 2182 | 2.428303% |
| C | 89919 | 3169 | 3.524283% |
| D | 89938 | 3312 | 3.682537% |
Noise dominated data is calculated using 1-second bins in cleaned event files. If a bin has >2000 counts, and if more than 50% of those come from <1% of pixels, then it is considered to be noise-dominated and hence unusable.
| Quadrant | # 1 sec bins | Bins with >0 counts | Bins with >2000 counts | High rate bins dominated by noise | Noise dominated (total time) | Noise dominated (detector-on time) | Marked lightcurve |
|---|---|---|---|---|---|---|---|
| A | 124254 | 90088 | 0 | 0 | 0.00% | 0.00% |  |
| B | 124254 | 90054 | 0 | 0 | 0.00% | 0.00% |  |
| C | 124254 | 90059 | 0 | 0 | 0.00% | 0.00% |  |
| D | 124254 | 90086 | 0 | 0 | 0.00% | 0.00% |  |
Top three noisy pixels from each quadrant. If the there are fewer than three noisy pixels in the level2.evt file, extra rows are filled as -1
| Pixel properties | Quadrant properties | ||||||
|---|---|---|---|---|---|---|---|
| Quadrant | DetID | PixID | Counts | Sigma | Mean | Median | Sigma |
| A | 0 | 29 | 5562 | 11.53 | 1491 | 1401 | 360.9 |
| A | 7 | 110 | 4448 | 8.44 | 1491 | 1401 | 360.9 |
| A | 9 | 19 | 4297 | 8.02 | 1491 | 1401 | 360.9 |
| B | 2 | 9 | 4350 | 10.8 | 1419 | 1358 | 277.1 |
| B | 2 | 8 | 3598 | 8.08 | 1419 | 1358 | 277.1 |
| B | 3 | 17 | 3595 | 8.07 | 1419 | 1358 | 277.1 |
| C | 1 | 80 | 4253 | 7.75 | 1468 | 1382 | 370.5 |
| C | 1 | 81 | 4190 | 7.58 | 1468 | 1382 | 370.5 |
| C | 3 | 126 | 3900 | 6.8 | 1468 | 1382 | 370.5 |
| D | 10 | 189 | 3466 | 6.01 | 1397 | 1281 | 363.7 |
| D | 7 | 3 | 3453 | 5.97 | 1397 | 1281 | 363.7 |
| D | 3 | 14 | 3427 | 5.9 | 1397 | 1281 | 363.7 |
Histogram calculated using DETX and DETY for each event in the final _common_clean file
| Quadrant A | 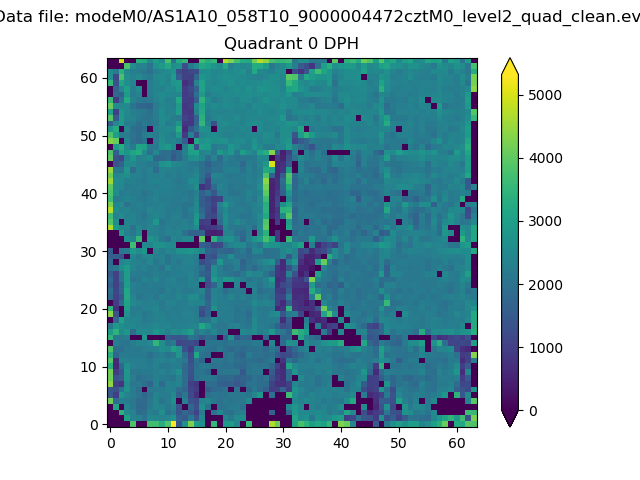 |
 |
Quadrant B |
|---|---|---|---|
| Quadrant D |  |
 |
Quadrant C |
| Plot type | Count rate plots | Images |
|---|---|---|
| Comparison with Poisson distribution Blue bars denote a histogram of data divided into 1 sec bins. Red curve is a Poisson curve with rate = median count rate of data. |
 |
 |
| Quadrant-wise count rates Data is divided into 100 sec bins |
 |
|
| Module-wise count rates for Quadrant A Data is divided into 100 sec bins |
 |
 |
| Module-wise count rates for Quadrant B Data is divided into 100 sec bins |
 |
 |
| Module-wise count rates for Quadrant C Data is divided into 100 sec bins |
 |
 |
| Module-wise count rates for Quadrant D Data is divided into 100 sec bins |
 |
 |
| Parameter | Plot |
|---|---|
| CZT HV Monitor |  |
| D_VDD |  |
| Temperature 1 |  |
| Veto HV Monitor |  |
| Veto LLD |  |
| Alpha Counter |  |
| _CPM_Rate |  |
| CZT Counter |  |
| +2.5 Volts monitor |  |
| +5 Volts monitor |  |
| _ROLL_ROT |  |
| _Roll_DEC | 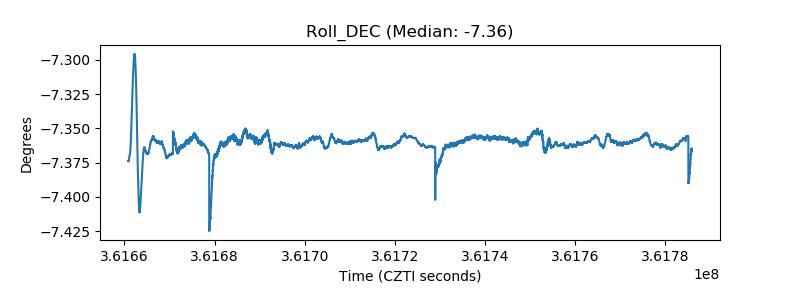 |
| _Roll_RA |  |
| Veto Counter |  |