| Param | Original file | Final file |
|---|---|---|
| Filename | modeM0/AS1A10_058T10_9000004472_30932cztM0_level2.evt | modeM0/AS1A10_058T10_9000004472_30932cztM0_level2_quad_clean.evt |
| Size (bytes) | 136,460,160 | 33,030,720 |
| Size | 130.1 MB | 31.5 MB |
| Events in quadrant A | 796,755 | 228,151 |
| Events in quadrant B | 1,315,818 | 231,482 |
| Events in quadrant C | 919,893 | 224,370 |
| Events in quadrant D | 1,006,561 | 215,400 |
| Mode M0 | |||
|---|---|---|---|
| Quadrant | BADHDUFLAG | Total packets | Discarded packets |
| A | 0 | 3248 | 1 |
| B | 0 | 4801 | 1 |
| C | 0 | 3763 | 1 |
| D | 0 | 3981 | 1 |
| Mode M9 | |||
|---|---|---|---|
| Quadrant | BADHDUFLAG | Total packets | Discarded packets |
| A | 0 | 8 | 0 |
| B | 0 | 8 | 0 |
| C | 0 | 8 | 0 |
| D | 0 | 8 | 0 |
| Mode SS | |||
|---|---|---|---|
| Quadrant | BADHDUFLAG | Total packets | Discarded packets |
| A | 0 | 26 | 0 |
| B | 0 | 26 | 0 |
| C | 0 | 26 | 0 |
| D | 0 | 26 | 0 |
| Quadrant | Total seconds | Saturated seconds | Saturation percentage |
|---|---|---|---|
| A | 1347 | 5 | 0.371195% |
| B | 1347 | 42 | 3.118040% |
| C | 1347 | 53 | 3.934670% |
| D | 1346 | 26 | 1.931649% |
Noise dominated data is calculated using 1-second bins in cleaned event files. If a bin has >2000 counts, and if more than 50% of those come from <1% of pixels, then it is considered to be noise-dominated and hence unusable.
| Quadrant | # 1 sec bins | Bins with >0 counts | Bins with >2000 counts | High rate bins dominated by noise | Noise dominated (total time) | Noise dominated (detector-on time) | Marked lightcurve |
|---|---|---|---|---|---|---|---|
| A | 1347 | 1347 | 0 | 0 | 0.00% | 0.00% | 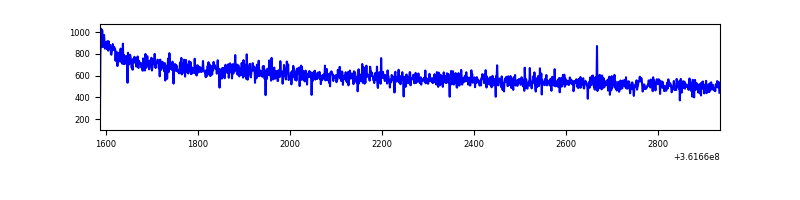 |
| B | 1347 | 1347 | 5 | 5 | 0.37% | 0.37% | 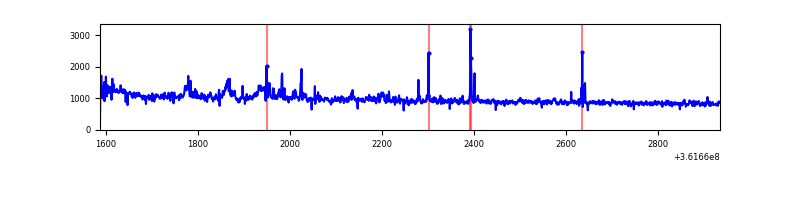 |
| C | 1347 | 1347 | 1 | 1 | 0.07% | 0.07% | 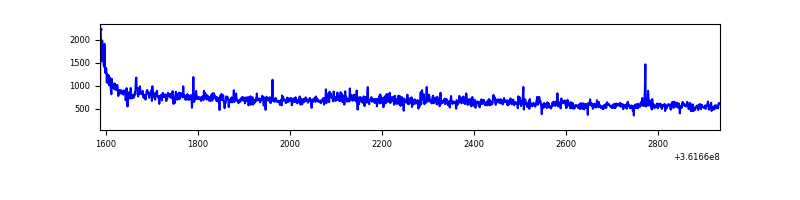 |
| D | 1346 | 1346 | 14 | 14 | 1.04% | 1.04% | 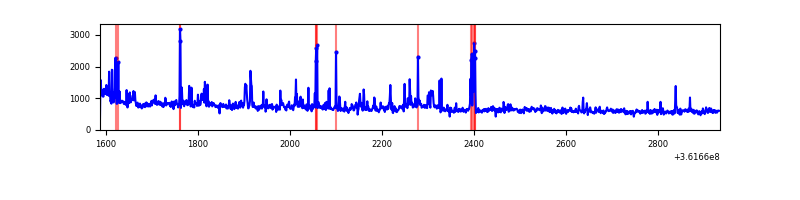 |
Top three noisy pixels from each quadrant. If the there are fewer than three noisy pixels in the level2.evt file, extra rows are filled as -1
| Pixel properties | Quadrant properties | ||||||
|---|---|---|---|---|---|---|---|
| Quadrant | DetID | PixID | Counts | Sigma | Mean | Median | Sigma |
| A | 13 | 254 | 3267 | 72.58 | 206 | 203 | 42.2 |
| A | 0 | 226 | 1810 | 38.07 | 206 | 203 | 42.2 |
| A | 3 | 137 | 1748 | 36.6 | 206 | 203 | 42.2 |
| B | 6 | 159 | 409623 | 10163.3 | 209 | 205 | 40.3 |
| B | 0 | 199 | 26531 | 653.51 | 209 | 205 | 40.3 |
| B | 5 | 255 | 25950 | 639.09 | 209 | 205 | 40.3 |
| C | 3 | 233 | 59401 | 1209.25 | 204 | 206 | 49.0 |
| C | 14 | 238 | 36327 | 737.89 | 204 | 206 | 49.0 |
| C | 4 | 175 | 8427 | 167.94 | 204 | 206 | 49.0 |
| D | 8 | 195 | 119542 | 2390.32 | 203 | 198 | 49.9 |
| D | 13 | 249 | 63455 | 1266.96 | 203 | 198 | 49.9 |
| D | 12 | 233 | 23246 | 461.62 | 203 | 198 | 49.9 |
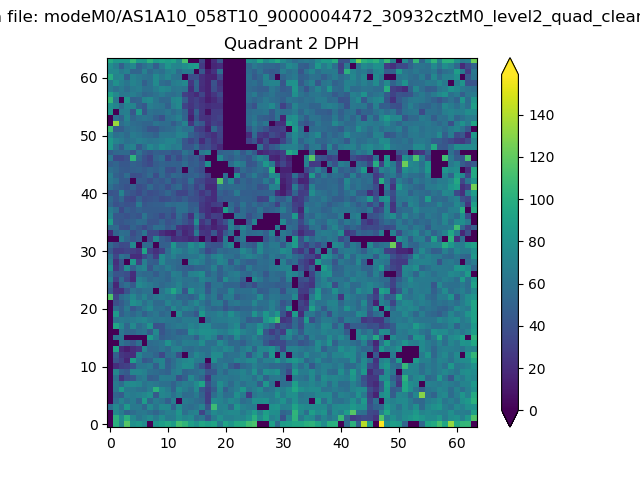
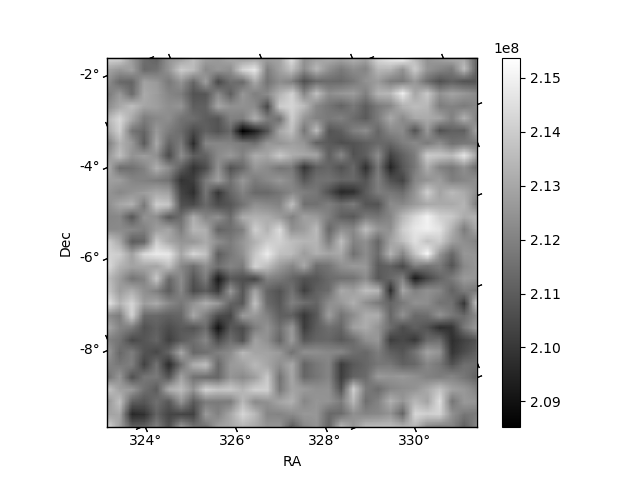
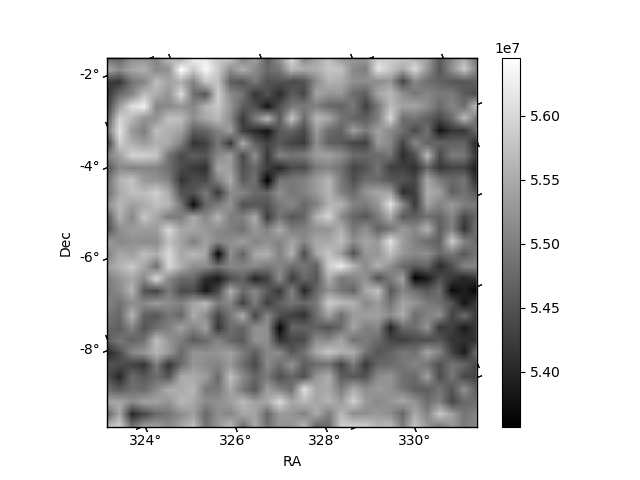
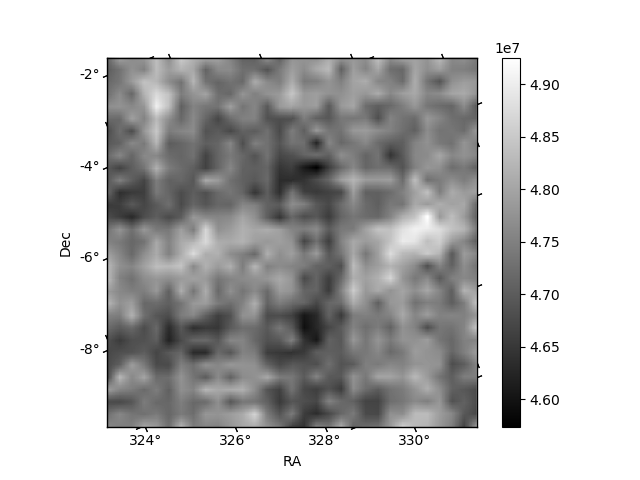
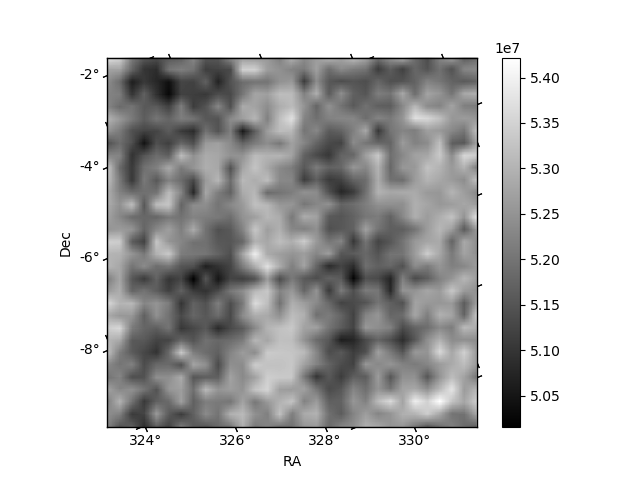
Histogram calculated using DETX and DETY for each event in the final _common_clean file
| Quadrant A | 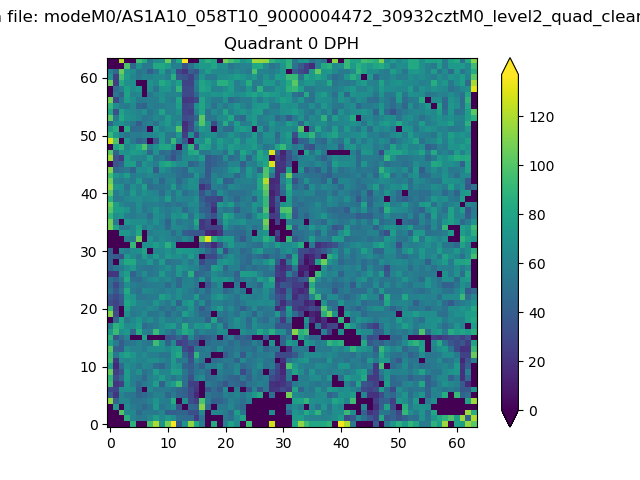 |
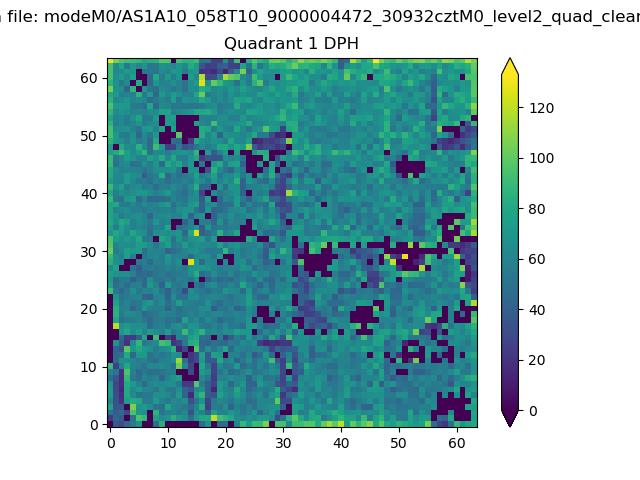 |
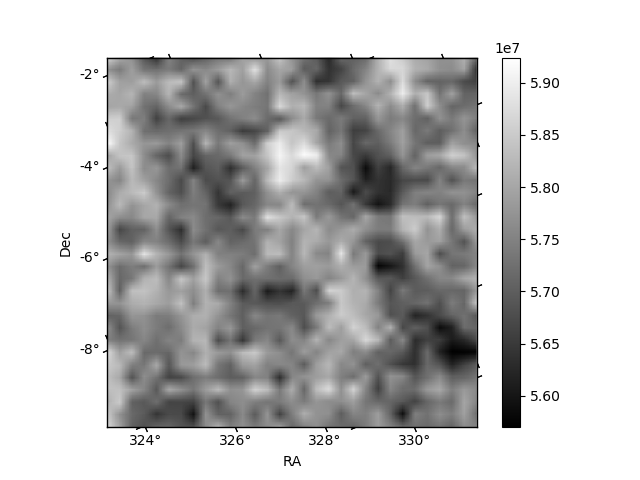
Quadrant B |
|---|---|---|---|
| Quadrant D | 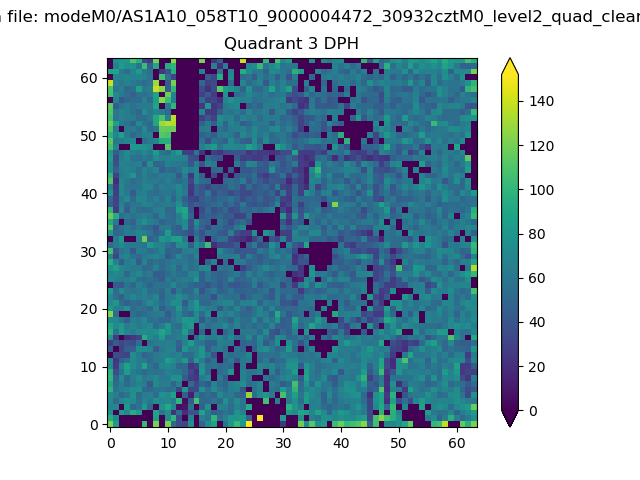 |
 |
Quadrant C |
| Plot type | Count rate plots | Images |
|---|---|---|
| Comparison with Poisson distribution Blue bars denote a histogram of data divided into 1 sec bins. Red curve is a Poisson curve with rate = median count rate of data. |
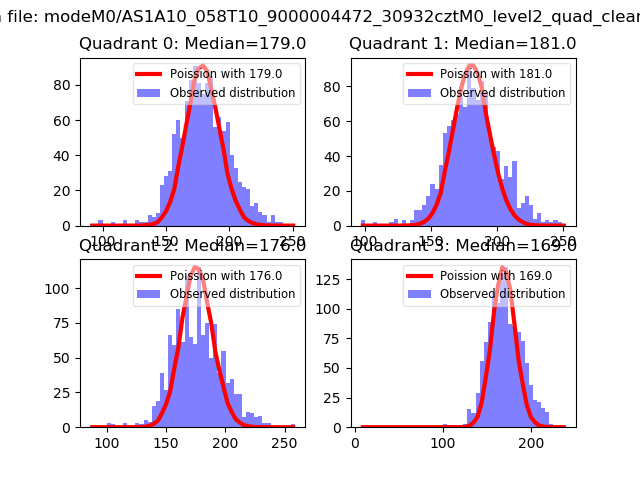 |
 |
| Quadrant-wise count rates Data is divided into 100 sec bins |
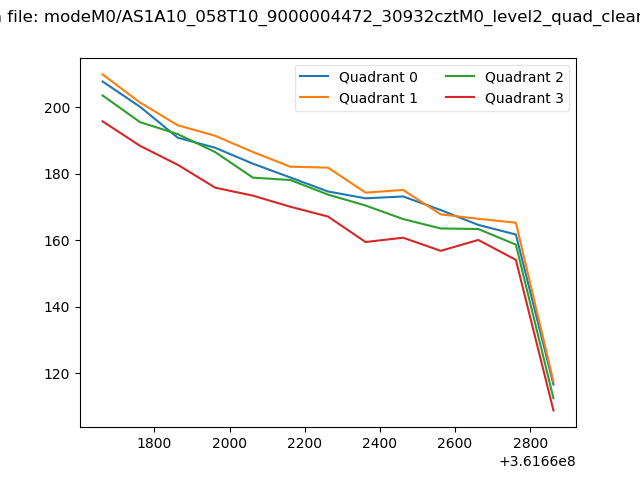 |
|
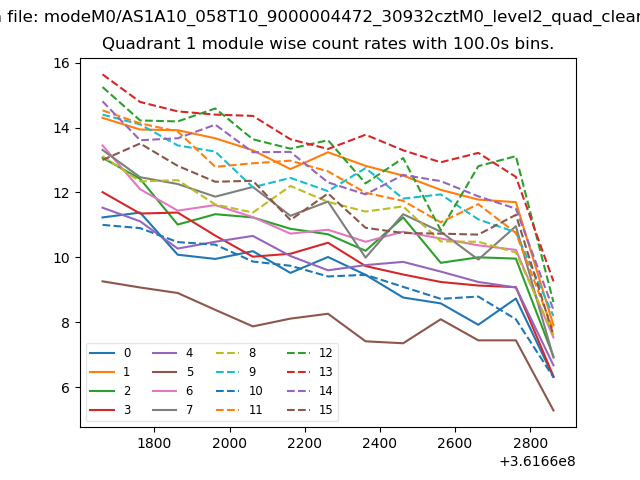
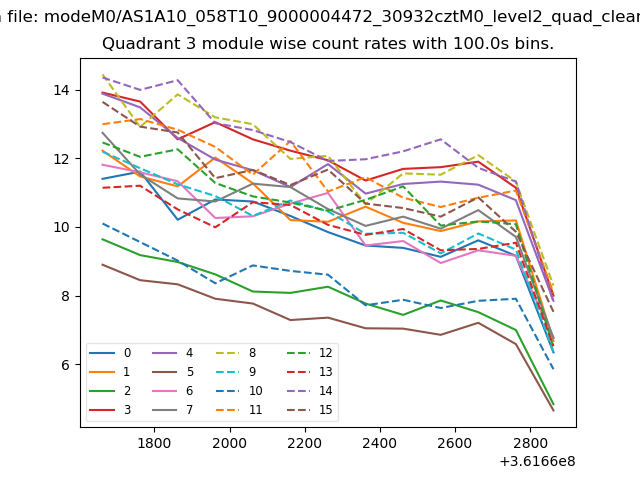
| Module-wise count rates for Quadrant A Data is divided into 100 sec bins |
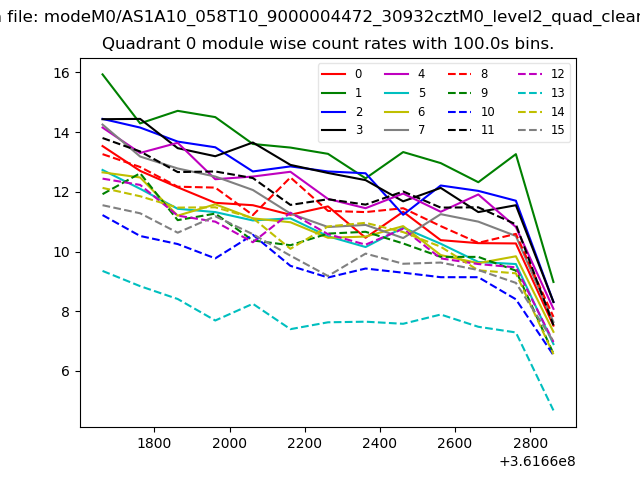 |
 |
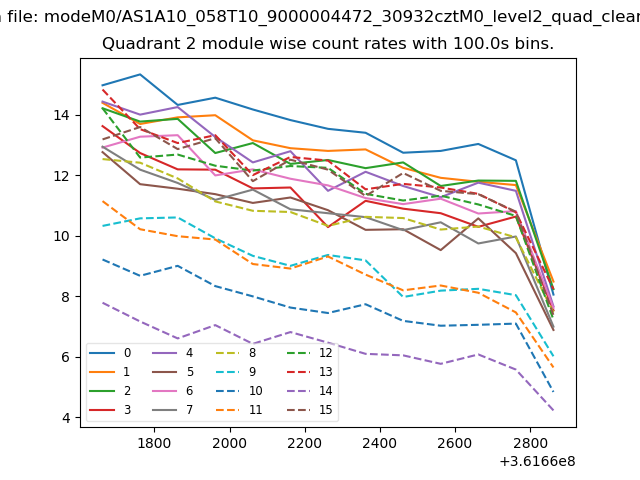
| Module-wise count rates for Quadrant B Data is divided into 100 sec bins |
 |
 |
| Module-wise count rates for Quadrant C Data is divided into 100 sec bins |
 |
 |
| Module-wise count rates for Quadrant D Data is divided into 100 sec bins |
 |
 |
| Parameter | Plot |
|---|---|
| CZT HV Monitor | 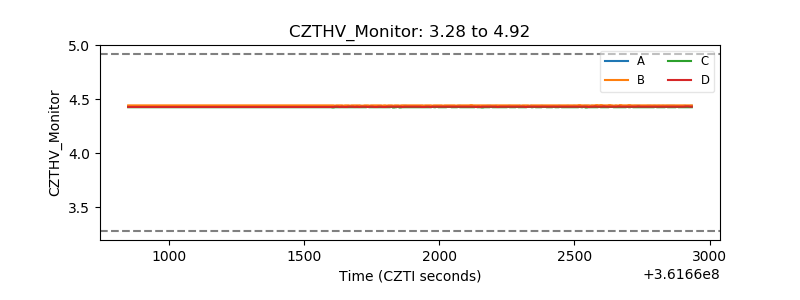 |
| D_VDD | 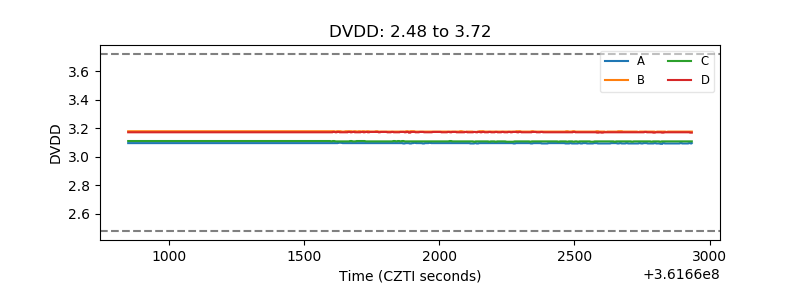 |
| Temperature 1 | 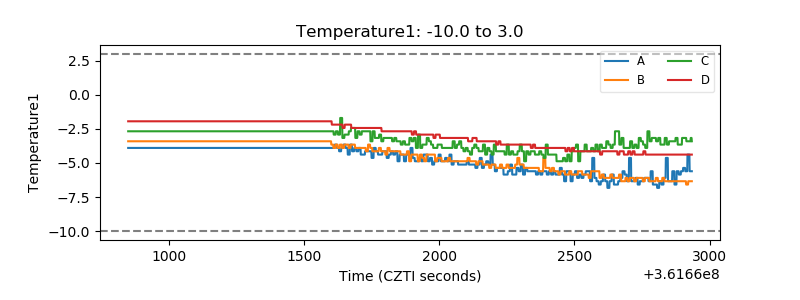 |
| Veto HV Monitor | 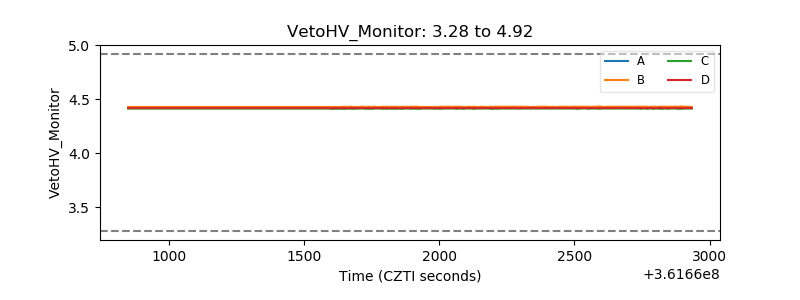 |
| Veto LLD | 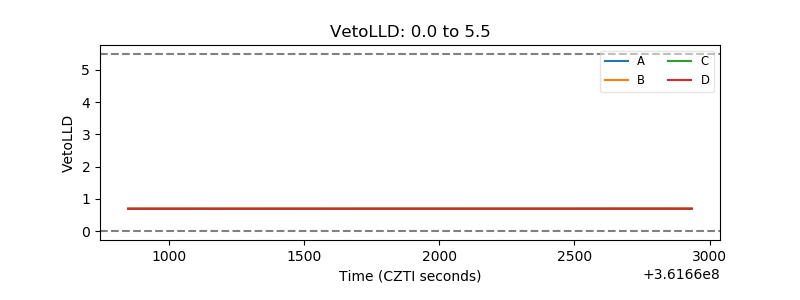 |
| Alpha Counter | 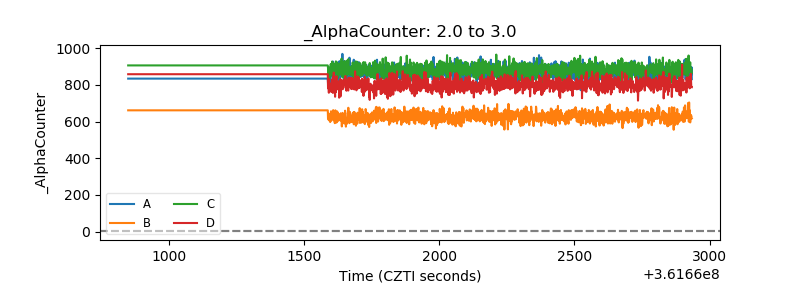 |
| _CPM_Rate | 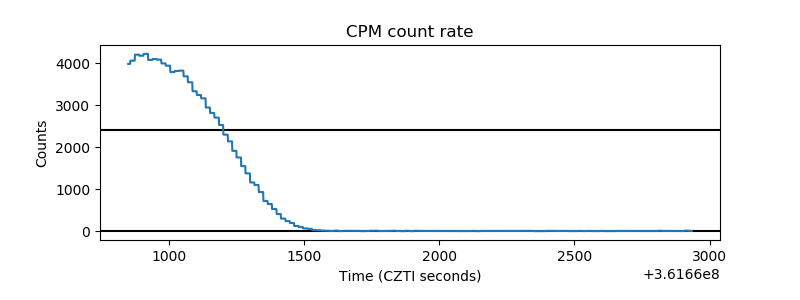 |
| CZT Counter | 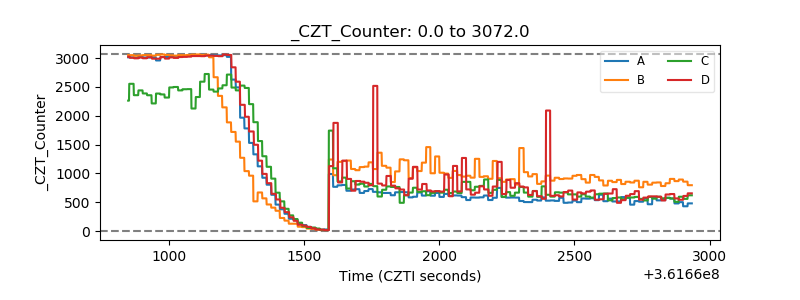 |
| +2.5 Volts monitor |  |
| +5 Volts monitor | 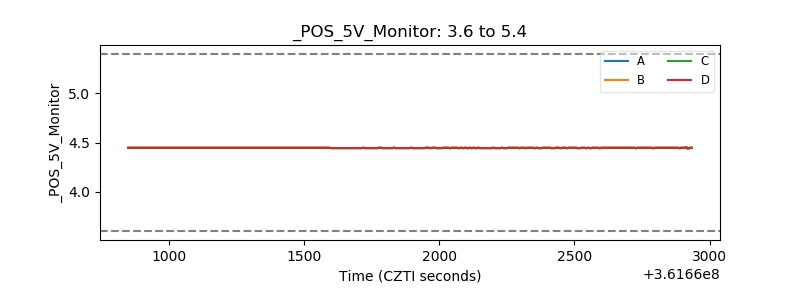 |
| _ROLL_ROT | 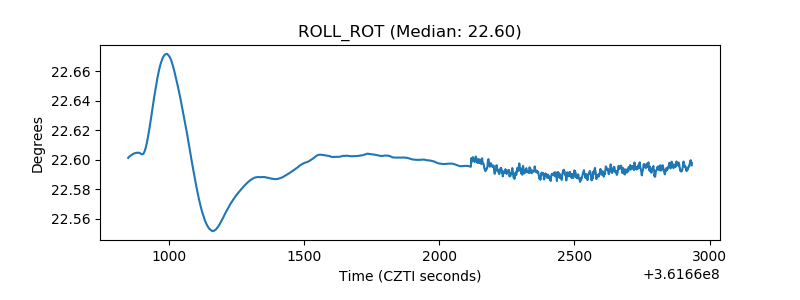 |
| _Roll_DEC | 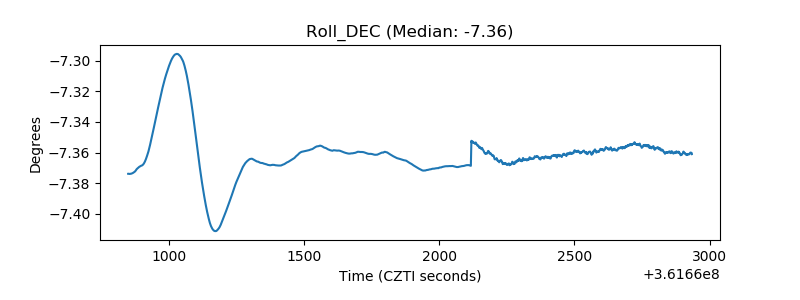 |
| _Roll_RA | 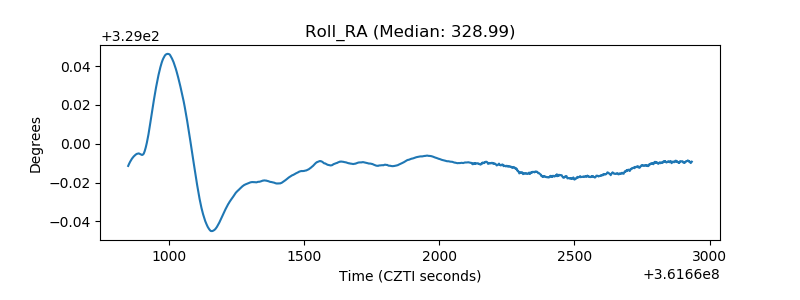 |
| Veto Counter | 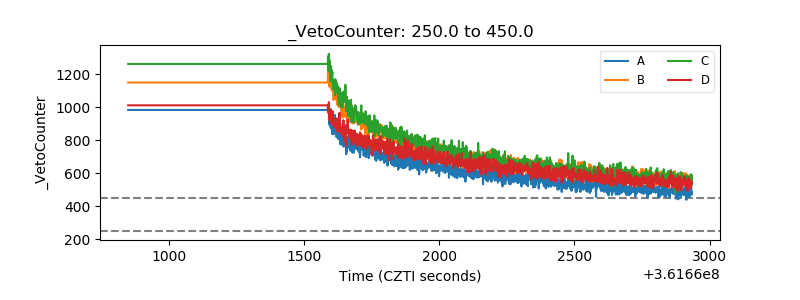 |