| Param | Original file | Final file |
|---|---|---|
| Filename | modeM0/AS1A10_058T10_9000004472_30934cztM0_level2.evt | modeM0/AS1A10_058T10_9000004472_30934cztM0_level2_quad_clean.evt |
| Size (bytes) | 537,364,800 | 108,529,920 |
| Size | 512.5 MB | 103.5 MB |
| Events in quadrant A | 3,244,969 | 728,275 |
| Events in quadrant B | 5,219,423 | 733,100 |
| Events in quadrant C | 3,692,208 | 694,071 |
| Events in quadrant D | 3,690,595 | 691,667 |
| Mode M0 | |||
|---|---|---|---|
| Quadrant | BADHDUFLAG | Total packets | Discarded packets |
| A | 0 | 13452 | 2 |
| B | 0 | 19601 | 2 |
| C | 0 | 14830 | 2 |
| D | 0 | 14870 | 2 |
| Mode M9 | |||
|---|---|---|---|
| Quadrant | BADHDUFLAG | Total packets | Discarded packets |
| A | 0 | 13 | 0 |
| B | 0 | 14 | 0 |
| C | 0 | 14 | 0 |
| D | 0 | 14 | 0 |
| Mode SS | |||
|---|---|---|---|
| Quadrant | BADHDUFLAG | Total packets | Discarded packets |
| A | 0 | 130 | 0 |
| B | 0 | 130 | 0 |
| C | 0 | 130 | 0 |
| D | 0 | 130 | 0 |
| Quadrant | Total seconds | Saturated seconds | Saturation percentage |
|---|---|---|---|
| A | 6296 | 29 | 0.460610% |
| B | 6296 | 124 | 1.969504% |
| C | 6296 | 333 | 5.289072% |
| D | 6296 | 79 | 1.254765% |
Noise dominated data is calculated using 1-second bins in cleaned event files. If a bin has >2000 counts, and if more than 50% of those come from <1% of pixels, then it is considered to be noise-dominated and hence unusable.
| Quadrant | # 1 sec bins | Bins with >0 counts | Bins with >2000 counts | High rate bins dominated by noise | Noise dominated (total time) | Noise dominated (detector-on time) | Marked lightcurve |
|---|---|---|---|---|---|---|---|
| A | 7621 | 6297 | 0 | 0 | 0.00% | 0.00% | 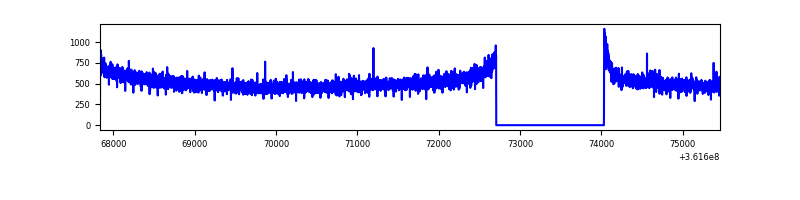 |
| B | 7621 | 6297 | 6 | 6 | 0.08% | 0.10% | 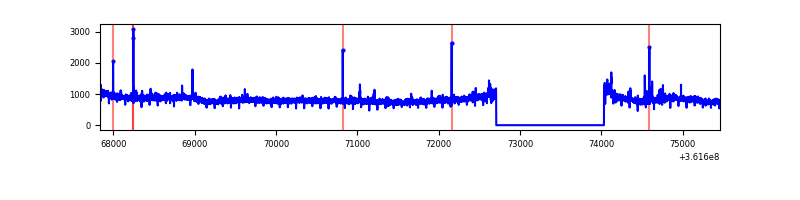 |
| C | 7621 | 6297 | 15 | 15 | 0.20% | 0.24% | 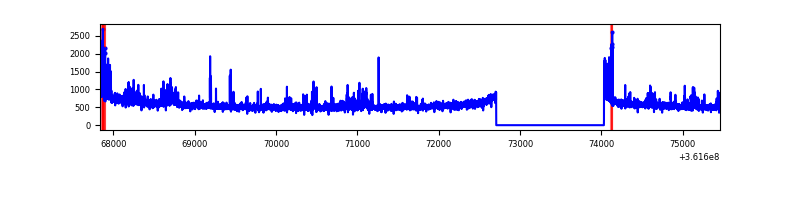 |
| D | 7621 | 6297 | 51 | 51 | 0.67% | 0.81% | 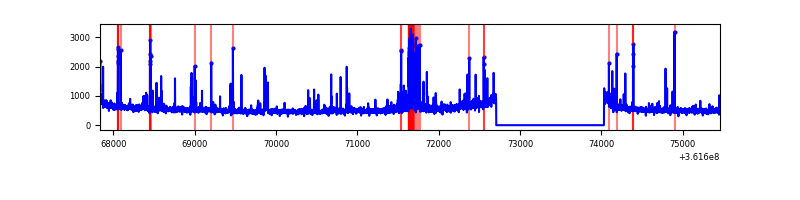 |
Top three noisy pixels from each quadrant. If the there are fewer than three noisy pixels in the level2.evt file, extra rows are filled as -1
| Pixel properties | Quadrant properties | ||||||
|---|---|---|---|---|---|---|---|
| Quadrant | DetID | PixID | Counts | Sigma | Mean | Median | Sigma |
| A | 13 | 254 | 12529 | 70.33 | 841 | 825 | 166.4 |
| A | 3 | 137 | 7825 | 42.06 | 841 | 825 | 166.4 |
| A | 0 | 226 | 7256 | 38.65 | 841 | 825 | 166.4 |
| B | 6 | 159 | 1813615 | 11564.91 | 838 | 819 | 156.7 |
| B | 0 | 190 | 34059 | 212.06 | 838 | 819 | 156.7 |
| B | 5 | 172 | 26998 | 167.01 | 838 | 819 | 156.7 |
| C | 14 | 238 | 197033 | 1038.91 | 806 | 814 | 188.9 |
| C | 0 | 10 | 133980 | 705.07 | 806 | 814 | 188.9 |
| C | 14 | 254 | 93861 | 492.65 | 806 | 814 | 188.9 |
| D | 8 | 195 | 251131 | 1292.73 | 822 | 805 | 193.6 |
| D | 2 | 250 | 147586 | 758.01 | 822 | 805 | 193.6 |
| D | 12 | 233 | 79177 | 404.73 | 822 | 805 | 193.6 |
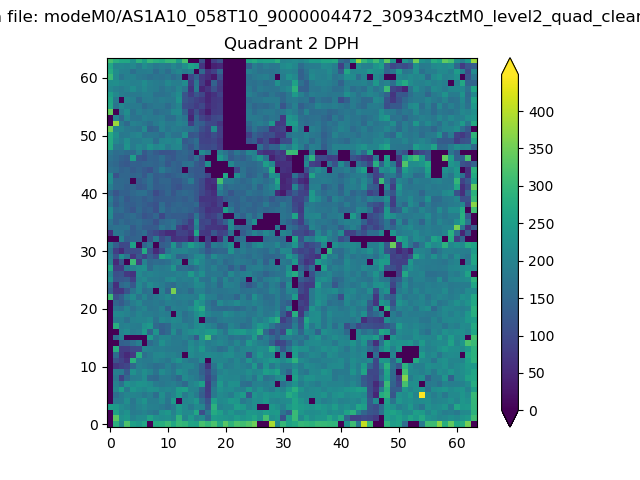
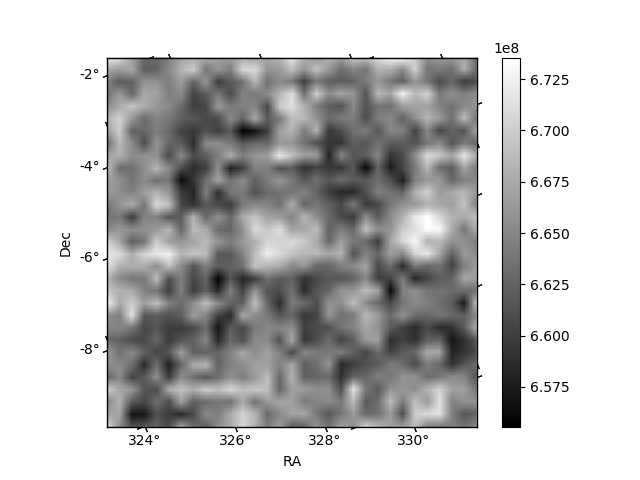
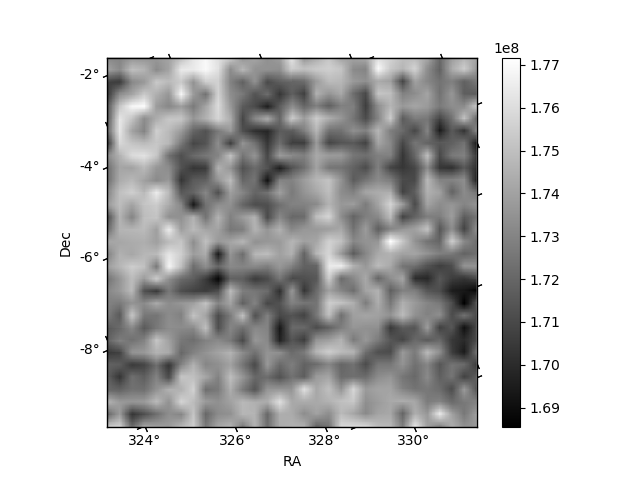
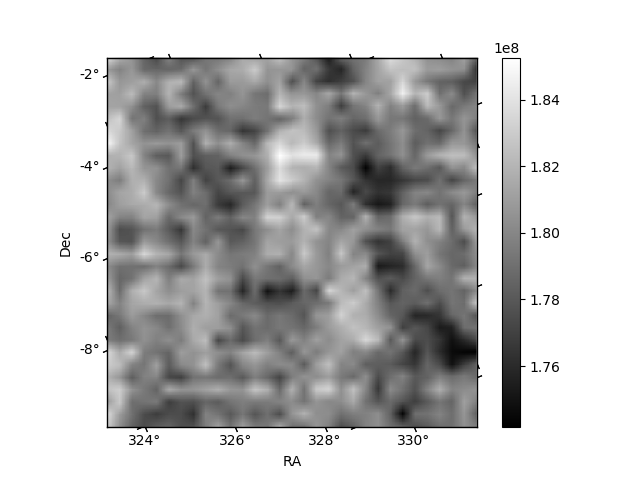
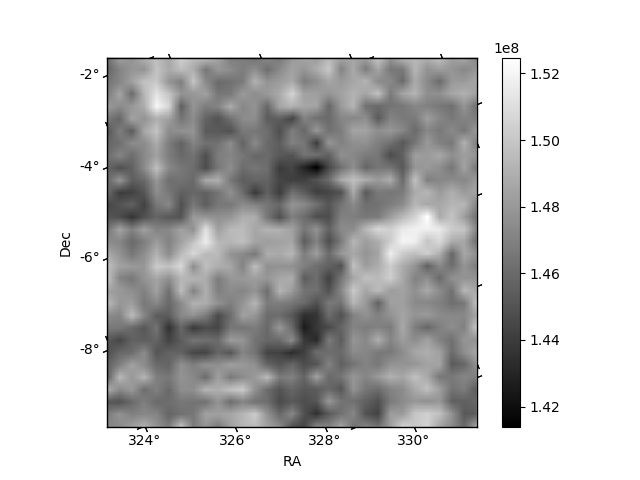
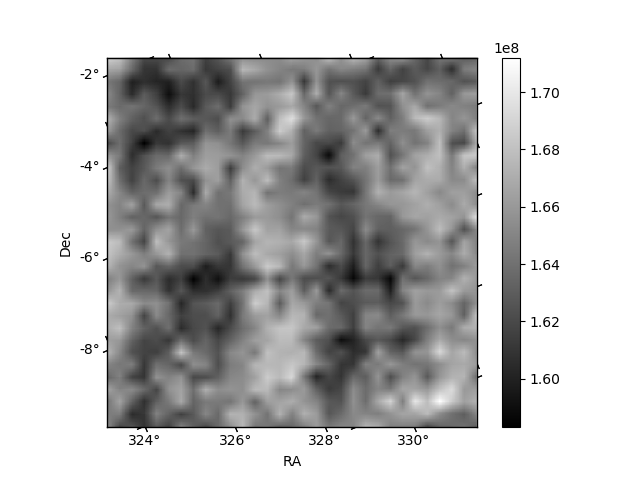
Histogram calculated using DETX and DETY for each event in the final _common_clean file
| Quadrant A | 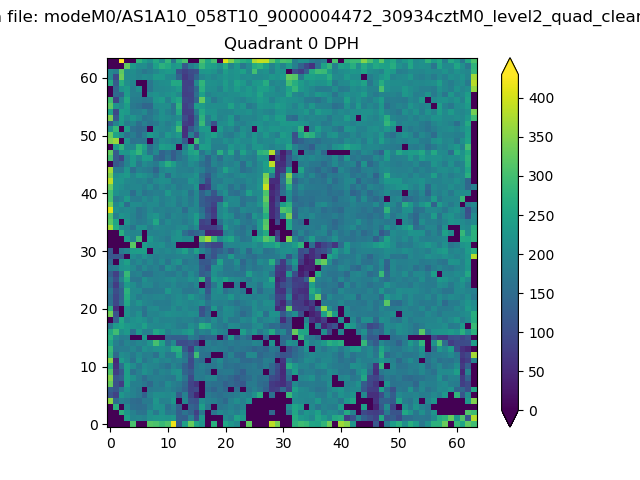 |
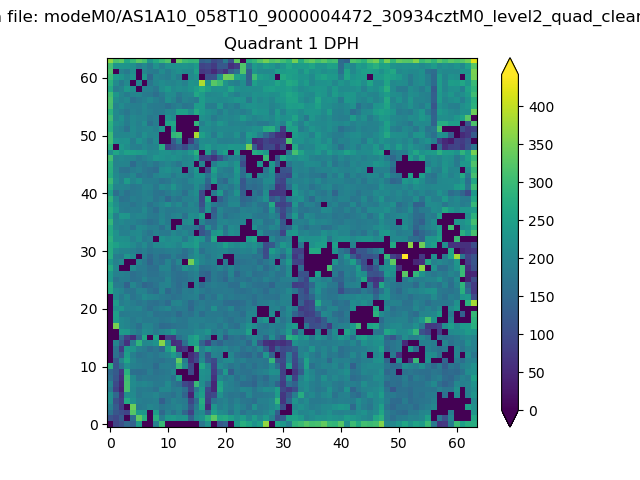 |
Quadrant B |
|---|---|---|---|
| Quadrant D | 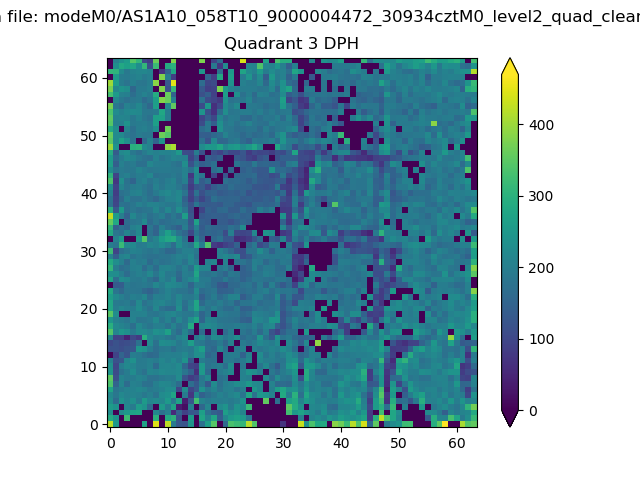 |
 |
Quadrant C |
| Plot type | Count rate plots | Images |
|---|---|---|
| Comparison with Poisson distribution Blue bars denote a histogram of data divided into 1 sec bins. Red curve is a Poisson curve with rate = median count rate of data. |
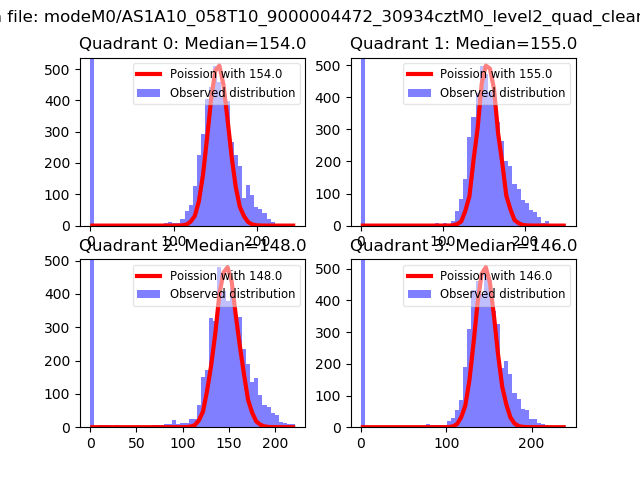 |
 |
| Quadrant-wise count rates Data is divided into 100 sec bins |
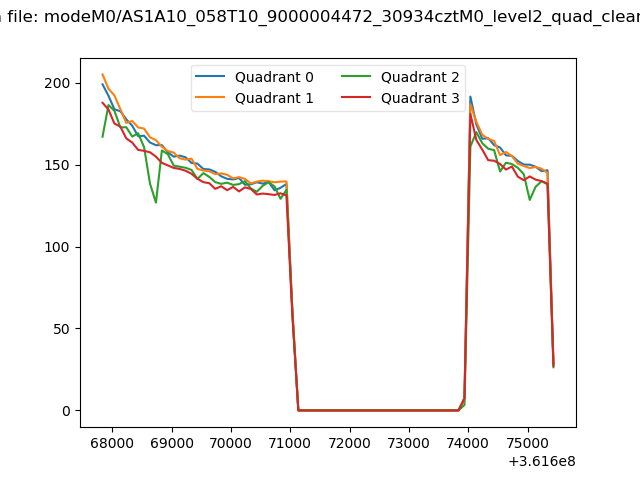 |
|
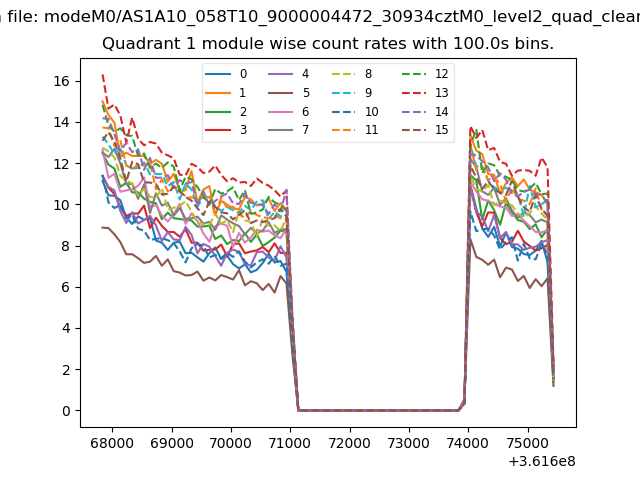
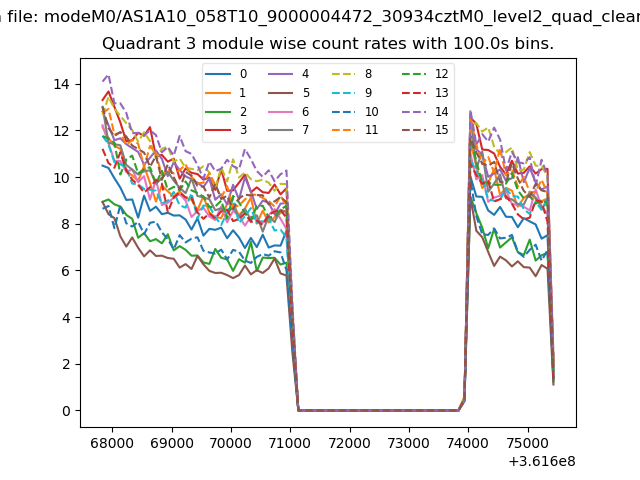
| Module-wise count rates for Quadrant A Data is divided into 100 sec bins |
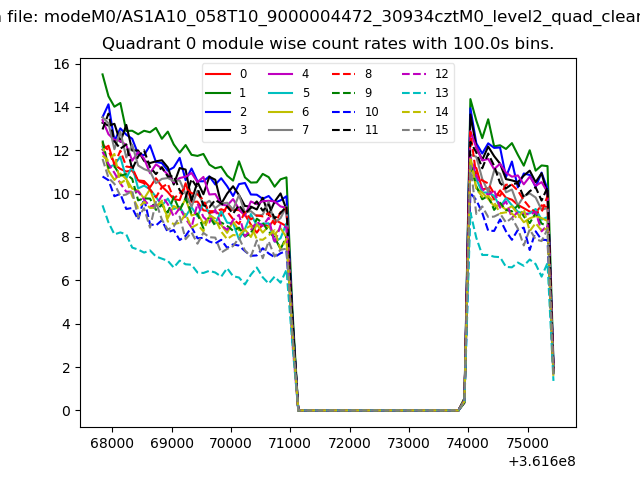 |
 |
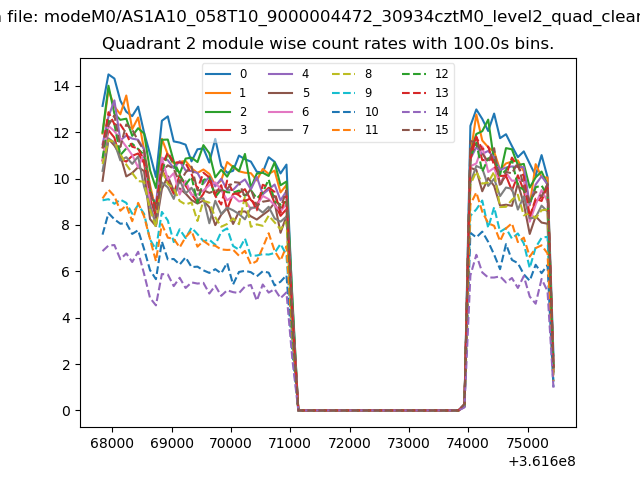
| Module-wise count rates for Quadrant B Data is divided into 100 sec bins |
 |
 |
| Module-wise count rates for Quadrant C Data is divided into 100 sec bins |
 |
 |
| Module-wise count rates for Quadrant D Data is divided into 100 sec bins |
 |
 |
| Parameter | Plot |
|---|---|
| CZT HV Monitor | 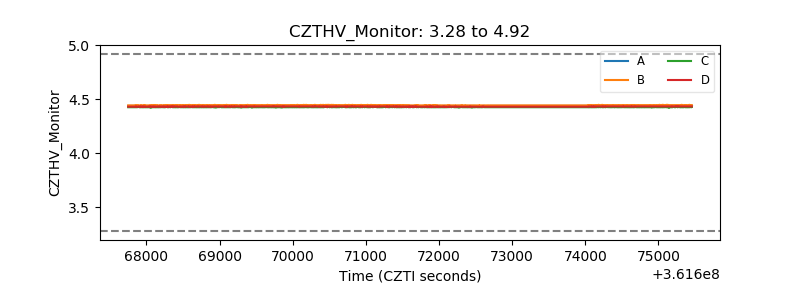 |
| D_VDD | 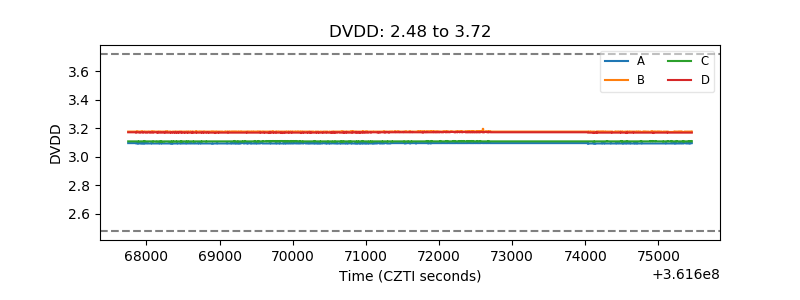 |
| Temperature 1 | 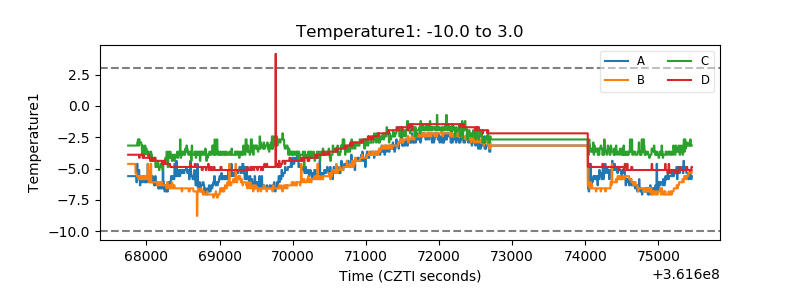 |
| Veto HV Monitor | 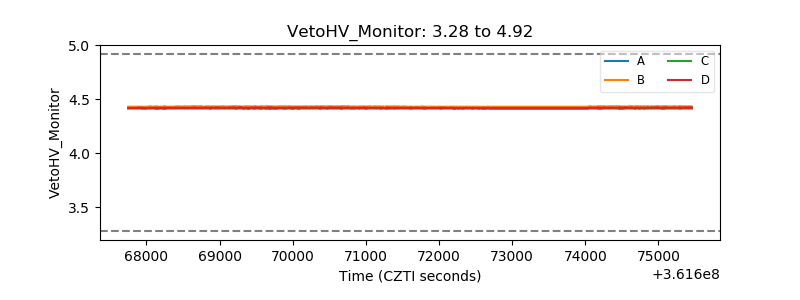 |
| Veto LLD | 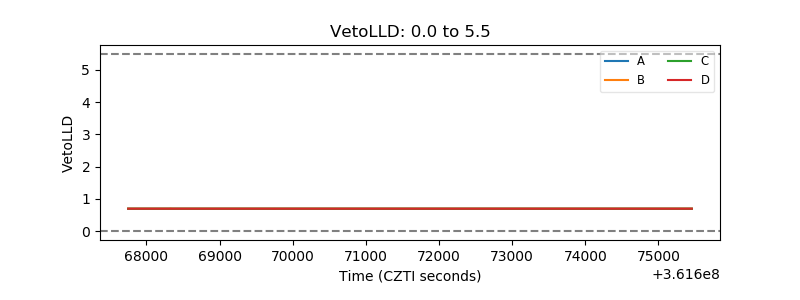 |
| Alpha Counter | 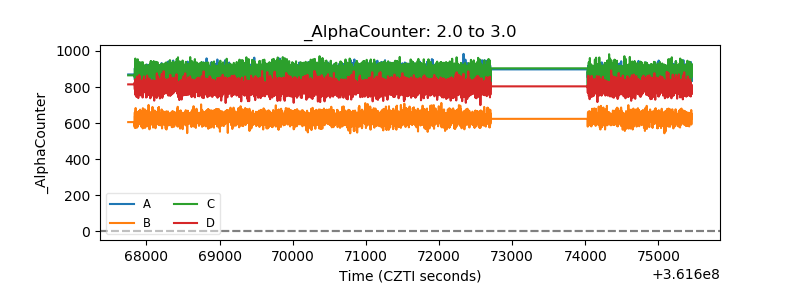 |
| _CPM_Rate | 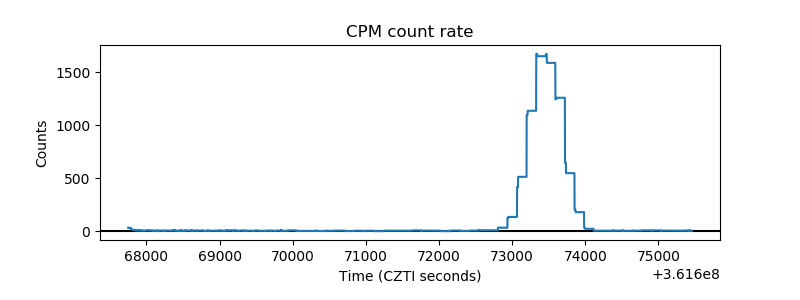 |
| CZT Counter | 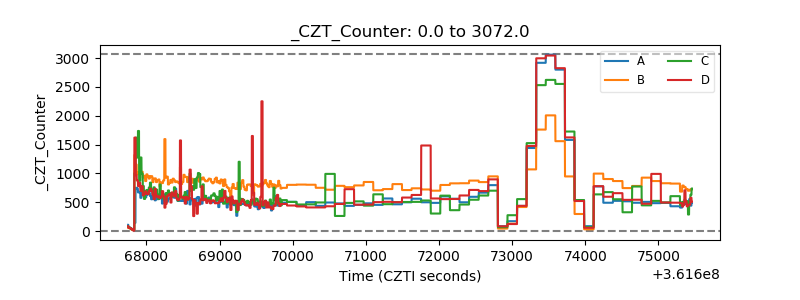 |
| +2.5 Volts monitor |  |
| +5 Volts monitor |  |
| _ROLL_ROT | 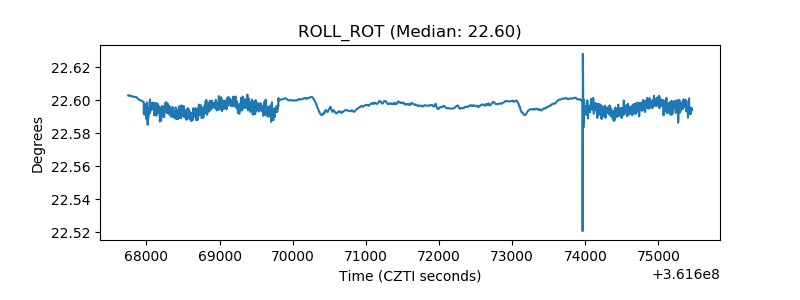 |
| _Roll_DEC | 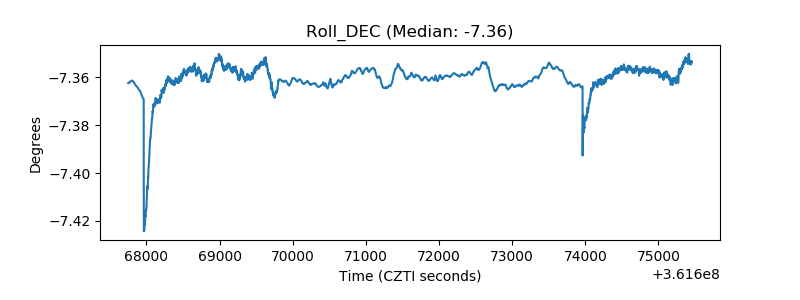 |
| _Roll_RA | 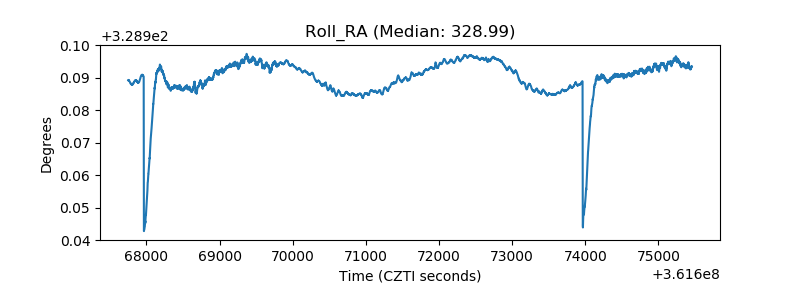 |
| Veto Counter | 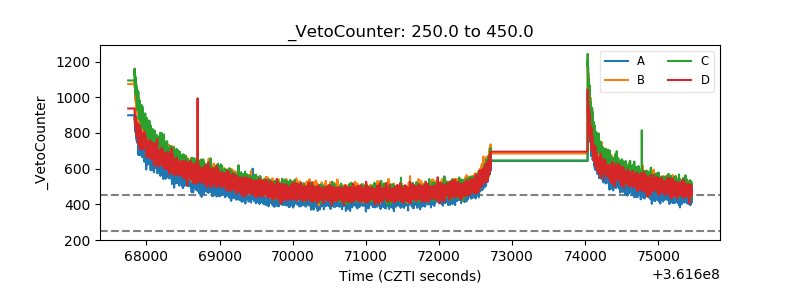 |